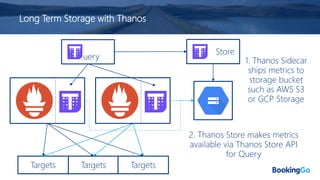
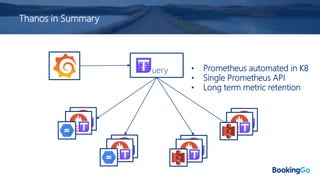
Scaling Prometheus on Kubernetes
Tom Riley @ Booking.com
BookingGo.Cloud ??
Kubernetes
Delivery Platform
Self Service for
Development Teams
Everything as Code
100% Customer
Focused &
100% Business Value
Cloud Native
Learn safely
in Production
Public Cloud
We ❤️ Open Source
BookingGo.Cloud Infrastructure
BookingGo.Cloud Environments
• Dev..
• Test..
• Production..
• Tooling..
• ..plus multiple regions!
• 10 Kubernetes clusters in total and more in the pipeline!
What are we doing with Observability?
Past..
• Delivered Logging & Events on Kubernetes using Elastic Stack
Present..
• Deliver a product around Time Series Metrics that is suitable for BookingGo.Cloud
including alerting as code feature
• Continuously evolve and update our BookingGo Monitoring & Observability defaults
• Deliver a learning path around Observability; helping users onboard to BookingGo.Cloud
and further extend their knowledge via workshops and documentation
Future..
• OpenTracing for BookingGo.Cloud
• Continue evolving Observability culture
Time Series Metrics Project Goals
• Provide engineer friendly tooling and instrumentation libraries
• Low cardinality monitoring; but one datastore fits all contexts
• First class API support; no vendor lock-in, open source
• Single pane of glass for Monitoring
• Monitoring as code; Kubernetes native experience
• Provide consistent mechanism for Alerting based on Metrics
• Reboot monitoring culture at BookingGo
Monitoring & Observability as part of the
application development lifecycle
Prometheus
Kubernetes Infrastructure
and Application
Monitoring with
Prometheus
Prometheus – What is it?
• Prometheus is a metrics oriented Monitoring solution (TSDB & Tooling)
• Released by SoundCloud in 2012
• Prometheus project joined Cloud Native Computing Foundation in 2016
• During 2018, become the second project to graduate from incubation
alongside Kubernetes
Prometheus – What is it?
Prometheus
Application
Service
Discovery Application
Exporter
Alert
Manager
Grafana
Prometheus - Day One
• Deployed kube-prometheus example to all of our K8 clusters
• Each cluster then had a single Prometheus instance and Grafana front end
• Encourage development teams to start exposing Prometheus metrics from
day one
• Opportunity to see if Prometheus was the right technology for us with
very little upfront investment required – learning safely in production!
• Will the development teams get value from it?
• Do we feel the technology fits within Kubernetes?
bit.ly/2S6Lmq0
Prometheus - Day One Learnings
Happy
Development
Teams!
Prometheus - Day One Learnings
Prometheus
❤️
Kubernetes
Kubernetes Prometheus Operator
• Defines Custom Resource Definitions (CRD) for deploying and configuring
Prometheus & AlertManager
• As simple as:
• Deploy the operator to your Kubernetes cluster
• Start deploying the CRD objects to define your Prometheus setup
• Operator launches Prometheus pods automatically based on CRD
configuration
Kubernetes Prometheus Operator
Deploy Prometheus
bit.ly/2R7ohn8
Kubernetes Prometheus Operator
Configure Prometheus
Targets
bit.ly/2R7ohn8
Next Steps..
• We decided to continue ahead with use of Prometheus
• But we had determined a number of challenges..
1. How do we run HA Prometheus in our K8 clusters?
2. How do we achieve the single pane of glass when we have so many
distributed instances of Prometheus?
3. How do we scale Prometheus retention from days to months or even
years?
Next Steps..
• What are the common patterns for tackling these problems?
• How did we approach this?
• We keep a close eye on sources of information, blogs, tech talks on
YouTube, KubeCon/PromCon videos, etc.
• We attended conferences to learn from others!
• Read documentation and best practices
• Keep a close eye on new and evolving projects from GitHub, etc.
Highly Available Prometheus
Targets Targets Targets
Prometheus x1
Scrape Targets
Highly Available Prometheus
Targets Targets Targets
Prometheus x2
Highly Available!
Scrape Targets,
Twice!
Highly Available Prometheus
Challenges:
• We have two sources of
duplicate metrics!
• Well, so called duplicates
– metrics will vary
between the two slightly!
• Which do we use?
Highly Available Prometheus
Targets Targets Targets
Use a Load Balancer
Load Balancer
Highly Available Prometheus
Targets Targets Targets
Could use something
like HA Proxy
HA Proxy
Highly Available Prometheus
Targets Targets Targets
Use a Service when
running in K8
Kubernetes Service
Highly Available Prometheus
Targets Targets Targets
Not without its challenges:
• When you refresh the data,
you will see it change as
metrics will potentially differ
between the two instances
Kubernetes Service
Highly Available Prometheus
Targets Targets Targets
Not without its challenges:
• When you refresh the data,
you will see it change as
metrics will potentially differ
between the two instances
• Use sticky load balancing or
make the second instance a
hot standby
• This solution is becoming
complicated and does not
scale with query load
Kubernetes Service
Challenges
1. How do we run HA Prometheus in our K8 clusters?
2. How do we achieve the single pane of glass when we have so many
distributed instances of Prometheus?
3. How do we scale Prometheus retention from days to months or even
years?
Federated Prometheus
Scrape metrics at
/federate to centralized
Prometheus instance
Federated Prometheus
Add Grafana..
Single Pane of Glass!!
Federated Prometheus
Also not without its challenges..
• Duplicating metrics is costly
• Have to configure desired metrics you
wish to federate and can easily be
forgotten
• Single point of failure
Prometheus for Practioners @ Monitorama EU 2018
Slides:
https://bit.ly/2AqB11d
Monitorama Talk:
https://vimeo.com/289893972
Challenges
1. How do we run HA Prometheus in our K8 clusters?
2. How do we achieve the single pane of glass when we have so many
distributed instances of Prometheus?
3. How do we scale Prometheus retention from days to months or even
years?
Long Term Storage
Storage
Storage Storage
Long Term Storage
Storage
• Prometheus was initially designed for short
metrics retention, it was designed for
monitoring & alerting on what is
happening ‘now’
• Local storage can be expensive, especially if
using SSD
• We wanted to store years of metrics, will
this scale efficiently with Prometheus?
Long Term Storage
• Remote write/read API
• Prometheus has remote storage APIs
• Concerns around the complexity of operating Elasticsearch or similar
alongside Prometheus
https://bit.ly/2zt5try
Challenges
1. How do we run HA Prometheus in our K8 clusters?
2. How do we achieve the single pane of glass when we have so many
distributed instances of Prometheus?
3. How do we scale Prometheus retention from days to months or even
years?
Hello, Thanos
Thanos – What is it?
“Thanos is a set of components
that can be composed into a
highly available metric system
with unlimited storage capacity”
Thanos – What is it?
Developed and open-sourced by
engineers at London based Improbable
github.com/improbable-eng/thanos
619 commits, 2.3k GitHub stars, 50 contributors
Thanos – What does it do?
• Designed to work in Kubernetes, supported by the Prometheus-Operator
• Global querying view across all connected Prometheus servers
• Deduplication and merging of metrics collected from Prometheus HA pairs
• Seamless integration with existing Prometheus setups
• Any object storage as its only, optional dependency
• Downsampling historical data for massive query speedup
• Cross-cluster federation
• Fault-tolerant query routing
• Simple gRPC "Store API" for unified data access across all metric data
• Easy integration points for custom metric providers
https://bit.ly/2KCAWfB
Challenges
Thanos helps to tackle all these problems in a different way..
1. How do we run HA Prometheus in our K8 clusters?
2. How do we achieve the single pane of glass when we have so many
distributed instances of Prometheus?
3. How do we scale Prometheus retention from days to months or even
years?
HA Prometheus with Thanos
Targets Targets Targets
HA Prometheus with Thanos
Targets Targets Targets
Query
2. Thanos
Query makes
gRPC call to
Thanos sidecar
for metrics and
de-duplicates
1. Thanos
sidecar
deployed
alongside
Prometheus in
Kubernetes
Pod using
operator
3. Thanos
Query exposes
Prometheus
HTTP API or
gRPC
Federation with Thanos
Use a centralized instance
of Thanos Query to
federate the edge
instances of Prometheus &
Thanos
Query
Federation with Thanos
Query
No need to scrape metrics to a
centralized Prometheus
Query scales horizontally therefore
eliminating the single point of failure!
Prometheus instances running
at the edge now HA & metrics
are de-duplicated. We operate
these in both AWS & GCP
within K8
Point Grafana at single Prometheus
HTTP API with metrics from all
environments
Challenges
1. How do we run HA Prometheus in our K8 clusters?
2. How do we achieve the single pane of glass when we have so many
distributed instances of Prometheus?
3. How do we scale Prometheus retention from days to months or even
years?
Long Term Storage with Thanos
Targets Targets Targets
Query 1. Thanos Sidecar
ships metrics to
storage bucket
such as AWS S3
or GCP Storage
Store
2. Thanos Store makes metrics
available via Thanos Store API
for Query
How??
Memory Block
Targets
Targets
Disk Block
Long Term Storage with Thanos
• Significantly reduce storage requirements of each Prometheus instance –
only need to story around 2 to 24 hours of metrics
• Significantly cheaper storing metrics in a bucket versus scaling SSD storage
• Thanos Compact executes compression of Prometheus TSDB data within
the bucket and also downsamples data for when querying over long time
periods – keeps raw (1m), 5m & 15m samples
• Query automatically de-duplicates data within Prometheus and metrics
store in the storage bucket
• Thanos is built from Prometheus TSDB code – not redesigning the wheel
Thanos in Summary
Query • Prometheus automated in K8
• Single Prometheus API
• Long term metric retention
How do we make this self-serve?
• Deployments to BookingGo.Cloud are automated using our BGCloud CLI
& Helm charts that we own
• To self-serve metrics..
1. Expose Prometheus supported metrics endpoint for application
2. Set helm value to configure path to metrics endpoint and enable
metrics
3. Deploy to platform using CLI tool via CI/CD pipeline
4. Start building dashboards in Grafana!
How do we make this self-serve?
• It is as simple as setting this in the applications self-contained
configuration and deploying via a pipeline:
bookinggo:
metrics:
enabled: true
path: /actuator/prometheus
Things I’ve missed..
• We are building an Observability culture at BookingGo to ensure good quality
monitoring becomes part of application development lifecycle, including its
operation! – Prometheus and Thanos is just one part of the tooling to enable
this
• Alerting as a Service – Development teams have full control over alerting
configuration and is part of a code deployment of their application
• How to monitor Kubernetes infrastructure – so many metrics are exposed out
the box or easily available using Prometheus exporters
• How we actually deploy all of this to Kubernetes – we use Helm and write our
charts to fit the use case if one is not available in the open source community!
• So much more…
Learn more about Thanos
• If you want to learn more about Thanos search for ‘PromCon 2018: Thanos
- Prometheus at Scale’ on YouTube
• https://bit.ly/2P6edZE
• Join Improbable’s engineering Slack group to chat #thanos
• improbable-eng.slack.com
• Follow the project on GitHub
• https://github.com/improbable-eng/thanos
• Prometheus: Up & Running book
• https://oreil.ly/2r74zN5
Thank you for listening!
Questions?
E: thomas.riley@booking.com
S: Riley @ kubernetes.slack.com

Scaling Prometheus on Kubernetes with Thanos

  • 1.
    Scaling Prometheus onKubernetes Tom Riley @ Booking.com
  • 3.
    BookingGo.Cloud ?? Kubernetes Delivery Platform SelfService for Development Teams Everything as Code 100% Customer Focused & 100% Business Value Cloud Native Learn safely in Production Public Cloud We ❤️ Open Source
  • 4.
  • 5.
  • 6.
    BookingGo.Cloud Environments • Dev.. •Test.. • Production.. • Tooling.. • ..plus multiple regions! • 10 Kubernetes clusters in total and more in the pipeline!
  • 7.
    What are wedoing with Observability? Past.. • Delivered Logging & Events on Kubernetes using Elastic Stack Present.. • Deliver a product around Time Series Metrics that is suitable for BookingGo.Cloud including alerting as code feature • Continuously evolve and update our BookingGo Monitoring & Observability defaults • Deliver a learning path around Observability; helping users onboard to BookingGo.Cloud and further extend their knowledge via workshops and documentation Future.. • OpenTracing for BookingGo.Cloud • Continue evolving Observability culture
  • 8.
    What are wedoing with Observability? Past.. • Delivered Logging & Events on Kubernetes using Elastic Stack Present.. • Deliver a product around Time Series Metrics that is suitable for BookingGo.Cloud including alerting as code feature • Continuously evolve and update our BookingGo Monitoring & Observability defaults • Deliver a learning path around Observability; helping users onboard to BookingGo.Cloud and further extend their knowledge via workshops and documentation Future.. • OpenTracing for BookingGo.Cloud • Continue evolving Observability culture
  • 9.
    Time Series MetricsProject Goals • Provide engineer friendly tooling and instrumentation libraries • Low cardinality monitoring; but one datastore fits all contexts • First class API support; no vendor lock-in, open source • Single pane of glass for Monitoring • Monitoring as code; Kubernetes native experience • Provide consistent mechanism for Alerting based on Metrics • Reboot monitoring culture at BookingGo Monitoring & Observability as part of the application development lifecycle
  • 10.
  • 11.
    Prometheus – Whatis it? • Prometheus is a metrics oriented Monitoring solution (TSDB & Tooling) • Released by SoundCloud in 2012 • Prometheus project joined Cloud Native Computing Foundation in 2016 • During 2018, become the second project to graduate from incubation alongside Kubernetes
  • 12.
    Prometheus – Whatis it? Prometheus Application Service Discovery Application Exporter Alert Manager Grafana
  • 13.
    Prometheus - DayOne • Deployed kube-prometheus example to all of our K8 clusters • Each cluster then had a single Prometheus instance and Grafana front end • Encourage development teams to start exposing Prometheus metrics from day one • Opportunity to see if Prometheus was the right technology for us with very little upfront investment required – learning safely in production! • Will the development teams get value from it? • Do we feel the technology fits within Kubernetes? bit.ly/2S6Lmq0
  • 14.
    Prometheus - DayOne Learnings Happy Development Teams!
  • 15.
    Prometheus - DayOne Learnings Prometheus ❤️ Kubernetes
  • 16.
    Kubernetes Prometheus Operator •Defines Custom Resource Definitions (CRD) for deploying and configuring Prometheus & AlertManager • As simple as: • Deploy the operator to your Kubernetes cluster • Start deploying the CRD objects to define your Prometheus setup • Operator launches Prometheus pods automatically based on CRD configuration
  • 17.
    Kubernetes Prometheus Operator DeployPrometheus bit.ly/2R7ohn8
  • 18.
    Kubernetes Prometheus Operator ConfigurePrometheus Targets bit.ly/2R7ohn8
  • 19.
    Next Steps.. • Wedecided to continue ahead with use of Prometheus • But we had determined a number of challenges.. 1. How do we run HA Prometheus in our K8 clusters? 2. How do we achieve the single pane of glass when we have so many distributed instances of Prometheus? 3. How do we scale Prometheus retention from days to months or even years?
  • 20.
    Next Steps.. • Whatare the common patterns for tackling these problems? • How did we approach this? • We keep a close eye on sources of information, blogs, tech talks on YouTube, KubeCon/PromCon videos, etc. • We attended conferences to learn from others! • Read documentation and best practices • Keep a close eye on new and evolving projects from GitHub, etc.
  • 21.
    Highly Available Prometheus TargetsTargets Targets Prometheus x1 Scrape Targets
  • 22.
    Highly Available Prometheus TargetsTargets Targets Prometheus x2 Highly Available! Scrape Targets, Twice!
  • 23.
    Highly Available Prometheus Challenges: •We have two sources of duplicate metrics! • Well, so called duplicates – metrics will vary between the two slightly! • Which do we use?
  • 24.
    Highly Available Prometheus TargetsTargets Targets Use a Load Balancer Load Balancer
  • 25.
    Highly Available Prometheus TargetsTargets Targets Could use something like HA Proxy HA Proxy
  • 26.
    Highly Available Prometheus TargetsTargets Targets Use a Service when running in K8 Kubernetes Service
  • 27.
    Highly Available Prometheus TargetsTargets Targets Not without its challenges: • When you refresh the data, you will see it change as metrics will potentially differ between the two instances Kubernetes Service
  • 28.
    Highly Available Prometheus TargetsTargets Targets Not without its challenges: • When you refresh the data, you will see it change as metrics will potentially differ between the two instances • Use sticky load balancing or make the second instance a hot standby • This solution is becoming complicated and does not scale with query load Kubernetes Service
  • 29.
    Challenges 1. How dowe run HA Prometheus in our K8 clusters? 2. How do we achieve the single pane of glass when we have so many distributed instances of Prometheus? 3. How do we scale Prometheus retention from days to months or even years?
  • 30.
    Federated Prometheus Scrape metricsat /federate to centralized Prometheus instance
  • 31.
  • 32.
    Federated Prometheus Also notwithout its challenges.. • Duplicating metrics is costly • Have to configure desired metrics you wish to federate and can easily be forgotten • Single point of failure
  • 33.
    Prometheus for Practioners@ Monitorama EU 2018 Slides: https://bit.ly/2AqB11d Monitorama Talk: https://vimeo.com/289893972
  • 34.
    Challenges 1. How dowe run HA Prometheus in our K8 clusters? 2. How do we achieve the single pane of glass when we have so many distributed instances of Prometheus? 3. How do we scale Prometheus retention from days to months or even years?
  • 35.
  • 36.
    Long Term Storage Storage •Prometheus was initially designed for short metrics retention, it was designed for monitoring & alerting on what is happening ‘now’ • Local storage can be expensive, especially if using SSD • We wanted to store years of metrics, will this scale efficiently with Prometheus?
  • 37.
    Long Term Storage •Remote write/read API • Prometheus has remote storage APIs • Concerns around the complexity of operating Elasticsearch or similar alongside Prometheus https://bit.ly/2zt5try
  • 38.
    Challenges 1. How dowe run HA Prometheus in our K8 clusters? 2. How do we achieve the single pane of glass when we have so many distributed instances of Prometheus? 3. How do we scale Prometheus retention from days to months or even years?
  • 39.
  • 40.
    Thanos – Whatis it? “Thanos is a set of components that can be composed into a highly available metric system with unlimited storage capacity”
  • 41.
    Thanos – Whatis it? Developed and open-sourced by engineers at London based Improbable github.com/improbable-eng/thanos 619 commits, 2.3k GitHub stars, 50 contributors
  • 42.
    Thanos – Whatdoes it do? • Designed to work in Kubernetes, supported by the Prometheus-Operator • Global querying view across all connected Prometheus servers • Deduplication and merging of metrics collected from Prometheus HA pairs • Seamless integration with existing Prometheus setups • Any object storage as its only, optional dependency • Downsampling historical data for massive query speedup • Cross-cluster federation • Fault-tolerant query routing • Simple gRPC "Store API" for unified data access across all metric data • Easy integration points for custom metric providers https://bit.ly/2KCAWfB
  • 43.
    Challenges Thanos helps totackle all these problems in a different way.. 1. How do we run HA Prometheus in our K8 clusters? 2. How do we achieve the single pane of glass when we have so many distributed instances of Prometheus? 3. How do we scale Prometheus retention from days to months or even years?
  • 44.
    HA Prometheus withThanos Targets Targets Targets
  • 45.
    HA Prometheus withThanos Targets Targets Targets Query 2. Thanos Query makes gRPC call to Thanos sidecar for metrics and de-duplicates 1. Thanos sidecar deployed alongside Prometheus in Kubernetes Pod using operator 3. Thanos Query exposes Prometheus HTTP API or gRPC
  • 46.
    Federation with Thanos Usea centralized instance of Thanos Query to federate the edge instances of Prometheus & Thanos Query
  • 47.
    Federation with Thanos Query Noneed to scrape metrics to a centralized Prometheus Query scales horizontally therefore eliminating the single point of failure! Prometheus instances running at the edge now HA & metrics are de-duplicated. We operate these in both AWS & GCP within K8 Point Grafana at single Prometheus HTTP API with metrics from all environments
  • 48.
    Challenges 1. How dowe run HA Prometheus in our K8 clusters? 2. How do we achieve the single pane of glass when we have so many distributed instances of Prometheus? 3. How do we scale Prometheus retention from days to months or even years?
  • 49.
    Long Term Storagewith Thanos Targets Targets Targets Query 1. Thanos Sidecar ships metrics to storage bucket such as AWS S3 or GCP Storage Store 2. Thanos Store makes metrics available via Thanos Store API for Query
  • 50.
  • 51.
    Long Term Storagewith Thanos • Significantly reduce storage requirements of each Prometheus instance – only need to story around 2 to 24 hours of metrics • Significantly cheaper storing metrics in a bucket versus scaling SSD storage • Thanos Compact executes compression of Prometheus TSDB data within the bucket and also downsamples data for when querying over long time periods – keeps raw (1m), 5m & 15m samples • Query automatically de-duplicates data within Prometheus and metrics store in the storage bucket • Thanos is built from Prometheus TSDB code – not redesigning the wheel
  • 52.
    Thanos in Summary Query• Prometheus automated in K8 • Single Prometheus API • Long term metric retention
  • 53.
    How do wemake this self-serve? • Deployments to BookingGo.Cloud are automated using our BGCloud CLI & Helm charts that we own • To self-serve metrics.. 1. Expose Prometheus supported metrics endpoint for application 2. Set helm value to configure path to metrics endpoint and enable metrics 3. Deploy to platform using CLI tool via CI/CD pipeline 4. Start building dashboards in Grafana!
  • 54.
    How do wemake this self-serve? • It is as simple as setting this in the applications self-contained configuration and deploying via a pipeline: bookinggo: metrics: enabled: true path: /actuator/prometheus
  • 55.
    Things I’ve missed.. •We are building an Observability culture at BookingGo to ensure good quality monitoring becomes part of application development lifecycle, including its operation! – Prometheus and Thanos is just one part of the tooling to enable this • Alerting as a Service – Development teams have full control over alerting configuration and is part of a code deployment of their application • How to monitor Kubernetes infrastructure – so many metrics are exposed out the box or easily available using Prometheus exporters • How we actually deploy all of this to Kubernetes – we use Helm and write our charts to fit the use case if one is not available in the open source community! • So much more…
  • 56.
    Learn more aboutThanos • If you want to learn more about Thanos search for ‘PromCon 2018: Thanos - Prometheus at Scale’ on YouTube • https://bit.ly/2P6edZE • Join Improbable’s engineering Slack group to chat #thanos • improbable-eng.slack.com • Follow the project on GitHub • https://github.com/improbable-eng/thanos • Prometheus: Up & Running book • https://oreil.ly/2r74zN5
  • 57.
    Thank you forlistening! Questions? E: thomas.riley@booking.com S: Riley @ kubernetes.slack.com

Editor's Notes

  • #8 Logging & Events: expensive short term high context Metrics: cheap long term low context
  • #10 Engineer friendly tooling High cardinality monitoring: keep ALL the context First class API support, no vendor lock-in, future proof Single pane of glass Monitoring as code; K8 native experience Consistent mechanism for alerting Reboot our monitoring culture Part of application development lifecycle
  • #11 SLOW DOWN
  • #12 Prometheus is a Time Series DB Open Sourced by SoundCloud in 2012 Joined CNCF incubator in 2016 Graduated alongside Kubernetes in 2018 Community it moving toward this
  • #16 Operator is deployed into the cluster Deploy Kube code to launch a Prometheus instance, the operator will then deploy and manage this for us ServiceMonitor automates the configuration for scraping metrics endpoints in a K8 native way
  • #20 SLOW DOWN
  • #30 SLOW DOWN
  • #35 SLOW DOWN
  • #40 SLOW DOWN
  • #51 SLOW DOWN