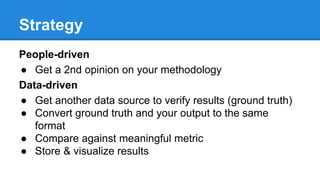
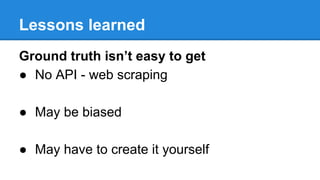
Closing the Loop
Evaluating Big Data Analysis
Karolina Alexiou
About
The speaker
● ETH graduate
● Joined Teralytics in September 2013
● Data Scientist/Software Engineer
The talk (takeaways)
● Point out how evaluation can improve your project
● Suggest concrete steps to build an evaluation
framework
The value of evaluation
Data analysis can be fun and exploratory, BUT:
“If you torture the data long enough,
it will confess to anything.”
-Ronald Coase, economist
The value of evaluation
Without feedback on the data analysis results, (=closing
the loop) I don’t know whether my fancy algorithm is better
than a naive one.
How to measure?
Strategy
People-driven
● Get a 2nd opinion on your methodology
Data-driven
● Get another data source to verify results (ground truth)
● Convert ground truth and your output to the same
format
● Compare against meaningful metric
● Store & visualize results
General evaluation framework
Statistical significance?
Teralytics Case Study: Congestion
Estimation
Ongoing project: Use of cellular data to
estimate traffic/congestion in Swiss roads
Our estimations: Mean speed on a highway at
a given time, given location
Ground truth
● Complex algorithm with lots of knobs and subproblems
● How to know we’re changing things for the better?
● Collect ground truth regarding road traffic in Switzerland
-> sensor data available from 3rd party site
● Write hackish script to login to website and fetch sensor
data that match our highway locations
● Instant sense of purpose :)
Same format
Not just a data architecture problem.
● Our algorithm’s speed estimations are fancy averages
of distance/time_needed_for_distance (journey speed)
● Sensor data reports instantaneous speed.
● Sensors are probably going to report higher speeds
systematically (bias).
Comparing against metric
● Group data every 3 minutes
● Metric: Percentage of data where the
difference between ground truth and
estimation is <7%
● Other options
○ linear correlation of time-series of speed
○ cross-correlation to find optimal time shift
Pitfalls of comparison
● Overfitting to ground truth
● Correlation may be statistically insignificant
Need proper methodology (training set/testing
set) & adequate amounts of ground truth
Visualization
● Instant feedback on
what is working and
what is not.
● Insights
○ on assumptions
○ on quality of data sources
○ presence of time shift
Lessons learned
Ground truth isn’t easy to get
● No API - web scraping
● May be biased
● May have to create it yourself
Lessons learned
Use the right tools
● The output of a Big Data analysis problem is of more manageable size ->
no need to overengineer, python is fitting for the job
● Need to be able to handle missing data/add constraints
/average/interpolate-> use existing library (pandas) with useful abstractions
● Crucial to be able to pinpoint what goes wrong -> interactivity (ipython),
logging
Lessons learned
Use the right workflow
● Run the whole thing at once for timely feedback
● Always visualize -> large CSVs are hard to make sense
of (false sense of security)
● Iterative development pays off & is sped up by
automated evaluation :)
Action Points
Ask questions
● Is there some place of my data analysis where my
results are unverified?
● Am I using the right tools to evaluate?
● Is overengineering getting in the way of quick & timely
feedback?
Action Points
Make a plan
● What ground truth can I get or create?
● How can I make sure I am comparing apples to apples?
● How should I compare my data to the ground truth
(metric, comparison method)?
● What’s the best visualization to show correlation?
Recommended Reading
● Excellent abstractions for data
cleaning & transformation
● Good performance
● Portable data formats
● Increases productivity
● +ipython for easy exploring of
the data (more insight, what
went wrong etc)
It takes some time to learn to use the
full power of pandas - so get your
data scientists to learn it asap. :)
Recommended Reading
● Even new companies have
“legacy” code (code that is
blocking change)
● Acknowledges the imperfection
of the real world (even if design
is good, problems may arise)
● Acknowledges the value of
quick feedback in dev
productivity
● Case-by-case scenarios to
unblock yourself and be able to
evaluate your code
Recommended Reading
Thanks
I would like to thank my colleagues for making
good decisions, in particular
● Valentin for introducing pandas to Teralytics
● Nima for organizing the collection of ground truth on
several projects
● Laurent for insisting on testing & best practices
Questions?
We are hiring :)
Looking for Machine Learning/Big Data experts
Experience with pandas is a plus
Just send your CV to recruiting@teralytics.net
Bonus Recommended Reading
Evaluation of impact of
charity organizations is a
hard, unsolved problem
involving data
● transparency
● more motivation to
give

Closing The Loop for Evaluating Big Data Analysis

  • 1.
    Closing the Loop EvaluatingBig Data Analysis Karolina Alexiou
  • 2.
    About The speaker ● ETHgraduate ● Joined Teralytics in September 2013 ● Data Scientist/Software Engineer The talk (takeaways) ● Point out how evaluation can improve your project ● Suggest concrete steps to build an evaluation framework
  • 3.
    The value ofevaluation Data analysis can be fun and exploratory, BUT: “If you torture the data long enough, it will confess to anything.” -Ronald Coase, economist
  • 4.
    The value ofevaluation Without feedback on the data analysis results, (=closing the loop) I don’t know whether my fancy algorithm is better than a naive one. How to measure?
  • 5.
    Strategy People-driven ● Get a2nd opinion on your methodology Data-driven ● Get another data source to verify results (ground truth) ● Convert ground truth and your output to the same format ● Compare against meaningful metric ● Store & visualize results
  • 6.
  • 7.
  • 8.
    Teralytics Case Study:Congestion Estimation Ongoing project: Use of cellular data to estimate traffic/congestion in Swiss roads Our estimations: Mean speed on a highway at a given time, given location
  • 9.
    Ground truth ● Complexalgorithm with lots of knobs and subproblems ● How to know we’re changing things for the better? ● Collect ground truth regarding road traffic in Switzerland -> sensor data available from 3rd party site ● Write hackish script to login to website and fetch sensor data that match our highway locations ● Instant sense of purpose :)
  • 10.
    Same format Not justa data architecture problem. ● Our algorithm’s speed estimations are fancy averages of distance/time_needed_for_distance (journey speed) ● Sensor data reports instantaneous speed. ● Sensors are probably going to report higher speeds systematically (bias).
  • 11.
    Comparing against metric ●Group data every 3 minutes ● Metric: Percentage of data where the difference between ground truth and estimation is <7% ● Other options ○ linear correlation of time-series of speed ○ cross-correlation to find optimal time shift
  • 12.
    Pitfalls of comparison ●Overfitting to ground truth ● Correlation may be statistically insignificant Need proper methodology (training set/testing set) & adequate amounts of ground truth
  • 13.
    Visualization ● Instant feedbackon what is working and what is not. ● Insights ○ on assumptions ○ on quality of data sources ○ presence of time shift
  • 14.
    Lessons learned Ground truthisn’t easy to get ● No API - web scraping ● May be biased ● May have to create it yourself
  • 15.
    Lessons learned Use theright tools ● The output of a Big Data analysis problem is of more manageable size -> no need to overengineer, python is fitting for the job ● Need to be able to handle missing data/add constraints /average/interpolate-> use existing library (pandas) with useful abstractions ● Crucial to be able to pinpoint what goes wrong -> interactivity (ipython), logging
  • 16.
    Lessons learned Use theright workflow ● Run the whole thing at once for timely feedback ● Always visualize -> large CSVs are hard to make sense of (false sense of security) ● Iterative development pays off & is sped up by automated evaluation :)
  • 17.
    Action Points Ask questions ●Is there some place of my data analysis where my results are unverified? ● Am I using the right tools to evaluate? ● Is overengineering getting in the way of quick & timely feedback?
  • 18.
    Action Points Make aplan ● What ground truth can I get or create? ● How can I make sure I am comparing apples to apples? ● How should I compare my data to the ground truth (metric, comparison method)? ● What’s the best visualization to show correlation?
  • 19.
    Recommended Reading ● Excellentabstractions for data cleaning & transformation ● Good performance ● Portable data formats ● Increases productivity ● +ipython for easy exploring of the data (more insight, what went wrong etc) It takes some time to learn to use the full power of pandas - so get your data scientists to learn it asap. :)
  • 20.
    Recommended Reading ● Evennew companies have “legacy” code (code that is blocking change) ● Acknowledges the imperfection of the real world (even if design is good, problems may arise) ● Acknowledges the value of quick feedback in dev productivity ● Case-by-case scenarios to unblock yourself and be able to evaluate your code
  • 21.
  • 22.
    Thanks I would liketo thank my colleagues for making good decisions, in particular ● Valentin for introducing pandas to Teralytics ● Nima for organizing the collection of ground truth on several projects ● Laurent for insisting on testing & best practices
  • 23.
    Questions? We are hiring:) Looking for Machine Learning/Big Data experts Experience with pandas is a plus Just send your CV to recruiting@teralytics.net
  • 24.
    Bonus Recommended Reading Evaluationof impact of charity organizations is a hard, unsolved problem involving data ● transparency ● more motivation to give