Galane Gold Ltd (GG) Stock Analysis Report
•
0 likes•3 views

Based on the Galane Gold Ltd stock forecasts from 1 analysts, the average analyst target price for Galane Gold Ltd is CAD 0.75 over the next 12 months. Galane Gold Ltd’s average analyst rating is Strong Buy. Stock Target Advisor’s own stock analysis of Galane Gold Ltd is Slightly Bullish , which is based on 2 positive signals and 1 negative signals. At the last closing, Galane Gold Ltd’s stock price was CAD 0.15. Galane Gold Ltd’s stock price has changed by +7.41% over the past week, -25.64% over the past month and -39.58% over the last year.

Recommended
Recommended
More Related Content
Similar to Galane Gold Ltd (GG) Stock Analysis Report
Similar to Galane Gold Ltd (GG) Stock Analysis Report (20)
More from Stock Target Advisor
More from Stock Target Advisor (20)
Recently uploaded
Recently uploaded (20)
Galane Gold Ltd (GG) Stock Analysis Report
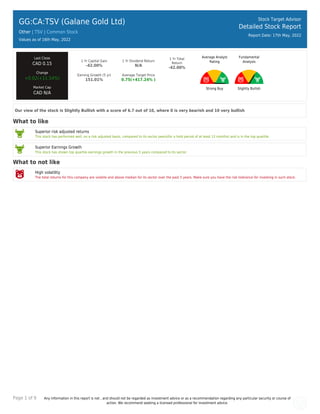
- 1. Page 1 of 9 Any information in this report is not , and should not be regarded as investment advice or as a recommendation regarding any particular security or course of action. We recommend seeking a licensed professional for investment advice. GG:CA:TSV (Galane Gold Ltd) Other | TSV | Common Stock Values as of 16th May, 2022 Stock Target Advisor Detailed Stock Report Report Date: 17th May, 2022 Last Close CAD 0.15 Change +0.02(+11.54%) Market Cap CAD N/A 1 Yr Capital Gain -42.00% 1 Yr Dividend Return N/A 1 Yr Total Return -42.00% Earning Growth (5 yr) 151.01% Average Target Price 0.75(+417.24% ) Average Analyst Rating Strong Buy Fundamental Analysis Slightly Bullish Our view of the stock is Slightly Bullish with a score of 6.7 out of 10, where 0 is very bearish and 10 very bullish What to like Superior risk adjusted returns This stock has performed well, on a risk adjusted basis, compared to its sector peers(for a hold period of at least 12 months) and is in the top quartile. Superior Earnings Growth This stock has shown top quartile earnings growth in the previous 5 years compared to its sector. What to not like High volatility The total returns for this company are volatile and above median for its sector over the past 5 years. Make sure you have the risk tolerance for investing in such stock.
- 2. Page 2 of 9 Any information in this report is not , and should not be regarded as investment advice or as a recommendation regarding any particular security or course of action. We recommend seeking a licensed professional for investment advice. GG:CA:TSV (Galane Gold Ltd) Other | | Common Stock Stock Target Advisor Detailed Stock Report Report Date: 17th May, 2022 Adjusted Closing Share Volume Relative Returns Relative Performance (Total Returns) Security Capital Gain Dividend Return Total Return GG:CA Galane Gold Ltd -45.8% 0 -45.8% XIU:CA iShares S&P/TSX 60 Index ETF +5.3% +2.7% +8%
- 3. Page 3 of 9 Any information in this report is not , and should not be regarded as investment advice or as a recommendation regarding any particular security or course of action. We recommend seeking a licensed professional for investment advice. Employees 210 Technical Indicators Value Value Beta 1.68 52 Week High N/A Short Ratio N/A 52 Week Low N/A Shorted Shares N/A 200 Day Moving Average N/A Shorted Shares Previous Month N/A 50 Day Moving Average N/A Shares Held By Insiders N/A Short Percentage N/A Shares Held by Institutions N/A Dividend Yield N/A
- 4. Page 4 of 9 Any information in this report is not , and should not be regarded as investment advice or as a recommendation regarding any particular security or course of action. We recommend seeking a licensed professional for investment advice. GG:CA:TSV (Galane Gold Ltd) Other | | Common Stock Stock Target Advisor Detailed Stock Report Report Date: 17th May, 2022 Market Performance Market Performance vs. Industry / Classification (Other) Market Performance vs. Exchange (Nasdaq Global Select) Value Sector Median Percentile Rank Grade Market Median Percentile Rank Grade YTD Capital Gain 26.09% -16.0% 89% -21.9% 90% Dividend Return N/A 2.0% N/A 1.1% N/A Total Return 26.09% -16.0% 89% -21.9% 90% Trailing 12 Months Capital Gain -42.00% -42.0% 49% -33.3% 41% Dividend Return N/A 3.7% N/A 1.8% N/A Total Return -42.00% -42.0% 49% -33.3% 41% Trailing 5 Years Capital Gain 866.67% -8.9% 82% 12.5% 91% Dividend Return N/A 11.2% N/A 9.8% N/A Total Return 866.67% -8.9% 82% 12.5% 91% Average Annual (5 Year Horizon) Capital Gain 82.00% 32.1% 68% 14.8% 80% Dividend Return N/A 2.5% N/A N/A N/A Total Return 82.00% 25.3% 66% 14.4% 80% Risk Return Profile Volatility (Standard Deviation) 116.82% 78.7% 45% 62.4% 33% Risk Adjusted Return 70.19% N/A 92% 24.7% 97% Market Capitalization N/A 9.91M N/A 0.02B N/A
- 5. Page 5 of 9 Any information in this report is not , and should not be regarded as investment advice or as a recommendation regarding any particular security or course of action. We recommend seeking a licensed professional for investment advice. Key Financial Ratios Ratios vs. Industry / Classification (Computer Hardware) Ratios vs. Exchange (Nasdaq Global Select) Value Sector Median Percentile Rank Grade Market Median Percentile Rank Grade Market Value peratio 4.7 10.8 63% 10.6 70% pbratio N/A 0.0 N/A 2.6 N/A pcfratio N/A -3.2 N/A -11.3 N/A pfcfratio N/A 0.0 N/A 10.6 N/A Management Effectiveness retequity N/A N/A N/A -30.2% N/A retinvcap N/A -17.5% N/A -17.3% N/A retass N/A N/A N/A -15.1% N/A debtequityratio N/A 40.5% N/A 2.2% N/A Technical Ratios yield N/A N/A N/A 5.6% N/A sratio N/A 0.00 N/A 0.38 N/A spercent N/A N/A N/A 0.1% N/A beta 1.68 1.06 30% 1.16 30%
- 6. Page 6 of 9 Any information in this report is not , and should not be regarded as investment advice or as a recommendation regarding any particular security or course of action. We recommend seeking a licensed professional for investment advice. GG:CA:TSV (Galane Gold Ltd) Other | | Common Stock Stock Target Advisor Detailed Stock Report Report Date: 17th May, 2022 Recent Analyst Ratings Price Action Rating Action Analyst Rating Price date Maintains Noble Capital Buy CAD 0.75 2022-05-16 Target Lowered by Fundamental Research Buy CAD 0.66 » CAD 0.64 2020-12-22 Target Lowered by Fundamental Research Buy CAD 0.67 » CAD 0.66 2020-08-26 Lowers Target RBC Royalbank Sector Perform CAD 19 2017-08-17 Reiterates Scotiabank Capital Outperform CAD 22.5 2017-07-27 Assigns Scotiabank Capital Outperform CAD 26 2017-04-27 Assigns Ringler Research Outperform CAD 0.5 2016-09-22 Assigns Canaccord Capital CAD 1.5 » CAD 1.8 2012-10-10
- 7. Page 7 of 9 Any information in this report is not , and should not be regarded as investment advice or as a recommendation regarding any particular security or course of action. We recommend seeking a licensed professional for investment advice. GG:CA:TSV (Galane Gold Ltd) Other | | Common Stock Stock Target Advisor Detailed Stock Report Report Date: 17th May, 2022 Annual Financial (CAD)
- 8. Page 8 of 9 Any information in this report is not , and should not be regarded as investment advice or as a recommendation regarding any particular security or course of action. We recommend seeking a licensed professional for investment advice. GG:CA:TSV (Galane Gold Ltd) Other | | Common Stock Stock Target Advisor Detailed Stock Report Report Date: 17th May, 2022 Quarterly Financial (CAD)
- 9. Page 9 of 9 Any information in this report is not , and should not be regarded as investment advice or as a recommendation regarding any particular security or course of action. We recommend seeking a licensed professional for investment advice. GG:CA:TSV (Galane Gold Ltd) Other | | Common Stock Stock Target Advisor Detailed Stock Report Report Date: 17th May, 2022 Largest Industry Peers for Other Symbol Company Name Price(Change) Market Cap SJR-A:CA Shaw Communications Inc +0.40 (+1.1%) CAD 19.24B HIVE:CA HIVE Blockchain Technologies L.. -0.02 (-1.7%) CAD 0.91B AGB:CA Atlantic Gold Corporation N/A CAD 0.69B VIT:CA Victoria Gold Corp N/A CAD 0.48B TDG:CA TDG Gold Corp +0.01 (+2.3%) CAD 0.46B DAP-U:CA XPEL, Inc N/A CAD 0.19B GBU:CA Gabriel Resources Ltd N/A CAD 0.18B NINE:CA Delta 9 Cannabis Inc N/A CAD 0.09B SSP:CA Gold X Mining Corp N/A CAD 0.07B TXR:CA Gold Terra Resource Corp N/A CAD 0.04B The Stock Target Advisor platform run millions of calculations every day on over 30,000 Canadian and American stocks, comparing and ranking their financial and market performance against their sectors and exchange. We represent the percentile ranking using the following grading system. Letter Grade Percentage Letter Grade Percentage Letter Grade Percentage A+ 97%-100% A 93%-96% A- 90%-92% B+ 97%-89% B 83%-86% B- 80%-82% C+ 77%-79% C 73%-76% C- 70%-72% D+ 67%-69% D 63%-66% D- 60%-62% F 0%-59%