Current issues - International Journal of Computer Science and Engineering Su...
Term_Paper_Shengzhe_Wang
1. Running head: DEVELOPMENT & APPLICATIONS OF ANOMALIES IN DATA SCIENCE
1
Development and Applications of Anomalies in Data Science
Shengzhe Wang
Gid: G30052798
CSCI 6907 Big Data & Analytics
2016 Spring
2. DEVELOPMENT & APPLICATIONS OF ANOMALIES IN DATA SCIENCE
2
Abstract
Anomalies are common, but important for data researching, which provides useful information for
scientists and businessmen. This paper focuses on development and applications of anomalies in
data science, such as anomalies detection methods and anomalies analytics algorithms, such as
Cluster Analysis, K-Nearest Neighbor (KNN) and Neural Networks. By reviewing and analysis a
number of relevant papers of anomalies research, it is efficient to know about the developing
progress and applications of anomalies in different fields, such as population anomalies in city and
network traffic detection. The Introduction chapter discusses the research topic and background of
anomalies. And the Methodology chapter introduces several popular algorithms and applications
by summarizing relevant papers. The Result and Discussion Chapter argues the limitations of this
research and states future work.
Keywords: anomalies detection, data science
3. DEVELOPMENT & APPLICATIONS OF ANOMALIES IN DATA SCIENCE
3
1. Introduction
In data science, anomalies are defined as an incidence or occurrence behavior, when the
actual results under given sets of assumptions are different from the expected result. Anomalies,
or we often call “unusual” occurrences, are a simple way to start big data analytics researching by
deploying some Business Intelligence (BI) or statistical techniques to help your scientists identify
informal “things” in the data that might be indicative of a bigger problem or opportunity (Schmaroz,
2012). Anomaly detection, or also called outlier detection, is a well-motivated problem and a major
data mining and knowledge discovery tasks. Through studying detected anomalies behaviors, we
can trace and analyze these anomalies, which could help people make better decisions, and prevent
underlying harm, such as fraud credit card and cyber intrusions.
In this paper, we study the research background of anomaly detection and anomalies
analysis by reviewing relevant paper, and then we talk in next section about several basic
algorithms and advanced methods of detection and analysis methods with applications in real
world. And then we will conclude researching results and discuss limitations and future challenges.
1.1 Background
(Chandola et al., 2009, p.58) Anomaly detection refers to the problem of finding patterns
in data that do not conform to expected behavior. Chandola te al. (2009) also suggested those non-
conforming patterns are usually defined as anomalies, exceptions, aberrations, peculiarities,
outliers in different research fields. Among those definitions, anomalies and outliers are two terms
that are applied mostly in the context of anomaly detection. Anomaly detection finds extensive use
in the widely variety of applications, such as fraud detection for credit cards, insurance, or health
care, and intrusion detection for cyber-security, fault detection in safety critical systems.
The importance of anomaly detection is due to the fact that anomalies in data translate to
significant and critical in a wide variety of application domains. For instance, an anomalous traffic
pattern in a computer network could mean that a hacked computer is sending out sensitive data to
an unauthorized destination (Kumar, 2005). An anomalous MRI image may indicate the presence
of malignant tumors (Spence et al., 2001).
According to Chandola te al. (1998), a significant aspect of an anomaly detection technique
is the nature of the desired anomaly. Anomalies can be classified into following three categories:
4. DEVELOPMENT & APPLICATIONS OF ANOMALIES IN DATA SCIENCE
4
1.1.1 Point Anomalies. If an individual data set instance can be considered as anomalous
with respect to the rest of data, and then the instance is termed a point anomaly. This is the simplest
type of anomaly and is the focus of a majority of research on anomaly detection. For example, in
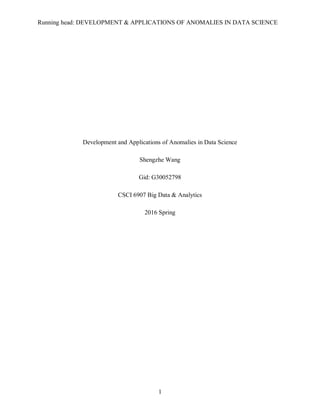
Figure 1, points o1 and o2, as well as points in region O3, lie outside the boundary of the normal
regions, such as N1 and N2, and hence are point anomalies since they are different from normal
data points.
Figure 1. This plot shows the regions of two clusters. We could see instantly that the relationship
between anomalies and main clusters.
As a real-life example, considering credit card fraud detection. Let the data sets correspond
to an individual’s credit card transactions. For a simple theory, let us assume that the data are
defined using only one feature: amount spent on credit card. If a transaction for which the amount
spent is over than the usual amount that compared to the normal range of expenditure for that
person will be a point anomaly. The bank has the responsibility to send the confirmation message
to make sure the user account security and the safety of assets.
1.1.2 Contextual Anomalies. As the points of Song et al. in 2007, if a data instance is
anomalous in a specific context, but not otherwise, then it is termed a contextual anomaly, which
also referred to as the conditional anomaly. The notion of a context is induced by the structure in
5. DEVELOPMENT & APPLICATIONS OF ANOMALIES IN DATA SCIENCE
5
the data set and has to be specified as a part of the problem formulation. Each data instance is
defined using the following two sets of attributes:
The first attribute is Contextual Attributes (CA). The CA are used to determine the context
or neighborhood for that instance. For instance, in spatial data sets, the longitude and latitude of a
location are the Contextual Attributes. In time-series data, time is a Contextual Attribute that
decides the position of an instance on the entire sequence.
The other attribute is Behavioral Attributes (BA). The BA are defined the non-contextual
characteristics of an instance. For example, in a spatial data set describing the average rainfall of
a particular city, the amount of rainfall at any location of the city is a Behavioral Attribute.
Moreover, the anomalous behavior could be determined by using the values for the
Behavioral Attributes within a specific context. A data instance could be a contextual anomaly in
a certain context, however, for an identical data instance that is in terms of Behavioral Attributes,
could be normally considered in a different context. This property is a feature in identifying
contextual and Behavioral Attributes for a contextual anomaly detection technique.
Figure 2. According to Goldberger and colleagues pointed, Collective Anomalies could be found
in the real-world case, for example, like this human electrocardiogram output. We could recognize
that in red cycle region, the plot is indeed different from other parts, which is a Collective
anomalies area.
6. DEVELOPMENT & APPLICATIONS OF ANOMALIES IN DATA SCIENCE
6
1.1.3 Collective Anomalies. Goldberger et al. (2000) argued that if a collection of related
data instances is anomalous with respect to the entire data set, it is called a collective anomaly. The
individual data instance in a collective anomaly could not be anomalies by themselves.
Nevertheless, their occurrence together as a collection is anomalous. As Figure 2, it is an example
that shows a human electrocardiogram output. The red cycle region denotes an anomaly because
the same low value exists for an abnormally long time while others could reach the average of the
whole stages. Note that that low value by itself is not an anomaly, because that each value
associated with the condition of the human, and each second is different from others.
Besides the example of human electrocardiogram output, as an another illustrative instance
in Computer data fields, thinking a sequence of actions occurring in a computer network system
as shown below:
... http-web, buffer-overflow, http-web, http-web, smtp-mail, ftp, http-web, ssh, smtp-mail, http-
web, ssh, buffer-overflow, ftp, http-web, ftp, smtp-mail, http-web ...
The bold sequence of events, such as buffer-overflow, ssh and ftp, correspond to a typical
Web-based attack by a remote machine followed by copying of data from the host computer to a
remote destination via ftp (Goldberger et al., 2000). It should be mentioned that this collection of
events is an anomaly, but the individual event is not anomalies when they occur in other locations
in the sequence.
2. Methodology
Based on the knowledge of anomalies in the first chapter, then we will expend anomalies
researching by three steps, that are, introducing the categories and methods of anomalies detection
firstly. And then anomalies analysis is the next part of this section, we would learn the basic and
simple technologies in Statistic fields and advanced algorithms in Data Science, such as Cluster
Analysis, K-Nearest Neighbor and Neural Networks.
2.1 Anomalies Detections
Anomaly detection has been a topic of a number of surveys and review articles, as well as
books recently. In 2004, Hodge and Austin founded an extensive survey of anomaly detection
techniques developed in both machine learning and statistical domains. In addition, a broad review
of anomaly detection methods for numeric and symbolic data is presented in 2006 by Agyemang
7. DEVELOPMENT & APPLICATIONS OF ANOMALIES IN DATA SCIENCE
7
et al. and an extensive review of novelty detection techniques using neural networks and statistical
approaches has been proved in 2003. Furthermore, Patcha and Park suggested a survey of anomaly
detection techniques by using specifically for cyber-intrusion detection in 2007.
2.1.1 Supervised Anomaly Detection. Techniques trained in supervised modes, which
assume the availability of a training data set that has labeled instances for normal and anomaly
classes. Based on the theory that mentioned by Goldberger et al. in 2000, a typical approach in
such cases was to build a predictive model for anomaly and normal classes. Any uncertain data
instances were compared with the model to determine that classes it belongs to. Two major issues
that mentioned in supervised anomaly detection.
Firstly, the anomalous instances were far fewer or higher compared with the normal
instances in the training data. Issues that raised by those authors, such as Joshi et al. in 2001; Vilalta
and Ma in 2002, due to imbalanced class distributions, had been addressed in the data mining and
machine learning literature.
Secondly, obtaining accurate and representative labels, especially for the anomaly classes
were usually challenging. In the articles that presented by Theiler and Cai in 2003 and Steinwart
et al. in 2005, a mount of techniques had been created that injected artificial anomalies into a
normal data set to obtain a labeled training data set.
Besides these two problems, the supervised anomaly detection issues are same as building
predictive models.
2.1.2 Semi-supervisedAnomaly Detection. Methods that operated in a semi-supervised mode,
assuming that the training data had labeled instances, not for anomaly classes, but for normal
classes. Because that they would not require labels for anomaly classes, they were widely
applicable than supervised techniques (Fujimaki et al., 2005). For example, in an aircraft fault
detection system, an anomaly scenario would cause accidents that were hard to model. The typical
approaches applied in such techniques was to build a model for the class corresponding to normal
behaviors and used the model to identify anomalies in the test data.
2.1.3 Unsupervised Anomaly Detection. Ways that operated in unsupervised mode did not
require training data, and thus, they were most widely applicable for any research fields and
applications in business condition. The methods in this category made the implicit assumption that
8. DEVELOPMENT & APPLICATIONS OF ANOMALIES IN DATA SCIENCE
8
normal instances were far more frequent than anomalies in the test data sets. If this assumption is
not true, then such techniques suffer from high false alarm rate.
While many semi-supervised techniques also could be adapted to operate in an
unsupervised mode, by using a sample of the unlabeled data set as training data. Such adaptation
assumes that the test data contained not many anomalies and the models learned during training
was robust to these few anomalies.
Figure 3. This figure came from the research of Goldberger et al. in 2000. They categorized the
most types techniques of detection and application of each technique by doing a survey for relevant
research papers.
2.2 Anomalies Analysis
For better understanding anomalies applications in data science, it is better to introduce
Cluster Analysis firstly. Cluster Analysis has become a common tool for both academic
researching and the marketing applications researchers that rely on the technique for developing
empirical groupings of persons, products or occasions which may serve as the basis for further
analysis. The apply of Cluster Analysis has frequently been viewed with skepticism. (Frank &
Green, 1968) had discussed problems with deciding the appropriate measures of similarity and the
appropriate number of clusters. Cluster Analysis frequently had been used as a classification tool
for some researchers as a means of representing the structure of data with the construction of
9. DEVELOPMENT & APPLICATIONS OF ANOMALIES IN DATA SCIENCE
9
dendrograms (a diagram of biology system). Thus, Cluster Analysis could be treated as a statistical
method for classification. Unlike other statistical methods for classification, such as discriminant
analysis and automatic interaction detection, it makes no prior assumptions about differences
within a population. As Gerard mentioned in 1957 that Cluster Analysis is a purely empirical
method of classification and as such is primarily an inductive technique. Although some scientists
had not been favorably disposed toward the application of Cluster Analysis, and criticism sounds
of the ad-hoc nature of clustering solutions was common at that time, the classification was a
significant and usual overlooked tool of science. In 1926, Wolf had presented that classification
was both the first and last method employed by science. The responsibility of classification was
that certain things were thought of as related in a certain way. In fact, the final output of other
methods of Clustering Analysis study could well be a new classification method.
From reasons that mentioned before, the Clustering Analysis method would help us to be
better to understand the data science, especially for the descriptive phase, which we should know
what happened with the data set at that time. By applying those methods, the results that we got
could great contribute to help the diagnostic and predictive phase. Thus doing the first step to
classify and transform the raw data into structures and organizations data type is significant for
researchers.
However, anomalies could do exist when doing Cluster Analysis that finding by anomalies
detection methods. Figure 1 in the Introduction chapter illustrates anomalies in a simple two-
dimensional data sets. The data have two normal regions, which are N1 and N2. Since most
observations lie in these two regions, points that are sufficiently in the cluster boundary of these
regions. Nevertheless, for example, points o1 and o2, and points in region O3, are anomalies.
It is significant to understand what role of anomalies analysis might play in big data science.
One way to start to research and mining big data is to identify anomalies that buried in the data,
and alerting or marking their communities of those anomalies for further investigation. In
Schmaroz’s article that published in 2012, for example, government agencies could use anomaly
detection and analysis methods to identify unusual or “higher than average” trends of existing big
data set in the following areas:
Purchase orders: there could be higher than average purchase orders by a department, on
certain days of the week, or of certain products that may be indicative of fraud, abuse, or waste.
10. DEVELOPMENT & APPLICATIONS OF ANOMALIES IN DATA SCIENCE
10
Service requests: same as purchase orders, there could be higher than average service
requests by departments, such as DMV, Social Services, by certain days of the week or times of
the year that might require personnel scheduling changes in order to minimize constituency wait
times.
Overtime Usage: there would be more than average overtime usage by certain personnel
or by certain departments or at particular times of the month that might be indicative of poor
scheduling or overtime abuse.
Pothole reports: there could be certain areas where pothole reports occur more often than
other areas that might make these areas a higher priority for maintenance.
Graffiti reports: there could be certain areas of the city, or times of a year, where graffiti
activities increase more than normal.
Predictive maintenance: Like trucks, buses, cars, they need more maintenance work than
similar vehicles of the same age and mileage that might indicate vehicles for replacement.
Once governments had identified these anomalies point in existing data, they could take
the next step in the analytics process in trying to associate meaningful causes or correlations of
those anomalies.
2.3 Basic and Advanced Techniques for Identifying Anomalies
The beauty of anomalies detection and analysis is that identifying areas of under-
performance and over-performance, or using statistical routines to identify anomalies. Actually,
for many companies and organizations, the path to business optimization starts with anomalies
identification and pattern recognition. In fact, it is not quite easy to find the right optimization
without going through several steps, such as identifying the anomalies and unusual patterns that
exist in data sets firstly, and then determining the correlations and potential causation of those
anomalies. The more detailed, fine-grained data that are collected, the better position and accurate
forecast that could be decided from those anomalies both for researches and businessmen. A few
different and simple anomalies analysis techniques are below:
Moving Averages: In statistics, a moving average could be used to analyze a set of data
points by creating a series of averages of different time period subsets, such as 1-week moving
11. DEVELOPMENT & APPLICATIONS OF ANOMALIES IN DATA SCIENCE
11
average or 5 months moving average, of the full data set. A moving average can be used to identify
processes or situations that are trending significantly up or down.
Comparative Analysis: Such as Previous Period, Previous Campaign or Event,
Benchmarks, comparing current performance to previous periods or previous campaigns or
previous events or industry benchmarks is an easy way to flag areas of under-performance and
over-performance.
Control Charts: Control charts are also applied to determine whether a process is in a
state of statistical control. Control charts indicate upper and lower control limits, and include a
central or mean line, to help detect the trend of plotted values. If all data points are within the
control limits, variations in the values, maybe due to a common cause and process, could be called
in control. Otherwise, if data points fall outside the control limits, variations, maybe due to a
special cause and the process is said to be out of control.
Basic Statistical Analysis: Calculating average or mean values and standard deviations
are standard calculations available in most Business Intelligence (BI) tools. Users can use basic
statistical analysis to flag anomalies that are three standard deviations from the average or mean.
The above techniques are simple but effect ways for researchers to start their analytic
processes. More advanced methods to identify anomalies in the data set are common for scientists
researching, such as Cluster Analysis, K-Nearest Neighbor and Neural Networks.
We have learned the basic information about cluster analysis and relevant background in
2.2 Anomalies Analysis. Let us go deep further of Cluster Analysis by discussing the
implementation of the algorithm. There are several algorithms to implement the Cluster Analysis.
A connectivity-based clustering algorithm is proposed for Cluster Analysis. The clustering
algorithm first orders all the sets of the circuit. And then, each set is visited in turn. If the set is not
already clustered, the initial cluster is created for this set. This cluster is refined and finally, if
certain criteria are satisfied, a cluster is formed. The three main steps of initial cluster creation,
initial cluster refinement and final cluster formation are repeated until all of the sets have been
visited.
12. DEVELOPMENT & APPLICATIONS OF ANOMALIES IN DATA SCIENCE
12
Figure 4. An example of the connectivity-based clustering algorithm that retrieved from
Wikipedia.
Figure 5. An example K-means clustering algorithm that retrieved from Wikipedia.
Another efficient and popular Cluster Analysis method could be stated as follows: Given a
representation of n objects, finding K groups based on a measure of similarity such that the
similarities between objects in the same group are high while the similarities between objects in
different groups are low. The most well-known hierarchical algorithms were single-link and
13. DEVELOPMENT & APPLICATIONS OF ANOMALIES IN DATA SCIENCE
13
complete-link and the most popular and the simplest partitioned algorithm is K-means (Jain, 1988).
Jain also believed that since partitioned algorithms were preferred in pattern recognition due to the
nature of available data, our coverage was focused on these algorithms. K-means had a rich and
diverse history as it was independently discovered in different scientific fields. Even though K-
means was first proposed over 50 years ago, it is still one of the most widely used algorithms for
clustering. As Jain mentioned that ease of implementation, simplicity, efficiency, and empirical
success were the main reasons for its popularity.
Chandrakala and Chandra in 2009 mentioned the DBSCAN (Density-Based Spatial
Clustering of Applications with Noise) and few graph based clustering methods felled into the
other category since they automatically find the number of clusters. The DBSCAN was a clustering
algorithm that defines a cluster as a maximal set of density-connected points. It used the concepts
of neighborhood and connectivity to define a cluster. Two parameters ϵ and MinPts were used in
this method. The parameter ϵ is the radius of a sphere centered around a data point used to
determine neighbors for the data point. The parameter MinPts is used to constrain the density of a
cluster.
Figure 6. An example Density-based clustering with DBSCAN clustering algorithm that
retrieved from Wikipedia.
The second method is K-Nearest Neighbor. It is an intuitive method used extensively for
classification. Given a pattern to classify, K-NN works by selecting the K most similar patterns
from a set of well-known classified data which is also as training data and choosing the class with
the most representatives in the set. The similarity is typically measured by the Euclidean distance
14. DEVELOPMENT & APPLICATIONS OF ANOMALIES IN DATA SCIENCE
14
in some appropriate feature space or some other suitable metric. K-NN is a lazy algorithm, which
means that it defers data processing until needed. The algorithm uses local information and adapts
well to changes in the training data. However, its main drawbacks are susceptibility to noise and
the curse of dimensionality (Cedeño & Agrafiotis, 2003).
Figure 7. An example K-NN clustering algorithm that retrieved from Wikipedia.
Figure 8. An example K-NN and advanced C-NN clustering algorithm that retrieved from
Wikipedia.
15. DEVELOPMENT & APPLICATIONS OF ANOMALIES IN DATA SCIENCE
15
Condensed Nearest Neighbor (CNN, the Hart algorithm) is an advanced algorithm
designed to reduce the data set for K-NN classification. It selected the set of prototypes U from
the training data, such that 1NN with U could classify the examples almost as accurately as 1NN
does with the whole data set (Angiulli, 2007). Three types of points: prototypes, class-outliers, and
absorbed points, are features of CNN. The steps to create CNN is below:
Given a training set X, CNN works iteratively; Scanning all elements of X, looking for an
element x whose nearest prototype from U has a different label than x. Then Removing x from X
and add it to U. Repeating the scan until no more prototypes are added to U. Using U instead of X
for classification. The examples that are not prototypes are called "absorbed" points.
Figure 9. An example of Neural Network Intrusion Detection Architecture for Distributed
System by Naseem.
16. DEVELOPMENT & APPLICATIONS OF ANOMALIES IN DATA SCIENCE
16
The Third method is Neural Networks for anomalies detection and analysis. NNID (Neural
Network Intrusion Detector), is a system that could collect and detect anomalies from real life.
According to Ryan et al. in 1998, NNID is a back-propagation Neural Network trained to identify
users based on what commands they use during a day. The NNID anomaly intrusion detection
system is based on identifying a legitimate user based on the distribution of commands she or he
executed. Building NNID for a particular computer system consists of the following three phases:
Firstly, collecting training data: Obtain the audit logs for each user for a period of several
days. For each day and user, form a vector that represents how often the user executed each
command.
Secondly, training: Train the neural network to identify the user based on these command
distribution vectors.
Thirdly, performance: Let the network identify the user for each new command distribution
vector. If the network’s suggestion is different from the actual user, or if the network does not have
a clear suggestion, signal an anomaly.
Experimental evaluation on real-world data shows that NNID can learn to identify users
simply by what commands they use and how often, and such an identification can be used to detect
intrusions in a network computer system.
2.4 Applications of anomalies detection and analysis
Here are two real application of anomalies detections and analysis in the real world.
Although they belong to different fields, the same theories and implementation were applied in
these applications.
An example of anomalies detection is collection and analysis population anomalies in a
city, which help to model city traffic design and event impact analysis and prediction (Liu et al.,
2003). Although a significant and interesting problem, it is very difficult to detect population
anomalies and retrieve anomaly trajectories, especially given that it is hard to get actual and
sufficient population data. For addressing the difficulties of a lack of real population data, scientists
got the help of mobile phone networks, which offer enormous spatial and temporal communication
data on persons’ positions. More importantly, this experiment claimed that these mobile phone
data could be used to infer and approximate population data. Thus, studying the population
17. DEVELOPMENT & APPLICATIONS OF ANOMALIES IN DATA SCIENCE
17
anomaly detection problem by taking advantages of unique features hidden in mobile phone data
is reasonable. For collecting and analyzing the data, the researchers present a system to conduct
Population Anomaly Detection (PAD). The basic theory is that, firstly, they proposed an effective
clustering method, correlation-based clustering, to cluster the incomplete location information
from mobile phone data (i.e., from mobile call volume distribution to population density
distribution). Then, they designed an adaptive parameter-free detection method, R-scan, to capture
the distributed dynamic anomalies. Finally, they devised an efficient algorithm, BT-miner, to
retrieve anomaly trajectories. The experimental results from real-life mobile phone data confirm
the effectiveness and efficiency of the proposed algorithms.
Figure 10. The example of detection activities by PAD system by Liu et al., in 2003.
Thus according to this example, we could find out anomalies detection has pivotal
influence for people living. Two real results of this example are below.
Case 1 (Scheduled burst): In Barack Obama’s inauguration, more than 2 million people
crowded onto Capitol Hill in Washington DC on January 20, 2009. It was an impressive population
anomaly that came from a scheduled event.
Case 2 (Unexpected burst): Violent riots in China’s western region of Xinjiang left around
200 people dead and more than 1,800 people injured on July 5, 2009. And, the uprisings of the
18. DEVELOPMENT & APPLICATIONS OF ANOMALIES IN DATA SCIENCE
18
Arab Spring occurred in the Arab world on December 18, 2010. These were two serious and
terrible population anomalies that were caused by unexpected events.
We could use the data to organize orderly and prevent dangers in some situations. That is
why the anomalies detection is important for researching and has valuable to study.
Another application of anomalies detections is presented by Nguyen et al. in 2008, which
focused on Internet traffic measurement.
Internet traffic measurement is the essential process for monitoring trends, network
planning and anomaly traffic detection. Moreover, simple packet-counting or byte-counting
methods with SNMP (Simple Network Management Protocol) had been widely applied for
network administration. Furthermore, the passive traffic measurement approach that collected and
analyzed packets at routers or dedicated machines also gained its popularity at that time.
However, in the article that published by Nguyen et al., monitoring the traffic and detecting
anomalous activities was not controlled and designed, it was equally significant to keep the rate of
false alarms lower than usual situation. Usually, a high false alarm meant that the genuine issues
would be lost in false events. Assumed that when applying one’s statistical anomaly detection
methods based on large networks, even a tiny false alarm rate would cause enough false alarms to
overwhelm that network operation staff. In the worst case, false alarms undermined anomaly
detection, when operation staff tired of reacting to false alarms, and ignored or turned the system
off entirely. Researchers were still struggling for a simple, but robust methods for anomaly
detection, with high detection rate and low false alarm.
The authors also presented that although anomaly detection has been addressed in abundant
prior projects, there could be the fact that few works had been succeeded in statistically
characterized different types of network traffic flow anomalies. Furthermore, most anomaly
detection methods were limited to analyzing the entire traffic as one entity that made them unable
to quantify network anomalies, and their validities were affected, if many anomalous activities
occurred simultaneously. From that, we could understand the need for a method that could
effectively detect and classify network anomalies based on flow statistics.
According to Nguyen et al. paper (2008), they analyzed traffic flow information to detect
abnormal behaviors. Traffic flows were created from all packets captured by a network link. Many
19. DEVELOPMENT & APPLICATIONS OF ANOMALIES IN DATA SCIENCE
19
network anomalies, but whenever a network anomaly occurred, traffic behavior would change
abruptly. These changes could be inspected by tracking various parameters of traffic flows. Not
only monitoring fundamental flow parameters such as flow size, the number of packets, which
represented major flow features, they statistically collected certain extended metrics in order to
infer the connection trends of flows. These flow metrics were not only used for detecting but also
for identifying a number of network anomalies as flows in various anomalies that had their
distinctive set of flow metric values. Within each metric, they used a standard technique called
Holt-Winters to extract the anomaly indicators.
Holt-Winters algorithm would constantly monitor each single metric, and maintain a list of
historical data for the anomaly detection purpose. No matter when the value of a monitored metric
goes outside the range of predicted data, Holt-Winters algorithm would raise an anomaly flag on
the metric. The network was likely to be undergoing anomalous activities and this was the case
when the system needs attention from the network operation staff.
As writers stated above, anomaly detection could be addressed in many projects, and
previous works have primarily focused on security tasks, such as detecting DDoS attacks, worms,
or other intrusions. In many cases, providers used simple techniques for anomaly detection, such
as fixed threshold, packet capturing and analyzing. For the case of DDoS detection, Cisco and
Juniper also embedded in their routers a simple flood attack protection based on threshold
technique (Nguyen, 2008).
Holt-Winters Forecasting was a sophisticated algorithm that built upon exponential
smoothing. It relied on the premise that the observed time series could be decomposed into three
components: a baseline, a linear trend, and a seasonal effect. The authors also found that the
algorithm presumed each of these components evolves over time and this was accomplished by
applying exponential smoothing to incrementally update the components.
So far in Nguyen et al researching, they proposed a new method for network traffic
anomaly detection with four predefined metrics: TotalBytes, TotalPackets, DSocket, DPort, that
could be viewed in Figure 11. They also built a network testbed and a program called FlowMon to
certify the feasibility of our method. Based on the algorithm and experiment verification, the
method had proved its efficiency in anomaly detection. Their research was dedicated to deal with
network-centric anomalies that exhibited abnormal changes in network traffic, and their
20. DEVELOPMENT & APPLICATIONS OF ANOMALIES IN DATA SCIENCE
20
contribution was a new lightweight method that did not only detect network anomalies but can
also pined point what kind of anomaly they were.
Figure 11. The example table of detection activities in Holt-Winters Forecasting system by
Nguyen et al., in 2008.
Their method was not complicated, but it should be seen as an advantage, as simplicity
made the method scalable, and more extendible to include other features, new metrics for other
kinds of network anomaly, or applying wavelet analysis for better anomaly detection rate as
examples. That was why the method had great potential to be re-used in further researches of
anomalies detection and analysis.
3. Result
In this paper, we have introduced the background of anomalies, such as definitions and
concepts. Furthermore, according to review a number of past research of anomalies on detection
and analysis, we explored existing several methods and algorithm to detect and analyze the data
set. In different fields, for mining data, researchers applied different types techniques to detect
anomalies and analyze what they collected. As Table 1 shows, two categories of anomalies
detection and analysis methods could be created. For basic methods, a variety of statistic
techniques have been implemented. While for advanced methods, numbers of techniques should
apply new algorithms to recognize and summarize, such as Cluster Analysis, K-NN, and Neural
21. DEVELOPMENT & APPLICATIONS OF ANOMALIES IN DATA SCIENCE
21
Network methods. Based on these researching result, we could apply each of these methods to
detect anomalies points and regions in the data set.
Table 1
Summary of researching techniques of anomalies detection and analysis
Types Techniques Algorithm
Basic Methods
Moving Average
Comparative Analysis
Control Chart
Basic Statistical Analysis
Advanced Methods
Cluster Analysis
Connective-base
K-Means
DBSCAN
K-Nearest Neighbor C-NN
Neural Network
Then, we have discussed two applications of anomalies detections and analysis as examples.
One of which is to detect population in a city by PAD system, that could collect data from mobile
devices. Thus, by collecting those points, researchers could analyze and predict population in
particular regions, in order to avoid violence issues. The other of which is to detect Internet traffic
anomalies by Holt-Winters technology.
To sum up, the techniques of anomalies detection and analysis have been widely applied
to various fields and business cases. A number of applications and software have been created by
researchers and scientists to detect the anomalies, such as ELKI (for Environment for DeveLoping
KDD-Applications Supported by Index-Structures), which is is an open-source Java data mining
toolkit that contains several anomaly detection algorithms, as well as index acceleration for them.
22. DEVELOPMENT & APPLICATIONS OF ANOMALIES IN DATA SCIENCE
22
4. Discussion & Conclusion
At discussion chapter, we will discuss the limitation based on the process of researching
and describe future work on detection and analysis of anomalies.
For better to learn further about each anomalies technique, the comparison is an efficient
way. For instance, let us take a review of advantages and disadvantages of Clustering Analysis
Techniques, according to the analysis by Chandola et al in 2009.
First, the advantages of Clustering Analysis techniques are as follows:
(1) Clustering Analysis techniques could operate in an unsupervised mode.
(2) Such techniques could often be adapted to other complicated data types by simply
plugging in a clustering algorithm that can handle the particular data type.
(3) The testing phase for Clustering Analysis techniques was fast since the number of
clusters against which every test instance needed to be compared was a small constant.
And the disadvantages of Clustering Analysis techniques are as follows:
(1) The performance of Clustering Analysis techniques was dependent on the effectiveness
of clustering algorithms in capturing the cluster structure of normal instances.
(2) Many techniques detect anomalies as a byproduct of clustering and hence were not
optimized for anomaly detection.
(3) Several clustering algorithms forced every instance to be assigned to some cluster. This
might result in anomalies getting assigned to a large cluster.
(4) Several Clustering Analysis techniques were effective only when the anomalies did not
form significant clusters among themselves.
4.1 Limitations
So far in our research, we proposed several techniques of anomalies detection and analysis.
However, other methods that have been designed recently, could not be included in this paper,
such as Bayesian Networks-Based, Support Vector Machines-Based and Rule-Based algorithms.
According to Chandola et al. in 2009, Bayesian networks had been used for anomaly
detection in the multi-class setting. A technique for a unilabiate categorical data set using Bayesian
23. DEVELOPMENT & APPLICATIONS OF ANOMALIES IN DATA SCIENCE
23
network estimated the posterior probability of observing a class label from a set of normal class
labels and the anomaly class label. The class label with the largest posterior was chosen as the
predicted class for the given test instance. The zero probabilities, especially for the anomaly class,
are smoothed using Laplace Smoothing.
About Support Vector Machines (SVMs), Vapnik have found in 1995 that it had been
applied to anomaly detection in the one-class setting. Such techniques used one class learning
techniques for SVM and learn a region that contains the training data instances. For each test
instance, the basic technique determined whether the test instance falls within the learned region.
If a test instance falls within the learned region, it is declared as normal, else it is declared as
anomalous.
Rule-based anomaly detection techniques learned rules that captured the normal behavior
of a system. A test instance that was not covered by any such rule is considered as an anomaly.
Rule-based techniques had been applied in multi-class as well as one-class settings.
In summary, in this paper, we have discussed different anomaly detection and analysis
methods. When applying a given technique to a particular domain, these basic theories can be used
as guidelines to assess the effectiveness of the technique in that domain. Ideally, a comprehensive
introduction to anomaly detection and analysis should not only understand the background and
basic theory behind using a particular anomaly detection technique, but also provide a comparative
analysis of various techniques. But the current research has been done in a different way, without
relying on a complete structure of anomalies knowledge base, which makes the work of providing
a theoretical understanding of the anomaly detection problem much difficult.
4.2 Future work
A possible future work would be to research different techniques regarding the normal and
anomalous behavior into a statistical theory or database framework. There are several promising
directions for further research do exist in anomaly detection.
Such as, contextual and collective anomaly detection techniques are new to find increasing
applicability in several fields and there is much space for developing new techniques in this area.
While such techniques process information available at multiple websites, they often have to
simultaneously protect the information present in each site, thereby requiring privacy-preserving
24. DEVELOPMENT & APPLICATIONS OF ANOMALIES IN DATA SCIENCE
24
anomaly detection techniques is a bit difficult for research. Many techniques discussed in this
paper require the test before applying detecting anomalies in applications. Thus, the future research
of anomalies still exists and new area and scope are waiting to explore by human researchers and
scientists.
25. DEVELOPMENT & APPLICATIONS OF ANOMALIES IN DATA SCIENCE
25
References
AGYEMANG, M., BARKER, K., AND ALHAJJ, R. 2006. A comprehensive survey of numeric
and symbolic outlier mining techniques. Intel. Data Anal. 10, 6, 521–538.
AL-Masri, A. N., & Nasir, M. M. (2016). Learning Machine Implementation for Big Data
Analytics, Challenges and Solutions. Journal of Data Mining in Genomics & Proteomics, 2016.
Angiulli, F. (2007). Fast nearest neighbor condensation for large data sets classification.
Knowledge and Data Engineering, IEEE Transactions on,19(11), 1450-1464.
Cedeño, W., & Agrafiotis, D. K. (2003). Using particle swarms for the development of QSAR
models based on K-nearest neighbor and kernel regression. Journal of computer-aided molecular
design, 17(2-4), 255-263.
Chandola, V., Banerjee, A., & Kumar, V. (2009). Anomaly detection: A survey. ACM Computing
Surveys (CSUR), 41(3), 1-58. doi:10.1145/1541880.1541882
Frank, R. E., & Green, P. E. (1968). Numerical taxonomy in marketing analysis: a review article.
Journal of Marketing Research, 83-94.
FUJIMAKI, R., YAIRI, T., AND MACHIDA, K. 2005. An approach to spacecraft anomaly
detection problem using kernel feature space. In Proceedings of the 11th ACM SIGKDD
International Conference on Knowledge Discovery in Data Mining. ACM Press, 401–410.
GOLDBERGER, A. L., AMARAL, L. A. N., GLASS, L., HAUSDORFF, J. M., IVANOV, P. C.,
MARK, R. G., MIETUS, J. E., MOODY, G. B., PENG, C.-K., AND STANLEY, H. E. 2000.
Hart, P. (1968). The condensed nearest neighbor rule (corresp.). IEEE Transactions on Information
Theory, 14(3), 515-516. doi:10.1109/TIT.1968.1054155
HODGE, V. AND AUSTIN, J. 2004. A survey of outlier detection methodologies. Artif. Intel.
Rev. 22, 2, 85–126.
JAIN, A. K. AND DUBES, R. C. 1988. Algorithms for Clustering Data. Prentice-Hall, Inc.
KUMAR, V. 2005. Parallel and distributed computing for cybersecurity. IEEE Distrib. Syst. Online
6, 10.
Liu, S., Chen, L., & Ni, L. M. (2014). Anomaly detection from incomplete data. ACM Transactions
on Knowledge Discovery from Data (TKDD), 9(2), 1-22. doi:10.1145/2629668
Li, J., & Behjat, L. (2006). A connectivity based clustering algorithm with application to VLSI
circuit partitioning. IEEE Transactions on Circuits and Systems II: Express Briefs, 53(5), 384-388.
doi:10.1109/TCSII.2005.862174
26. DEVELOPMENT & APPLICATIONS OF ANOMALIES IN DATA SCIENCE
26
PATCHA, A. AND PARK, J.-M. 2007. An overview of anomaly detection techniques: Existing
solutions and latest technological trends. Comput. Netw. 51, 12, 3448–3470.
PhysioBank, PhysioToolkit, and PhysioNet: Components of a new research resource for complex
physiologic signals. Circulation 101, 23, e215–e220. Circulation Electronic Pages:
http://circ.ahajournals.org/cgi/content/full/101/23/e215.
Ryan, J., Lin, M. J., & Miikkulainen, R. (1998). Intrusion detection with neural networks.
Advances in neural information processing systems, 943-949.
Schmaroz, B. (2012). Anomalies Identification: A Simple Big Data Analytics Starting Point.
Infocus Global Service Blog. Retrieved from
https://infocus.emc.com/william_schmarzo/anomalies-identification-a-simple-big-data-analytics-
starting-point/
SONG, X., WU, M., JERMAINE, C., AND RANKA, S. 2007. Conditional anomaly detection.
IEEE Trans. Knowl. Data Eng. 19, 5, 631–645.
SPENCE, C., PARRA, L., AND SAJDA, P. 2001. Detection, synthesis and compression in
mammographic image analysis with a hierarchical image probability model. In Proceedings of the
IEEE Workshop on Mathematical Methods in Biomedical Image Analysis. IEEE Computer Society,
3.
STEINWART, I., HUSH, D., AND SCOVEL, C. 2005. A classification framework for anomaly
detection. J. Mach. Learn. Res. 6, 211–232.
THEILER, J. AND CAI, D. M. 2003. Resampling approach for anomaly detection in multispectral
images. In Proceedings of the SPIE. vol. 5093, 230–240.
Tvaronaviciene, M., Razminiene, K., & Piccinetti, L. (2015). APROACHES TOWARDS
CLUSTER ANALYSIS. Economics & Sociology, 8(1), 19-27. Retrieved from
http://proxygw.wrlc.org/login?url=http://search.proquest.com/docview/1696717964?accountid=1
1243