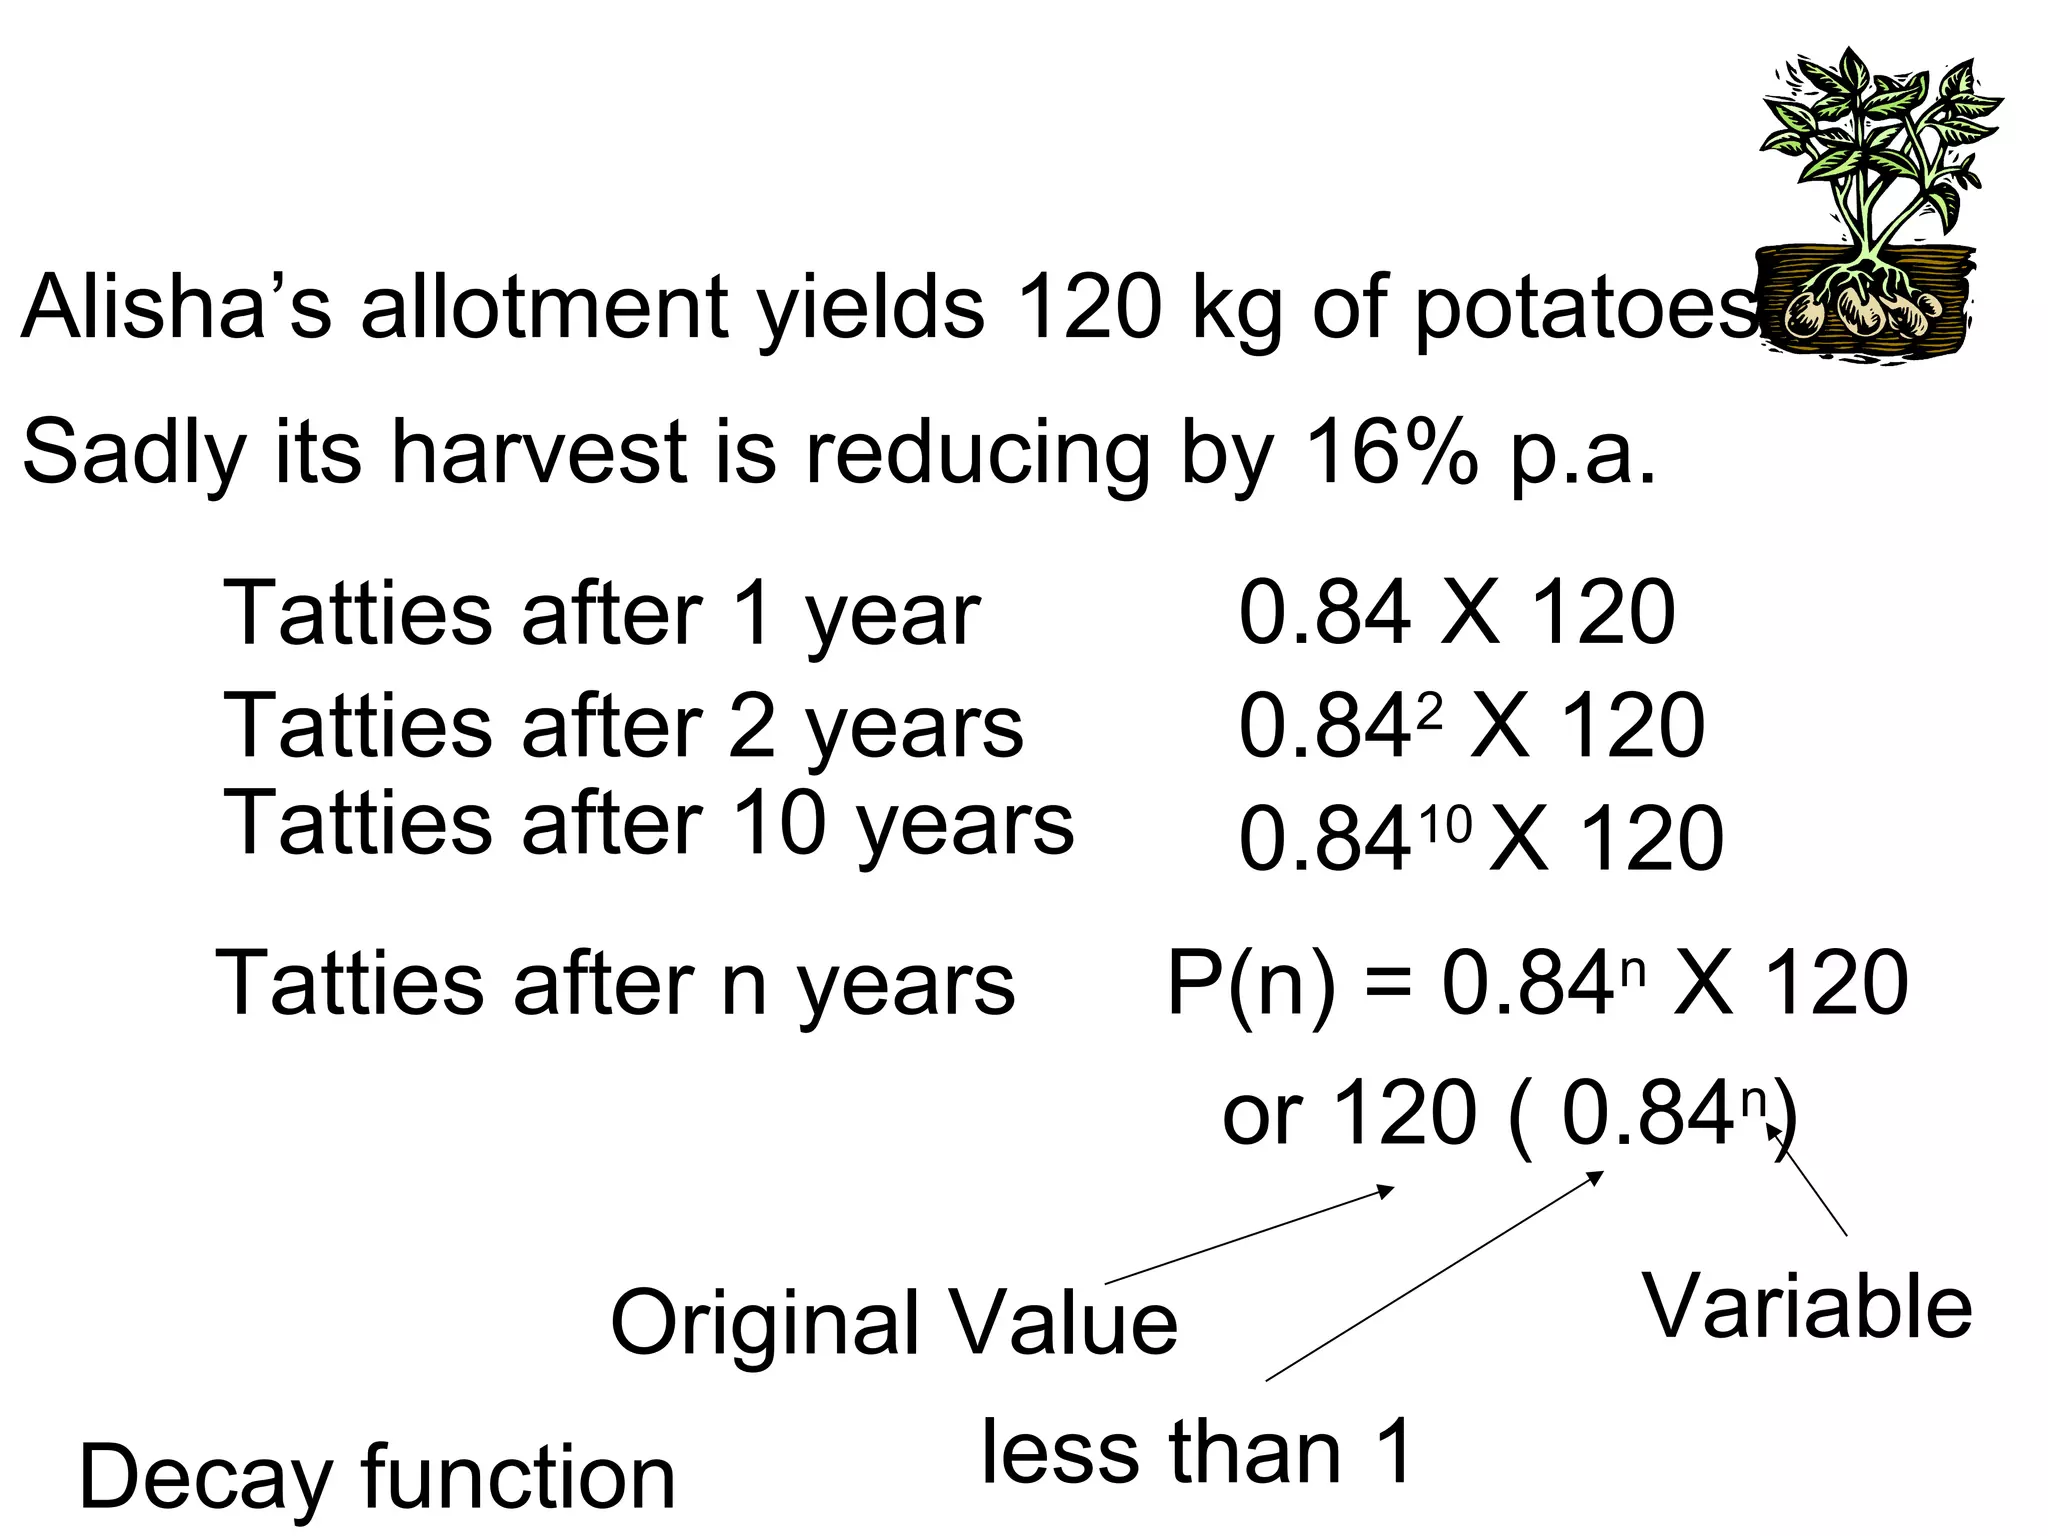
1) The document discusses growth and decay functions using two examples: Harry's hedge, which grows 7% annually, and Alisha's allotment, which yields less potatoes each year due to a 16% annual decay.
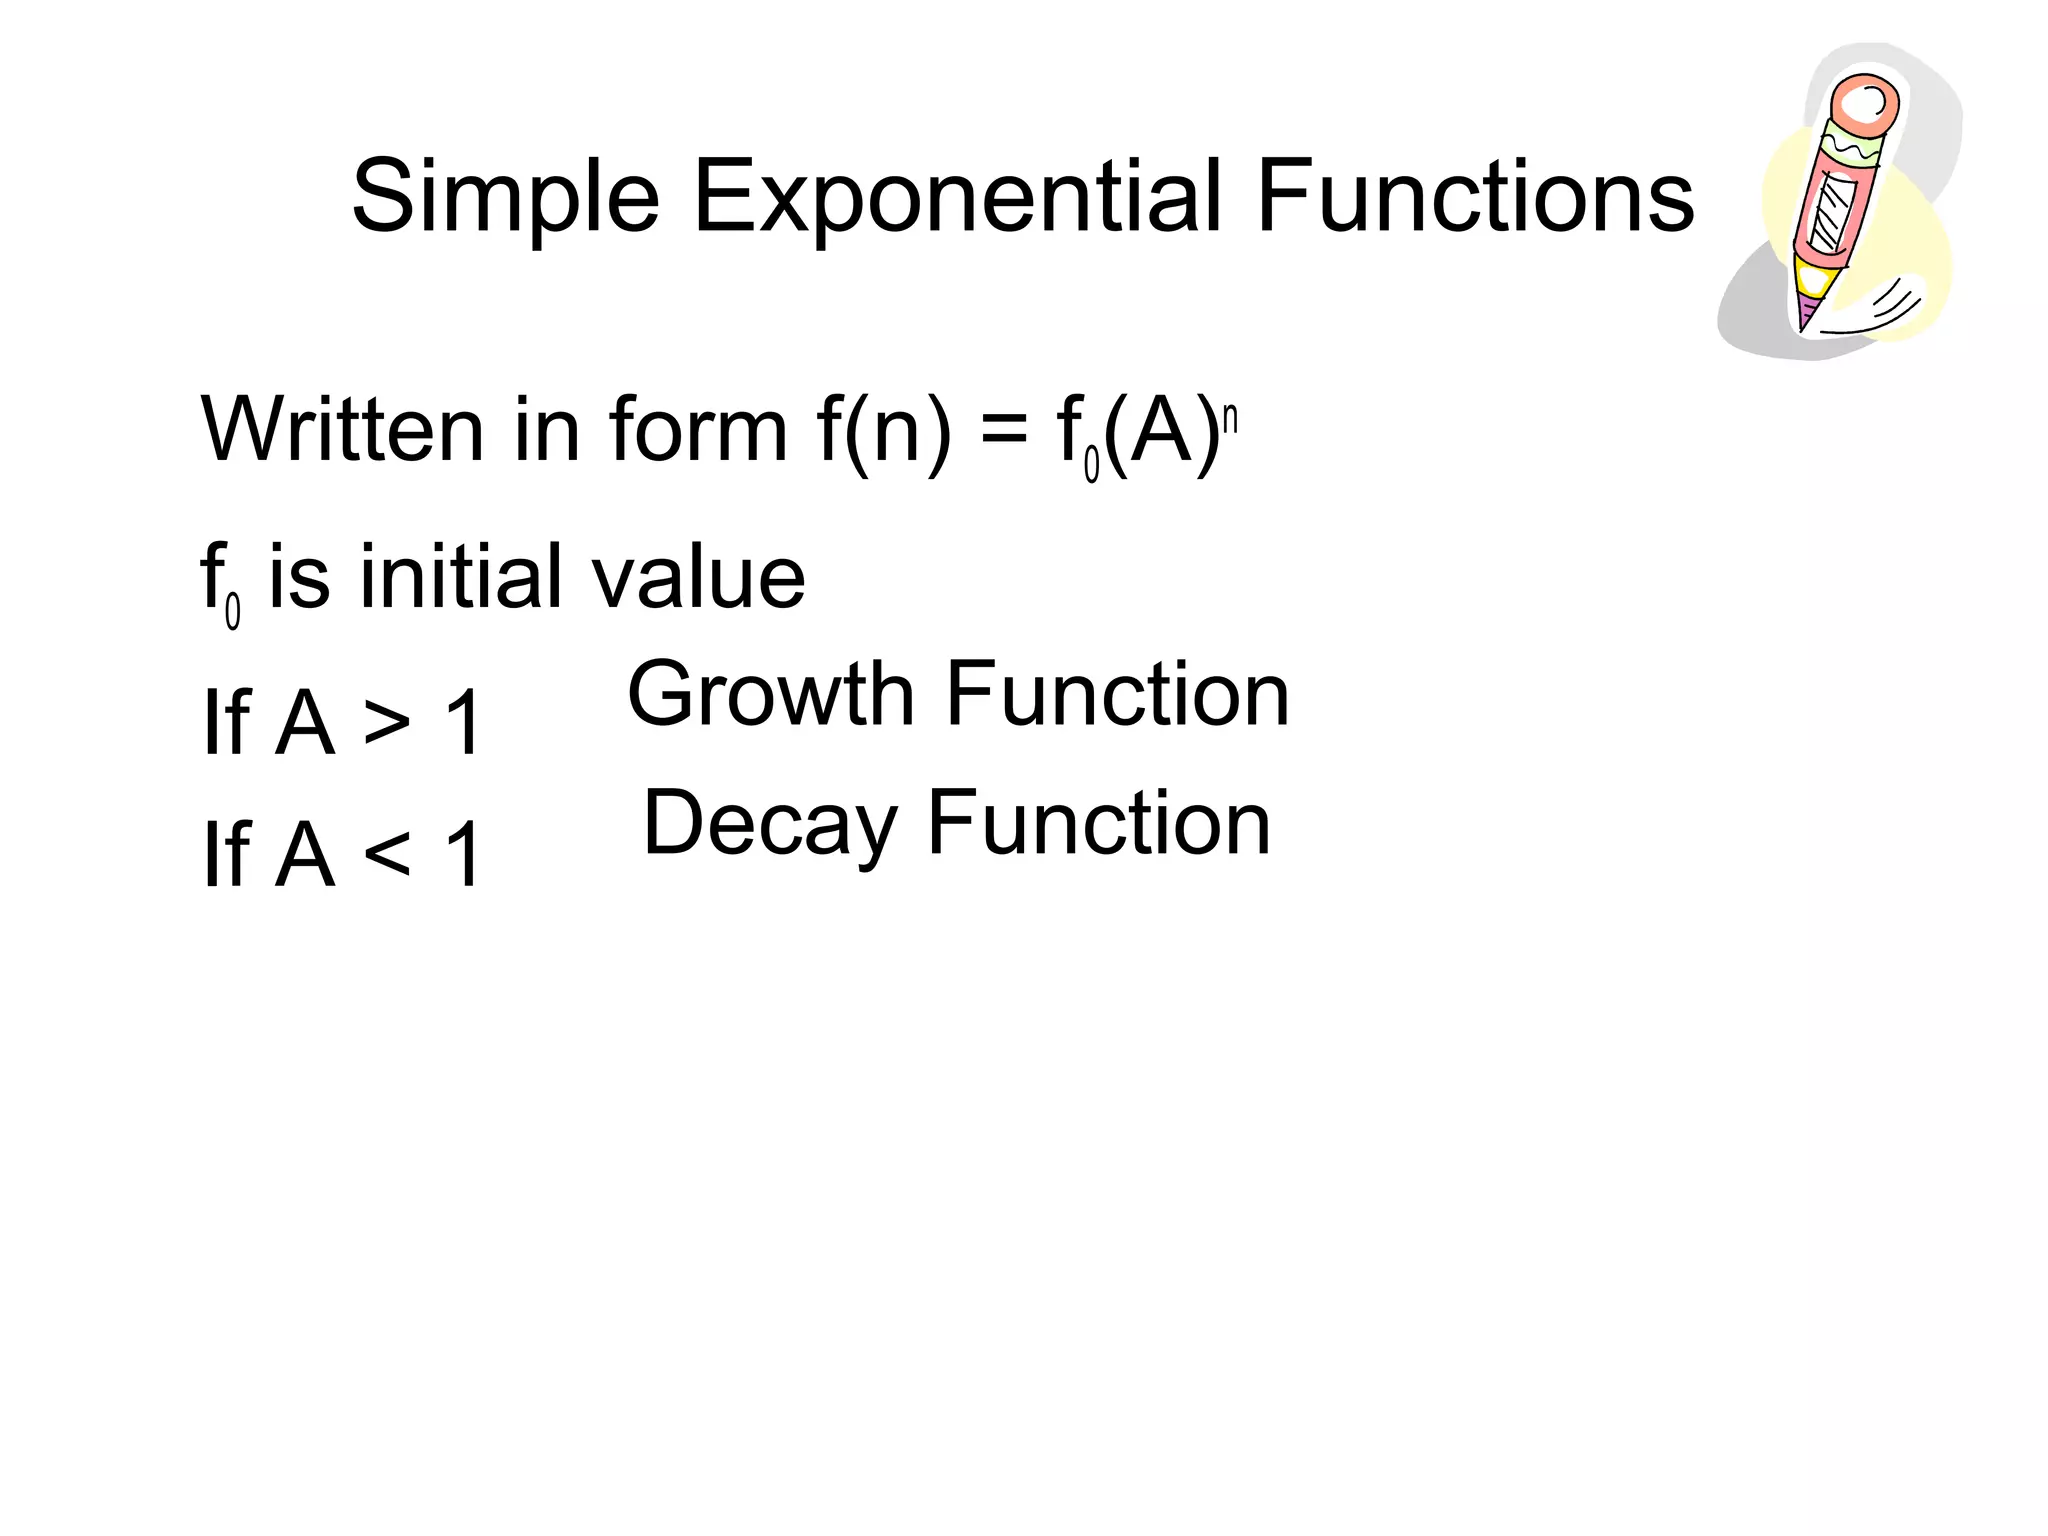
2) Growth functions take the form f(n) = f0(A)n, where A is greater than 1, while decay functions take the same form but with A less than 1.
3) Both growth and decay functions are examples of simple exponential functions.