
Recommended
Recommended
More Related Content
Similar to Flexural behaviour of RC one-way slabs reinforced using PAN based carbon textile grid.pdf
Similar to Flexural behaviour of RC one-way slabs reinforced using PAN based carbon textile grid.pdf (20)
More from Shakerqaidi
More from Shakerqaidi (20)
Recently uploaded
Recently uploaded (20)
Flexural behaviour of RC one-way slabs reinforced using PAN based carbon textile grid.pdf
- 1. Flexural behaviour of RC one-way slabs reinforced using PAN based carbon textile grid Suhad M. Abd1 , Amer M. Ibrahim1 , Omar H. Hussein1 *, Saba Shamim2 , Shaker Qaidi3,4 *, Hadee Mohammed Najm5 , Yasin O. Özkılıç6 and Mohanad Muayad Sabri Sabri7 1 Department of Civil Engineering, College of Engineering, University of Diyala, Baqubah, Iraq, 2 Civil Engineering Section, University Polytechnic, New Delhi, India, 3 Department of Civil Engineering, College of Engineering, University of Duhok, Duhok, Iraq, 4 Department of Civil Engineering, College of Engineering, Nawroz University, Duhok, Iraq, 5 Department of Civil Engineering, Zakir Husain Engineering College, Aligarh Muslim University, Aligarh, India, 6 Department of Civil Engineering, Faculty of Engineering, Necmettin Erbakan University, Konya, Turkey, 7 Peter the Great St. Petersburg Polytechnic University, St Petersburg, Russia Textile reinforced mortar (TRM) is mainly used for strengthening of existing structural members whereas, on the other hand Textile reinforced concrete (TRC) is a technology implied in construction of new members for enhancing the structural behaviour. Application of TRM on the tension zone of the reinforced concrete (RC) slabs to improve the flexural capacity has been investigated by many researchers in the past. However, the effectiveness of textile fabrics, used as internal reinforcement in the RC slab (TRC technology) needs to be studied. The paper, therefore, presents the experimental research conducted on three one-way RC slabs specimens reinforced using textile grid. An innovative Polyacrylonitrile (PAN) based carbon textile grid was used as internal reinforcement in combination with the steel bars. Two textile-reinforced RC slabs having one and two layers of textile grid (SRC + 1T and SRC + 2T respectively) and one reference slab (SRC) was fabricated to investigate the flexural behaviour under a four-point loading system. The internal textile reinforcement layer(s) was confirmed to be effective, particularly in terms of improving the cracking load, ductility, deformability and toughness. The material ductility of SRC + 1T and SRC + 2T slabs were increased by 41% and 44% compared to SRC slab. Also, the deformability ratio was found to be greater than 4, indicating a ductile failure of textile-reinforced slabs. Further, based on the load-deflection relation, moment-curvature curves were derived. Moreover, these curves were also developed using Eurocode two prediction model. The experimental and the predicted moment-curvature curves showed good agreement. KEYWORDS RC slab, textile reinforcement, cracking load, ductility, deformability, momentcurvature curve 1 Introduction The strengthening and retrofitting of existing structures as well as the search for innovative construction technologies yielding enhanced strength have been a major concern for engineers in recent years. There are various reasons for this, such as structural insufficiency, deficient concrete, great incoming loads and sometimes complying with the new standards (Aljazaeri Zena, 2018; Saeed et al., 2022b; Zeybek et al., 2022). Several strengthening composites and systems ranging from engineered cementitious composites (ECC), fibre reinforced polymers (FRP), textile reinforced OPEN ACCESS EDITED BY Chaoyu Chen, Jiangnan University, China REVIEWED BY Francesco Bencardino, University of Calabria, Italy Tao Liu, Xi’an Polytechnic University, China Zhifang Dong, Xi’an University of Architecture and Technology, China *CORRESPONDENCE Omar H. Hussein, ekhel199276@gmail.com Shaker Qaidi, shaker.abdal@uod.ac SPECIALTY SECTION This article was submitted to Structural Materials, a section of the journal Frontiers in Materials RECEIVED 14 October 2022 ACCEPTED 09 January 2023 PUBLISHED 20 January 2023 CITATION Abd SM, Ibrahim AM, Hussein OH, Shamim S, Qaidi S, Najm HM, Özkılıç YO and Sabri Sabri MM (2023), Flexural behaviour of RC one-way slabs reinforced using PAN based carbon textile grid. Front. Mater. 10:1070457. doi: 10.3389/fmats.2023.1070457 COPYRIGHT © 2023 Abd, Ibrahim, Hussein, Shamim, Qaidi, Najm, Özkılıç and Sabri Sabri. This is an open-access article distributed under the terms of the Creative Commons Attribution License (CC BY). The use, distribution or reproduction in other forums is permitted, provided the original author(s) and the copyright owner(s) are credited and that the original publication in this journal is cited, in accordance with accepted academic practice. No use, distribution or reproduction is permitted which does not comply with these terms. Frontiers in Materials frontiersin.org 01 TYPE Original Research PUBLISHED 20 January 2023 DOI 10.3389/fmats.2023.1070457
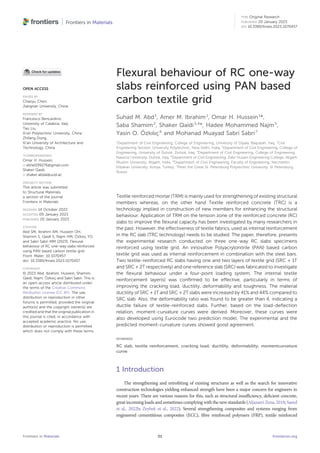
- 2. mortar (TRM) and steel reinforced grout (SRG) have emerged for upgrading the civil engineering structures (Xie et al., 2022; Liu et al., 2023; Sadrolodabaee et al., 2023). Among these TRM gained great recognition as strengthening material for existing structures. Based on a similar approach Textile reinforced concrete (TRC) was developed and emerged to be an innovative construction technique for new age buildings. TRM is mainly used for strengthening of existing structural members whereas, on the other hand TRC is a technology implied for new structural members for enhanced structural behaviour (Taerwe and Matthys, 2013; Dong et al., 2021; Dong et al., 2022). TRC is “a unique composite material made by inserting continuous textile fabric with fine-grained concrete, which is composed of a cement binder and fine particles. Textile reinforcement materials are made up of continuous length yarns, which are made up of hundreds, thousands, or tens of thousands of filaments. The filaments in the yarn are classified as exterior (sleeve) and internal (core). Because the sleeve filaments are only in full interface with the surrounding matrix, tensile stresses are transferred from the matrix to the yarn sleeve filaments through adhesive, while the core filaments, which are in less contact with the matrix, act on friction” (Hussein et al., 2022). TRC are well suited for situations where strain hardening is necessary, and steel reinforcing can be omitted, or for buildings exposed to seismic stresses and requiring high ductility (Torres et al., 2015; Saeed et al., 2022a; Qaidi et al., 2022b). In international literature, there are a substantial amount of research articles on the strengthening effect of TRM in reinforced concrete (RC) beams (Loreto et al., 2015; Qaidi et al., 2022a; Bencardino and Nisticò, 2022). Loreto et al. (2015) evaluated the performance of RC beams strengthened using Fabric reinforced cementitious matrix (FRCM) in shear zone in the form of U-wraps. The experimental and analytical results indicated that increase in the shear capacity of the FRCM strengthened beam was not proportionally to the number of placed fabric layers and FRCM failure modes were found to be dependent on the amount of external reinforcement. Similarly, Bencardino and Nisticò (2022) also investigated the behaviour of different Steel-FRCM beams in direct shear and flexure. Two different unidirectional steel fibres were used namely, stainless steel and galvanized high strength steel. Debonding between the matrix–fibre interface (mode C) and Steel-FRCM composite (mode B) was witnessed, confirming the non- involvement of the concrete substrates. Ombres (2011) reported an increase in bearing capacity of RC beams strengthened using one to three layers of PBO (Polypara-phenylene-benzo-bisthiazole) fabric mesh by 16%, 33% and 40% respectively, compared to an un- strengthened RC beam. Ebead et al. (2019) observed that RC beams strengthened using one or two layers of PBO fabric failed to fabric slippage whereas, failed due to delamination of layers when three layers of strengthening were adopted. This similar phenomenon was also observed by Elsanadedy et al. (2013); Bencardino and Nisticò (2022). Besides Elsanadedy et al. (2013) also compared the ductility response of FRP and TRM (basalt-based textile) strengthened RC beams wherein the ductility of TRM strengthened beam was found to be superior to the FRP strengthened beam. Therefore, strengthening of RC beams using different types of textile reinforcement systems has shown a potential enhancement in flexural capacity accompanied by a reduction in deflection magnitude as well as crack width (Bencardino and Nisticò, 2022). Consequently, research on the strengthening of RC slabs using the TRM, are rather limited in the open literature (Loreto et al., 2014; Koutas and Bournas, 2017; Althoey et al., 2022; Çelik et al., 2022). Loreto et al. (2014) studied the behavior of an RC slab with an externally reinforced fabric (PBO) reinforced cementitious matrix layer on the tension face. When the number of fabric layers was increased, the load capacity of the slab improved. TRM (uncoated/dry carbon and glass fiber rovings) strengthening of two-way slab enhanced pre-cracking and post-cracking stiffness, as well as cracking load, according to Koutas and Bournas (2017); Zhang et al. (2022) investigated the flexural behavior of one-way RC slabs reinforced with textile-reinforced geopolymer mortar (TRGM) and textile-reinforced polymer mortar (TRPM). The findings revealed that TRGM reinforced slabs had greater flexural capacity and better fracture control than TRPM strengthened slabs. Furthermore, it was discovered that increasing the number of layers and lowering the gap between the lateral textiles increased the flexural capacity of slabs (Papanicolaou et al., 2009; Ahmed et al., 2021; Tayeh et al., 2022; Unis Ahmed et al., 2022). And only one research article has been reported till date on the manufacturing of one-way RC slabs using TRC technology (Schladitz et al., 2012). Schladitz et al. (2012) found that one-way RC slabs reinforced with one to four layers of Polymer-coated fabric composed of carbon rovings had a considerable improvement in load-bearing capacity and a reduction in slab deflection when compared to a reference RC slab with no textile layer. Despite the available research findings on TRC slabs, experimental investigation considering different combinations of textile and the cementitious matrix is further required. The objective of the present study is to investigate the four-point flexural bending behaviour of textile reinforced RC slab with a thickness of 50 mm, having one and two internal layers of an innovative Polyacrylonitrile (PAN) based carbon textile grid. An extensive discussion of results has been presented in terms of; load-deflection curve, failure mode, cracking pattern, strain profile and moment-curvature relation of the slabs. A total of three one-way slabs were fabricated; reference/steel reinforced concrete (SRC) slab having only steel reinforcement, steel reinforced concrete slab having one layer of textile grid (SRC + 1T) and steel reinforced concrete slab having two layers of textile grid (SRC + 2T). 2 Experimental study 2.1 Materials Fine grain concrete was prepared using Iraqi Portland cement (Grade-43) confirming the Iraqi specification (Specification I. S., 1984), and fine anti-slip sand having a maximum size of 1.18 mm, graded as per (Specification I., 1984) was used. The average cylinder compressive strength, split tensile strength and modulus of elasticity were experimentally determined in the laboratory according to ASTM C-496 (Designation, 1996). The corresponding values 51 MPa, 4.14 MPa and 31528 MPa were observed. The primary and secondary steel reinforcing bars were both deformed and hot-rolled to 4.45 mm in diameter. According to ASTM A615 (American Society for Testing and Materials (ASTM), 2000), the average yield strength was 390 MPa, the yield strain was 0.002, the ultimate strength was 464.7 MPa, and the modulus of elasticity was 195000 MPa. A woven and balanced PAN based carbon textile grid (as shown in Figure 1) was used in this study. The mechanical properties of the PAN textile provided by the manufacturer (Jiaxing Newtex Composites) are summarized in Table 1. The nominal size of the PAN grids was 20 × 25 Frontiers in Materials frontiersin.org 02 Abd et al. 10.3389/fmats.2023.1070457
- 3. (mm2 ). The equivalent thickness of the textile was 0.2 mm with the cross-sectional area of each yarn 0.4–0.6 mm2 in both warp and weft directions. The tensile strength of the textile was 3530 MPa in both orthogonal directions. For enhancing the bond between the cement matrix and PAN grid, a special mortar was used to cast the textile-reinforced slabs having one and two layers of PAN textile. The mortar matrix consists of Portland cement (PC-43), fine anti-slip sand (max. size ≤ 1.18 mm), silica fume and water in the proportion 650: 1,215: 65: 250 by weight (kg/m3 ). The water/cement ratio (w/c) was taken as 0.36 and 15.37 kg/ m3 of super-plasticizer was added to the matrix. 2.2 Preparation of test specimen Herein, three slabs having dimensions 1,500 × 500 × 50 (mm3 ) were cast using the hands layup procedure. All the slabs were cast in the plywood mould. Before the cast, strain gauges were fixed, one on the central longitudinal steel bar and another was attached to the middle yarn of each PAN grid with the help of a strong adhesive. Also, these strain gauges were coated with a thin resin coating for protection against susceptible moisture and damage. In the reference slab- SRC, longitudinal and transverse steel bars (Φ4.45 mm) were placed @115 mm and @240 mm c/c respectively and casting was done using fine grain concrete. A clear cover of 10 mm was provided. The cross-sectional view of the SRC slab is shown in Figure 2A. Textile- reinforced slab SRC+1T, was cast using polymer cement matrix. A 10 mm thick layer of polymer cement matrix was poured into the mould above which a 0.2 mm thick layer of PAN grid was placed. Again, a 4–5 mm thick cement layer was placed, above which the longitudinal and transverse steel bars (Φ4.45 mm) were placed in a similar pattern as in SRC. The detailed cross-sectional view of SRC + 1T is illustrated in Figure 2B. In slab SRC + 2T, one more layer of PAN textile was introduced into the cement matrix above the steel reinforcement. Following the similar steps of slab cast as in SRC + 1T, after the placement of steel bars, a 4–5 mm thick polymer cement layer was poured, above which the second layer of PAN grid was placed, see Figure 2C. The slabs were removed from the mould after 48 h and cured in large basins for a period of 28 days in the laboratory environment. Later, the slabs were painted to give it a final finishing touch prior to testing. Also, at this stage, an external strain gauge was placed using adhesive, on the upper face of each slab as shown in Figure 2. 2.3 Test setup The flexural behaviour of three slab specimens was verified using a four-point bending test in the department of Civil engineering, College of Engineering, Diyala University, Iraq. The test setup is as shown in Figure 3. Each slab specimen was placed simply supported over a clear span of 1,400 mm with a 50 mm overhang on both ends. Two concentrated loads 300 mm apart were applied at the mid span of the slab through a hydraulic system. The deflection of the slab was measured using three dial gauges. An electronic dial gauge was placed under the mid span of the slab. The other two mechanical dial gauges were placed under the slab at a distance of 400 mm from each support. The embedded strain gauges were connected to a Data logger (TDC- 530) to measure the corresponding strain in the PAN grid, steel reinforcement and concrete. The load was applied and the readings for the strain and deflection were reported for every 0.1–1 kN increment. Upon the failure of the specimen, the crack width was measured using a micro crack meter. 3 Discussion of the experimental results The results pertaining to the flexural behaviour of slabs; SRC, SRC + 1T and SRC + 2T subjected to a four-point bending test have been summarized in Table A1 in appendix. Also, the results have been compared with the similar studies existing in literature. FIGURE 1 PAN based carbon textile grid. TABLE 1 Properties of PAN textile reinforcement provided by the manufacturer. Weight (kg/m2 ) Thickness (mm) Mesh size (mm × mm) Tensile strength (MPa) Elastic modulus (MPa) 0.16 ± 0.01 0.2 20 × 25 3530 230000 Frontiers in Materials frontiersin.org 03 Abd et al. 10.3389/fmats.2023.1070457
- 4. 3.1 Load-deflection curve Figure 4 depicts the load-deflection curve for the three tested slab specimens. For describing the flexural behaviour of the slabs, the load- deflection curve has been divided into four regions: uncracked (OA), crack development (AB), crack stabilization (BC) and fully cracked/ failure (CD). The values of the characteristic points: cracking, yield and ultimate are summarized and compared with the existing studies in Table A1 (Col. 11–17). The region OA clear indicates the elastic region where load and deflection linearly increase to arrive at the cracking point. This region is principally governed by the stiffness of the concrete matrix. In slab SRC the first cracking was observed at 1.2 kN load (Pcr), deflecting the slab by 0.83 mm (Δcr). In SRC+1T, the same was witnessed at 2.09 kN causing a deflection of 1.31 mm in the slab. And, in slab SRC+2T, Pcr and corresponding Δcr were observed as 3.48 kN and 2.07 mm respectively. Hence, Pcr in SRC + 1T and SRC + 2T were increased by about 74.2% and 190% respectively compared with the SRC first crack load. In the region AB, a perceptible jump in load was noticed with minimal increase in the magnitude as well as, consecutive crack formation. Here, the tensile load was absorbed by the steel and textile reinforcement and subsequently, steel reinforcement reaches the yield point. For the slabs SRC, SRC + 1T, and SRC + 2T; the capacity at yield point (Py) was marked at 4.20 kN, 7.05 kN and 8.55 kN respectively. The load at the yield of the steel reinforcement was increased in SRC + 1T and SRC + 2T by about 115% and 91.5% respectively compared to the SRC yield load, due to the contribution of textile reinforcement in bearing the load. Also, the corresponding yield deflections (Δy) of 15.20 mm, 19.17 mm and 19.63 mm respectively were recorded for SRC, SRC + 1T and SRC + 2T. Following the yielding of steel bars, in FIGURE 2 Details of the slab specimen (A) SRC (B) SRC + 1T (C) SRC + 2T. FIGURE 3 Laboratory setup for the four-point bending test of the slab specimens. Frontiers in Materials frontiersin.org 04 Abd et al. 10.3389/fmats.2023.1070457
- 5. the region BC, the additional load was further afforded by the PAN textile reinforcement until the ultimate point was reached. The cracks in this region were stabilized, which may be attributed to the textile reinforcement effect in bridging the micro cracks. Then the load rapidly drops off marking the failure of the textile reinforcement layer (region CD). The region BC represents a gain in stiffness (Orosz et al., 2010) of textile reinforcement known as deformation hardening in flexure (Williams Portal et al., 2017; Qaidi et al., 2022f; Qaidi et al., 2022g). The ultimate capacity (Pu) for the slabs SRC, SRC + 1T and SRC + 2T was observed as 5.50 kN, 9.31 kN and 11.17 kN; contributing to an ultimate deflection (Δu) of 26.04 mm, 46.03 mm and 48.28 mm respectively. In the case of slab SRC, region BC was not pragmatic, due to the nonexistence of textile reinforcement layer and failure of steel reinforcement after the first cracking. 3.2 Cracking pattern and mode of failure Table 2 illustrates the crack details for the three tested slabs. The cracking load to the ultimate load ratio (Pcr/Pu) was observed to be 0.218, 0.229 and 0.311 in slabs; SRC, SRC + 1T and SRC + 2T respectively. The increase in this ratio ascribes a delay in the first crack occurrence in the case of textile-reinforced slabs since it inhibits the micro-cracks extension. The textile-reinforced composite reaches a multiple cracking stage by transferring the tensile stresses to the closest uncracked mortar. When the concrete reaches its ultimate tensile strength, the crack appears, and the stresses are transferred to the next adjacent point in the same zone till it is also cracked. This contribution of tensioned concrete between the cracks is defined as tension stiffening (Torres et al., 2015). The spacing between the previous and the new cracks depends on the bond strength. The spacing between the two closest cracks in SR was found to be ~30 mm whereas; in case of SRC + 1T and SRC+2T, this was ~20 mm and ~10 mm respectively. Also, the widths of the crack were measured as 0.340 mm, 0.241 mm and 0.238 mm respectively. Yin et al. (2014) also reported a comparable reduction in crack width in the case of textile-reinforced RC beams compared to conventional RC beam. Additionally, it was also verified that crack formation and textile reinforcement ratio are inversely related. The deflection at first cracking (Δcr) in SRC + 1T and SRC + 2T was increased by 63.8% and 158.8% respectively. This similar behaviour of increase in Δcr with the increase in the number of textile layers was also reported by Dong et al. (2021). However, the results contradict the observations of the uniaxial tensile test of TRM (Yang et al., 2019). The reason can be credited to the dissimilar stress states of tension and bending (Dong et al., 2021; Qaidi et al., 2022d; Qaidi et al., 2022e; Ibrahim et al., 2022). On the other hand, Δy of the three slab specimens was almost at the same level (between 15.2 and 19.63 mm) which confirms, that the yield point is primarily governed by the longitudinal steel reinforcement. Further, to have an insight into the mode of failure in the slab specimen, two parameters are of interest: deformability factor and ductility ratio. The deformability factor, according to the Canadian Standards Association (Association, 2012), is the product of the strength and deflection factors provided by Eqs 1, 2: Stength factor Pu P0.001 , (1) Deflection factor Δu Δ0.001 , (2) where P0.001 and Δ0.001 represents the load and deflection corresponding to strain = 0.001 respectively. The deformability factor for SRC cannot be obtained since the steel and concrete failed even before reaching the strain = 0.001 which corresponds to the brittle failure of the slab. The same for the slabs SRC + 1T and SRC + 2T was obtained as 5.78 and 5.04 respectively. Since these values are greater than 4, clearly indicate the ductile failure of slabs (Association, 2012). Further, the member ductility ratio is calculated from the following relation given in Eq. 3: Γ Δu Δy . (3) Concerning, Δy of the three slabs are at the same level, Γ will principally be controlled by Δu. For the slabs, a larger deflection was observed after the yield point, while the change in load was quite subordinate. This behaviour represents the strain hardening phase where the tensile reinforcement is forced outside the yield stage and reaches up to the hardening stage (Qaidi et al., 2021; Qaidi et al., 2022c; Emad et al., 2022; Faraj et al., 2022). The Γ of slabs SRC, SRC + 1T and SRC + 2T were 1.71, 2.41 and 2.46 respectively. The increase in Γ, confirms an improved ductile behaviour offered by the textile reinforcement. The failure and crack pattern of the three slab specimens is depicted in Figure 5. 3.3 Strain profile at mid span The strain gauge readings of the slabs; SRC, SRC + 1T, and SRC + 2T were shown at various load levels in Figures 6–8 based on data logger observations. During the elastic state, the change in strain in relation to the position of the gauge was found to be linear. However, after cracking, the tension in the textile layer increased rapidly. Also, as seen in Figure 9, the depth of the compression zone (x/d) decreases fast with increasing load, which may be ascribed to the steel reinforcement’s steadily developing strain. In the case of SRC + 1T and SRC + 2T, however, the curves decrease more slowly than the SRC curve. This illustrates the nature of the textile reinforcement’s contribution to stress bearing (Akeed et al., 2022; Al-Tayeb et al., 2022; Almeshal et al., 2022). This cooperative contribution seems to be uniform in the case of SRC + 2T, which may explain for its larger textile reinforcement ratio as compared to SRC + 1T. 3.4 Toughness Material toughness can be defined as the ability of the material to absorb energy in the plastic region. The area under the force- deformation curve or the stress-strain curve of the tested specimen under flexure is denoted as the toughness of the material. Mathematically, it can be defined as in Eq. 4. Frontiers in Materials frontiersin.org 05 Abd et al. 10.3389/fmats.2023.1070457
- 6. UΔ Δ 0 P x ( ).dx. (4) This area (UΔ) represents the energy per unit volume, which the material can acquire till rupture (Carneiro et al., 2005). ‘x’ is the deflection in the slab, Δ is the mid span deflection corresponding to the load P. The toughness of the tested slabs was calculated by two methods; Method one- numerical integration by trapezoidal rule and, Method two- integration of the load-deflection curve equation obtained from the curve fitting in Microsoft Excel. Figure 10 compares the toughness of the three tested slabs calculated by the two methods. The absorbed energy (toughness) in SRC, SRC + 1T and SRC + 2T, evaluated using Method one are 99.44, 314.58 and 397.21 kJ/m3 whereas, while using Method 2, the same were calculated as 100.82, 312.72 and 396.51 kJ/m3 respectively. The toughness evaluated using both the methods is satisfactorily correlated having COV = 0.9%, 0.4% and 0.1% for the three slabs. Moreover, textile reinforcement in SRC +1 T and SRC + 2T has enhanced the toughness by 210% and 293% respectively compared to SRC. 3.5 Experimental moment-curvature relation For the slab specimen subjected to four-point bending test (refer, Figure 11), the forces responsible for maximum bending moment will be; the self-weight of the slab (concrete + steel + strengthening) and the incoming external load P). Therefore, the equation for maximum flexural moment is given by [refer, Eq. 5], M WpLeff 2 8 + WRCLeff 2 8 + P 4 L′ − Leff . (5) The notations used in Eq. (5) are indicated in Figure 11. Wp and WRC are the self-weight of PAN grid and RC slab respectively. These self-weights are computed as a line load (Schladitz et al., 2012) and, moment was calculated for different magnitudes of load acting on the slab. The density of concrete was assumed as 25 kN/m3 . The curvature at each load is derived from the equilibrium and strain compatibility equation (Torres et al., 2015) and is given as in Eq. 6, φ ϵc xeq ϵr d − xeq , (6) where d is the effective depth of the section (here, d = 40 mm), xeq is the position of equivalent neutral axis, ϵc and ϵr are the maximum strain in the concrete and reinforcement respectively. The moment curvature plot obtained from the experimental observations has been plotted in Figure 12. The curvature of the three-slab specimen remained comparable till 0.33 kNm, which is also the experimental cracking moment (Mcr) of the slab SRC. At 1 kNm moment, the curvature in the reference was identified as ~60 × 10−6 /mm whereas, at the same moment the curvature in textile-reinforced slabs; SRC + 1T and SRC + 2T was observed as 25 and 15 (× 10−6 /mm) respectively. This decrease in curvature can be directly correlated to the tension stiffing effect of the textile reinforcement. The ultimate moment (Mu) in the slabs SRC, SRC + 1T and SRC + 2T was obtained at 1.4 kNm, 2.5 kNm and 3.1 kNm with corresponding curvature 100, 126 and 162 (× 10−6 /mm) respectievly. 3.6 Predicted moment-curvature relation EN 1992-1-1 (generally referred as Eurocode 2 (Institution, 2004)) deals with the rules and concepts required for designing concrete, reinforced concrete and prestressed concrete structures. Suitability of moment curvature prediction using Eurocode 2 has been widely accepted (Torres et al., 2015) for steel reinforced concrete and fibre reinforced concrete elements. Eurocode two interpolates the moment curvature between the fully cracked and FIGURE 4 Comparison of load-deflection curve for the three slab specimens. Frontiers in Materials frontiersin.org 06 Abd et al. 10.3389/fmats.2023.1070457
- 7. uncracked states, classically represented as in Figure 13. The bending and deformation behaviour of reinforced concrete typically has two states: state 1, uncracked and, state 2, fully cracked. The state one is governed by the linear elastic behaviour in both concrete and reinforcement. While, state 2, exhibits a nonlinear behaviour where, the reinforcement takes up all the tensile stresses acting on the member after cracking. The following Eq. 7 expresses the average curvature as: φ 1 − ξ ( )φ1 + ξφ2. (7) Here, φ1 and φ2 represents the curvatures corresponding to state 1 (uncracked) and state 2 (fully cracked) respectively. The coefficient ξ indicates the vicinity of the stress-strain state to the cracking. Its value approaches to zero at the cracking and reaches unity with the loading advancement (Institution, 2004). ξ 1 − βμ2 . (8) The β coefficient in Eq. 8 accounts for the impact and duration of loading (taken as, one for short-term loading and 0.5 for sustained or repeated loading). μ represents the cracking moment to applied moment ratio, (i.e., μ Mcr/M). Further, using the classical relation of ‘strength of materials’, the curvature φ1 and φ2 for the member can be calculated as given in Eq. 9 below: φ1 2 ( ) M EcI1 2 ( ) . (9) TABLE 2 Details of the crack pattern and failure mode. Slab symbol (Pcr/Pu) Crack width (in mm) at Spacing between the crack (mm) ~No. Of cracks Deformability factor Mode of failure Pcr 0.9Pu Min Max SRC 0.218 0.06 0.340 30 70 15 - Brittle SRC + 1T 0.229 0.02 0.241 20 30 26 5.78 Ductile SRC + 2T 0.311 0.02 0.238 10 30 24 5.04 Ductile FIGURE 5 Flexural failure of slabs; (A) SRC (B) SRC + 1T (C) SRC + 2T. Frontiers in Materials frontiersin.org 07 Abd et al. 10.3389/fmats.2023.1070457
- 8. Here, Ec is the modulus of elasticity of concrete. I1 and I2 corresponds to the moment of inertia of uncracked and fully cracked sections, respectively. The cracking moment of the reinforced concrete section is given as: Mcr σc t .Z1. (10) In Eq. 10, σc t is the tensile strength of concrete and Z1 is the section modulus in uncracked state 1. Now, considering the case of short-term loading (β 1) and using Eqs 3, 4, equivalent flexural stiffness in terms of equivalent moment of inertia can be derived [refer, Eq. 11]; Ieq I1I2 I2μ2 + I1 1 − μ2 , (11) where I1 and I2 represents the moment of inertia of uncracked and fully cracked states respectively. On the other hand, the equivalent moment of inertia for the cracked section derived using inverse relation (Torres et al., 2015) is given in Eq. 12, Ieq M φEc 1 2 bd3 xeq d 2 1 − 1 3 xeq d , (12) where d and b are the effective depth and width of the cross-section. Ratio ( xeq d ) is referred to as the relative depth of the compression zone. On equating Eqs 11, 12, equation for the relative depth of the compression zone is subsequently obtained. FIGURE 6 Strain profile of slab SRC. FIGURE 7 Strain profile of slab SRC+1T. FIGURE 8 Strain profile of slab SRC + 2T. FIGURE 9 Variation of the depth of compression zone (x/d) with respect to the applied load. FIGURE 10 Comparison of toughness between the slab specimens. Frontiers in Materials frontiersin.org 08 Abd et al. 10.3389/fmats.2023.1070457
- 9. xeq d 2 1 − 1 3 xeq d I2 I1 6 d D 3 μ2I2 I1 + 1 − μ2 . (13) The above Eq. 13 indicates that ( xeq d ) is dependent on the relative effective depth of the section (d D) and on the ratio I2/I1. The latter can be expressed as Eq. 14, I2 I1 1 2 bdx2 1 − x 3d 1 12 bD3 6 x d 2 1 − 1 3 x d d D 2 , (14) where I2 can be calculated from Eq. 11 applied to a fully cracked section and, the normalized depth of neutral axis (x d) can be evaluated by using Eq. 15 (Taerwe and Matthys, 2013); x d −ƞρ + ƞρ 2 + 2ƞρ , (15) where x represents the depth of neutral axis for the fully cracked section and, ƞ denotes the modular ratio of the modulus of elasticity of the bare bar and concrete. Consequently, the ratio (I2/I1) in Eq. 10 and ( xeq d ) in Eq. 9, depends only on ƞρ and (d D). The moment curvature curve for the uncracked state, fully cracked states and the interpolated curve (as per (Institution, 2004)) has been plotted in Figure 14. The experimental and Eurocode two curve have also been compared. For slab SRC and SRC + 2T (refer, Figures 13A, C), corresponding to 1kNm moment, the experimental and predicted (Eurocode 2) curvatures were found to be equivalent 55 × 10−6 /mm (SRC) and 12 × 10−6 /mm (SRC + 2T). In case of SRC + 1T (refer, Figure 13B), at moment 1kNm, the experimental and predicted curvature are ~11 and 21 (× 10−6 /mm) respectively (Coefficient of variation, COV = 0.4). Therefore, all the three slabs reflect a good correlation between the experimental and the predicted curve. 4 Conclusion In the present study three slabs, reference slab SRC and two textile reinforced slabs having one (SRC + 1T) and two (SRC + 2T) textile layers placed internally with the concrete matrix were tested under four-point flexure machine. The effect of the improved textile reinforced RC slabs has been discussed in terms of load- deflection curve, cracking pattern, failure mode, strain profile, moment curvature relation and toughness with respect to the reference slab. Also, based on the test results, the moment- curvature relation was developed and compared with the predicted curve derived using Eurocode 2. The following conclusions have been summarized below. FIGURE 11 (A) Flexural test of slab (B) Cross-sectional stress and strain distribution. FIGURE 12 Experimentally obtained moment-curvature variation for the slab specimens. FIGURE 13 Moment-curvature relation as per Eurocode 2 (redrawn from (Institution, 2004)). Frontiers in Materials frontiersin.org 09 Abd et al. 10.3389/fmats.2023.1070457
- 10. • The textile reinforcing layer has shown to be effective, especially in terms of increasing cracking load. The load capacity of the textile reinforced slabs at the cracking, yield, and ultimate points was increased by 74%, 68%, and 66%, respectively, in SRC + 1T, and by 190%, 104%, and 103%, respectively, in SRC+2T. • Themid span deflectionsofthetextile-reinforced slabswereenhanced by 64–159% at the cracking point and, deflection at ultimate point were increased by 77–85%. On the other hand, at the yield point, the mid span deflections were approximately at the same level. • The spacing between the two closest cracks in SRC was found to be 30 mm whereas; in case of SRC + 1T and SRC + 2T it was FIGURE. 14 Comparison of experimental and predicted moment-curvature curve for (A) SRC (B) SRC + 1T (C) SRC + 2T. Frontiers in Materials frontiersin.org 10 Abd et al. 10.3389/fmats.2023.1070457
- 11. 20 mm and 10 mm respectively. Also, the widths of the crack were found to be ~0.340 mm, ~0.241 mm and ~0.238 mm respectively. • The addition of textile reinforcement has been confirmed to be efficient by improving the material ductility of SRC + 1T and SRC + 2T slabs by 41% and 44%. Also, the deformability ratio was found to be greater than 4, indicating a ductile failure of textile-reinforced slabs. Moreover, textile reinforcement enhanced the toughness by 210% and 293% respectively compared to SRC. • Based on the obtained load-deflection relation and strain values, moment-curvature curve was developed. A predicted curve based on the formulation of Eurocode two was also evaluated. In all the three slabs a good agreement was exhibited between the experiment and predicted curve. Data availability statement The original contributions presented in the study are included in the article/supplementary material, further inquiries can be directed to the corresponding authors. Author contributions Conceptualization, SS, OH, AI, SA, SQ, HN, YÖ, and MS; methodology, OH, AI, SA, HN, YÖ, MS; software, SS OH, AI, SQ, SA, HN, YÖ, and MS; validation, OH, AI, SS, SA, HN, YÖ, and MS; formal analysis, SS, OH, AI, SA, HN, and MS; investigation, OH, AI, SA, HN, YÖ, and MS; resources, OH, AI, SA, HN, YÖ, and MS; data curation, SS, OH, AI, SA, HN, YÖ, and MS; writing—original draft preparation, OH, AI, and SA; writing—review and editing, OH, AI, SA, HN, YÖ, MS, and SS; visualization, OH, AI, SA, HN, YÖ, MS, and SQ; supervision, AI and SA; project administration, MS; funding acquisition, MS. All authors have read and agreed to the published version of the manuscript. Funding The research is partially funded by the Ministry of Science and Higher Education of the Russian Federation under the strategic academic leadership program ‘Priority 2030’ (Agreement 075-15- 2021-1333 dated 30 September 2021). Acknowledgments The authors extend their thanks to the Ministry of Science and Higher Edu-cation of the Russian Federation for funding this work. Conflict of interest The authors declare that the research was conducted in the absence of any commercial or financial relationships that could be construed as a potential conflict of interest. Publisher’s note All claims expressed in this article are solely those of the authors and do not necessarily represent those of their affiliated organizations, or those of the publisher, the editors and the reviewers. Any product that may be evaluated in this article, or claim that may be made by its manufacturer, is not guaranteed or endorsed by the publisher. References Ahmed, H. U., Mohammed, A. A., Rafiq, S., Mohammed, A. S., Mosavi, A., Sor, N. H., et al. (2021). Compressive strength of sustainable geopolymer concrete composites: A state-of-the-art review. Sustainability 13, 13502. doi:10.3390/su132413502 Akeed, M. H., Qaidi, S., Ahmed, H. U., Faraj, R. H., Mohammed, A. S., Emad, W., et al. (2022). Ultra-high-performance fiber-reinforced concrete. Part IV: Durability properties, cost assessment, applications, and challenges. Case Stud. Constr. Mater. 17, 1271. doi:10. 1016/j.cscm.2022.e01271 Al-Tayeb, M. M., Aisheh, Y. I. A., Qaidi, S. M. A., and Tayeh, B. A. (2022). Experimental and simulation study on the impact resistance of concrete to replace high amounts of fine aggregate with plastic waste. Case Stud. Constr. Mater. 17, 1324. doi:10.1016/j.cscm.2022.e01324 Aljazaeri Zena, R. (2018). Flexure performance of RC one-way slabs strengthened with composite materials. American Society of Civil Engineers. Virginia, USA, Almeshal, I., Al-Tayeb, M. M., Qaidi, S. M. A., Abu Bakar, B. H., and Tayeh, B. A. (2022). Mechanical properties of eco-friendly cements-based glass powder in aggressive medium. Mater. Today Proc. 58, 1582–1587. doi:10.1016/j.matpr.2022.03.613 Althoey,F.,Hakeem,I.Y.,Hosen,M.A.,Qaidi,S.,Isleem,H.F.,Hadidi,H.,etal.(2022).Behavior of concrete reinforced with date palm fibers. Materials 15, 7923. doi:10.3390/ma15227923 American Society for Testing and Materials (ASTM) (2000). Standard specification for deformed and plain billet-steel bars for concrete reinforcement. ASTM, Pennsylvania, PA, USA. Association, C. S. (2012). Design and construction of building structures with fibre- reinforced polymers. Toronto, Canada: Canadian Standards Association. Bencardino, F., and Nisticò, M. (2022). Evaluation of the maximum strain for different steel- FRCM systems in RC beams strengthened in flexure. Fibers 10, 67. doi:10.3390/fib10080067 Carneiro, J., Jalali, S., Teixeira, V., and Tomas, M. (2005). The effect of concrete strength and reinforcement on toughness of reinforced concrete beams. Constr. Build. Mater. 19, 493–499. doi:10.1016/j.conbuildmat.2005.01.008 Çelik, A. İ., Özkılıç, Y. O., Zeybek, Ö., Karalar, M., Qaidi, S., Ahmad, J., et al. (2022). Mechanical behavior of crushed waste glass as replacement of aggregates. Materials 15, 8093. doi:10.3390/ma15228093 Designation, A. (1996)., 4. Pennsylvania, PA, USA: Annual Book of ASTM Standards, American Society for Testing and Material, 1–4.C496-96 Stand. Specif. splitting tensile strength Cylind. Concr. specimens. Dong, Z., Dai, J., Deng, M., and Wu, Z. (2022). Experimental study on the mechanical properties of textile reinforced mortar (TRM) composites with different yarn shapes subjected to uniaxial tension. Archives Civ. Mech. Eng. 22, 185. doi:10.1007/s43452-022- 00494-6 Dong, Z., Deng, M., Dai, J., and Song, S. (2021). Flexural strengthening of RC slabs using textile reinforced mortar improved with short PVA fibers. Constr. Build. Mater. 304, 124613. doi:10.1016/j.conbuildmat.2021.124613 Ebead, U., El Refai, A., Shrestha, K., and Nanni, A. (2019). Soffit and U-Wrap fabric- reinforced cementitious matrix strengthening for reinforced concrete beams. ACI Struct. J. 116, 267–278. Elsanadedy, H. M., Almusallam, T. H., Alsayed, S. H., and Al-Salloum, Y. A. (2013). Flexural strengthening of RC beams using textile reinforced mortar–Experimental and numerical study. Compos. Struct. 97, 40–55. doi:10.1016/j.compstruct.2012. 09.053 Emad, W., Mohammed, A. S., Bras, A., Asteris, P. G., Kurda, R., Muhammed, Z., et al. (2022). Metamodel techniques to estimate the compressive strength of UHPFRC using various mix proportions and a high range of curing temperatures. Constr. Build. Mater. 349, 128737. doi:10.1016/j.conbuildmat.2022.128737 Faraj, R. H., Ahmed, H. U., Rafiq, S., Sor, N. H., Ibrahim, D. F., and Qaidi, S. M. A. (2022). Performance of self-compacting mortars modified with nanoparticles: A systematic review and modeling. Clean. Mater. 4, 100086. doi:10.1016/j.clema.2022. 100086 Frontiers in Materials frontiersin.org 11 Abd et al. 10.3389/fmats.2023.1070457
- 12. Hussein, O. H., Ibrahim, A. M., Abd, S. M., Najm, H. M., Shamim, S., and Sabri, M. M. S. (2022). Hybrid effect of steel bars and PAN textile reinforcement on ductility of one-way slab subjected to bending. Molecules 27, 5208. doi:10.3390/ molecules27165208 Ibrahim, A. M., Abd, S. M., Hussein, O. H., Tayeh, B. A., Najm, H. M., and Qaidi, S. (2022). Influence of adding short carbon fibers on the flexural behavior of textile- reinforced concrete one-way slab. Case Stud. Constr. Mater. 17, 1601. doi:10.1016/j. cscm.2022.e01601 Institution, B. S. (2004). Eurocode 2: Design of concrete structures: Part 1-1: General rules and rules for buildings. London, UK: British Standards Institution. Koutas, L. N., and Bournas, D. A. (2017). Flexural strengthening of two-way RC slabs with textile-reinforced mortar: Experimental investigation and design equations. J. Compos. Constr. 21, 4016065. doi:10.1061/(asce)cc.1943-5614.0000713 Liu, T., Gao, Y., Gao, X., Yao, Y., Lu, Y., and Fan, W. (2023). A systematic investigation for mode-I fracture properties of stitched composites. Int. J. Mech. Sci. 241, 107982. doi:10. 1016/j.ijmecsci.2022.107982 Loreto, G., Babaeidarabad, S., Leardini, L., and Nanni, A. (2015). RC beams shear- strengthened with fabric-reinforced-cementitious-matrix (FRCM) composite. Int. J. Adv. Struct. Eng. (IJASE) 7, 341–352. doi:10.1007/s40091-015-0102-9 Loreto, G., Leardini, L., Arboleda, D., and Nanni, A. (2014). Performance of RC slab- type elements strengthened with fabric-reinforced cementitious-matrix composites. J. Compos. Constr. 18, 4013003. doi:10.1061/(asce)cc.1943-5614.0000415 Ombres, L. (2011). Flexural analysis of reinforced concrete beams strengthened with a cement based high strength composite material. Compos. Struct. 94, 143–155. doi:10.1016/ j.compstruct.2011.07.008 Orosz, K., Blanksvärd, T., Täljsten, B., and Fischer, G. (2010). From material level to structural use of mineral-based composites—An overview. Adv. Civ. Eng. 2010, 1–19. doi:10.1155/2010/985843 Papanicolaou, C., Triantafillou, T., Papantoniou, I., and Balioukos, C. (2009). Strengthening of two-way reinforced concrete slabs with textile reinforced mortars. Dresden Germany: TRM). Qaidi, S. M. A., Dinkha, Y. Z., Haido, J. H., Ali, M. H., and Tayeh, B. A. (2021). Engineering properties of sustainable green concrete incorporating eco-friendly aggregate of crumb rubber: A review. J. Clean. Prod. 324, 129251. doi:10.1016/j. jclepro.2021.129251 Qaidi, S. M. A., Mohammed, A. S., Ahmed, H. U., Faraj, R. H., Emad, W., Tayeh, B. A., et al. (2022d). Rubberized geopolymer composites: A comprehensive review. Ceram. Int. 48, 24234–24259. doi:10.1016/j.ceramint.2022.06.123 Qaidi, S. M. A., Sulaiman Atrushi, D., Mohammed, A. S., Unis Ahmed, H., Faraj, R. H., Emad, W., et al. (2022e). Ultra-high-performance geopolymer concrete: A review. Constr. Build. Mater. 346, 128495. doi:10.1016/j.conbuildmat.2022.128495 Qaidi, S. M. A., Tayeh, B. A., Ahmed, H. U., and Emad, W. (2022f). A review of the sustainable utilisation of red mud and fly ash for the production of geopolymer composites. Constr. Build. Mater. 350, 128892. doi:10.1016/j.conbuildmat.2022. 128892 Qaidi, S. M. A., Tayeh, B. A., Isleem, H. F., De Azevedo, A. R. G., Ahmed, H. U., and Emad, W. (2022g). Sustainable utilization of red mud waste (bauxite residue) and slag for the production of geopolymer composites: A review. Case Stud. Constr. Mater. 16, 994. doi:10.1016/j.cscm.2022.e00994 Qaidi, S., Najm, H. M., Abed, S. M., Ahmed, H. U., Al Dughaishi, H., Al Lawati, J., et al. (2022a). Fly ash-based geopolymer composites: A review of the compressive strength and microstructure analysis. Materials 15, 7098. doi:10.3390/ma15207098 Qaidi, S., Najm, H. M., Abed, S. M., Özkılıç, Y. O., Al Dughaishi, H., Alosta, M., et al. (2022b). Concrete containing waste glass as an environmentally friendly aggregate: A review on fresh and mechanical characteristics. Materials 15, 6222. doi:10.3390/ma15186222 Qaidi, S., Yahia, A., Tayeh, B. A., Unis, H., Faraj, R., and Mohammed, A. (2022c). 3D printed geopolymer composites: A review. Mater. Today Sustain. 20, 100240. doi:10.1016/ j.mtsust.2022.100240 Sadrolodabaee, P., Claramunt, J., Ardanuy, M., and De La Fuente, A. (2023). Effect of accelerated aging and silica fume addition on the mechanical and microstructural properties of hybrid textile waste-flax fabric-reinforced cement composites. Cem. Concr. Compos. 135, 104829. doi:10.1016/j.cemconcomp.2022.104829 Saeed, A., Najm, H. M., Hassan, A., Qaidi, S., Sabri, M. M. S., and Mashaan, N. S. (2022a). A comprehensive study on the effect of regular and staggered openings on the seismic performance of shear walls. Buildings 12, 1293. doi:10.3390/ buildings12091293 Saeed, A., Najm, H. M., Hassan, A., Sabri, M. M. S., Qaidi, S., Mashaan, N. S., et al. (2022b). Properties and applications of geopolymer composites: A review study of mechanical and microstructural properties. Materials 15, 8250. doi:10.3390/ ma15228250 Schladitz, F., Frenzel, M., Ehlig, D., and Curbach, M. (2012). Bending load capacity of reinforced concrete slabs strengthened with textile reinforced concrete. Eng. Struct. 40, 317–326. doi:10.1016/j.engstruct.2012.02.029 Specification, I. (1984a). Aggregates from natural sources for concrete and construction. Baghdad, Iraq: Central Organization for Standardization and Quality Control COSQC. Specification, I. S. (1984b). Portland cement. Baghdad, Iraq: Central Organization for Standardization and Quality Control COSQC. Taerwe, L., and Matthys, S. (2013). Fib model code for concrete structures 2010. Ernst and Sohn, Wiley. New Jersey, NJ, USA. Tayeh, B. A., Akeed, M. H., Qaidi, S., and Bakar, B. H. A. (2022). Influence of the proportion of materials on the rheology and mechanical strength of ultrahigh- performance concrete. Case Stud. Constr. Mater. 17, 1433. doi:10.1016/j.cscm. 2022.e01433 Torres, L., Barris, C., Kaklauskas, G., and Gribniak, V. (2015). Modelling of tension- stiffening in bending RC elements based on equivalent stiffness of the rebar. Struct. Eng. Mech. 53, 997–1016. doi:10.12989/sem.2015.53.5.997 Unis Ahmed, H., Mahmood, L. J., Muhammad, M. A., Faraj, R. H., Qaidi, S. M. A., Hamah Sor, N., et al. (2022). Geopolymer concrete as a cleaner construction material: An overview on materials and structural performances. Clean. Mater. 5, 100111. doi:10.1016/j. clema.2022.100111 Williams Portal, N., Nyholm Thrane, L., and Lundgren, K. (2017). Flexural behaviour of textile reinforced concrete composites: Experimental and numerical evaluation. Mater. Struct. 50, 4–14. doi:10.1617/s11527-016-0882-9 Xie, J., Guo, Z., Shao, M., Zhu, W., Jiao, W., Yang, Z., et al. (2022). Mechanics of textiles used as composite preforms: a review. Composite Structures, 116401. 304, doi:10.1016/j. compstruct.2022.116401 Yang, J., Guo, Y., Shen, A., Chen, Z., Qin, X., and Zhao, M. (2019). Research on drying shrinkage deformation and cracking risk of pavement concrete internally cured by SAPs. Constr. Build. Mater. 227, 116705. doi:10.1016/j.conbuildmat.2019. 116705 Yin, S., Xu, S., and Lv, H. (2014). Flexural behavior of reinforced concrete beams with TRC tension zone cover. J. Mater. Civ. Eng. 26, 320–330. doi:10.1061/(asce)mt.1943-5533. 0000811 Zeybek, Ö., Özkılıç, Y. O., Karalar, M., Çelik, A. İ., Qaidi, S., Ahmad, J., et al. (2022). Influence of replacing cement with waste glass on mechanical properties of concrete. Materials 15, 7513. doi:10.3390/ma15217513 Zhang, H. Y., Liu, H. Y., Kodur, V., Li, M. Y., and Zhou, Y. (2022). Flexural behavior of concrete slabs strengthened with textile reinforced geopolymer mortar. Compos. Struct. 284, 115220. doi:10.1016/j.compstruct.2022.115220 Frontiers in Materials frontiersin.org 12 Abd et al. 10.3389/fmats.2023.1070457
- 13. Appendix TABLE A1 Results of the present experimental test and its comparison with existing literature studies. References Slab dimension (mm) Loading type Compressive strength of cement matrix (MPa) Steel bars Textile reinforcement layers Pcr (kN) Δcr (mm) Py (kN) Δy (mm) Pu (kN) Δu (mm) Ductility ratio Γ) Diameter (mm) Yield strength (MPa) Type Ultimate strength (MPa) Laying position Number of layers 1 2 3 4 5 6 7 8 9 10 11 12 13 14 15 16 17 Present Study (1500 × 150 × 50) 4-point 51.0 4.45 390 - - - 0 (SRC) 1.2 0.8 4.2 15.2 5.5 26.1 1.71 PAN (Polyacrylonitrile) based carbon textile 3530 Internal 1 (SRC+1T) 2.09 1.31 7.05 19.17 9.13 46.30 2.41 2 (SRC+2T) 3.48 2.07 8.55 19.63 11.17 48.28 2.46 Dong et al. (2021) 2000 × 500 × 100 4-point 35.8 8 432 Carbon textile 3600 External 1 11.8 0.9 30.3 10.4 39.1 24.7 1.29 Aljazaeri Zena (2018) (2286 × 457 × 152) 4-point 38.0 10 482 Polyparaphenylene benzobisoxazole (PBO) fabric 5,800 External 1 - - 49.0 10.0 85.0 59.0 1.73 2 - - 49.0 9.7 89.0 41.0 1.82 Carbon-fiber grid with a polymer coating 496 External 1 - - 53.0 12.0 67.0 20.0 1.26 2 - - 53.0 8.5 85.0 23.0 1.60 Steel-reinforced polymer 2,482 External 1 - - 53.0 11.0 89.0 45.0 1.68 2 - - 49.0 10.0 98.0 53.0 2.00 Loreto et al. (2014) (1892 × 305 × 152) 3-point 45.5 9.5 414 Polyparaphenylene benzobisoxazole (PBO) fabric 1,058 External 1 - - - - 42.0 21.81 - Schladitz et al. (2012) (7000 × 1000 × 230) 4-point 40.0 12 574 Polymer-coated fabric made of carbon roving (SIGRAFIL C30 T050 EPY) - Internal 1 - - - - 58.0 223.0 - 2 - - - - 96.0 229.0 - Frontiers in Materials frontiersin.org 13 Abd et al. 10.3389/fmats.2023.1070457