An Analytical Study On The Publication Pattern And Impact Of Top Research Papers A Case Study Of Information Processing And Management
•
0 likes•3 views

Custom Writing Service http://HelpWriting.net/An-Analytical-Study-On-The-Publication- 👈

Recommended
Recommended
More Related Content
Similar to An Analytical Study On The Publication Pattern And Impact Of Top Research Papers A Case Study Of Information Processing And Management
Similar to An Analytical Study On The Publication Pattern And Impact Of Top Research Papers A Case Study Of Information Processing And Management (20)
More from Sara Alvarez
More from Sara Alvarez (20)
Recently uploaded
Recently uploaded (20)
An Analytical Study On The Publication Pattern And Impact Of Top Research Papers A Case Study Of Information Processing And Management
- 1. University of Nebraska - Lincoln DigitalCommons@University of Nebraska - Lincoln Library Philosophy and Practice (e-journal) Libraries at University of Nebraska-Lincoln 10-17-2018 An Analytical Study on the Publication Pattern and Impact of Top Research Papers: A Case Study of Information Processing and Management Jyotshna Sahoo Sambalpur University Basudev Mohanty Institute of Physics, Bhubaneswar, basudev_mohanty@rediffmail.com Ipsita Dash Mayurbhanj Law College Follow this and additional works at: http://digitalcommons.unl.edu/libphilprac Part of the Library and Information Science Commons Sahoo, Jyotshna; Mohanty, Basudev; and Dash, Ipsita, "An Analytical Study on the Publication Pattern and Impact of Top Research Papers: A Case Study of Information Processing and Management" (2018). Library Philosophy and Practice (e-journal). 2090. http://digitalcommons.unl.edu/libphilprac/2090
- 2. An Analytical Study on the Publication Pattern and Impact of Top Research Papers: A Case Study of Information Processing and Management Dr. Jyotshna Sahoo a a Associate Professor & Head, Department of Library and Information Science, Khallikote University University, Berhampur - 760001, Odisha, India. Dr. Basudev Mohanty b, c, * b Scientific Officer, Institute of Physics, Bhubaneswar-751005, Odisha, India. c Homi Bhabha National Institute, BARC Training School Complex, Anushakti Nagar, Mumbai- 400085, India. * Corresponding Author. E-mail: Basudev_mohanty@rediffmail.com, Ph: 7064419608 Ms. Ipsita Dash d d Mayurbhanj Law College, University Road, Baripada, Mayurbhanj-757001, Odisha, India. Abstract: Measuring the research quality of academics to assess the performance of departments, research institutes, universities or even the researchers by themselves is a trend now across the globe. Quality is a journey which can only be judged through the scholarly communications produced, especially papers published in journals. However, assessing the quality of individual papers by peer review is not trouble-free and sometimes leads to disagreement too. Partly for these reasons, the quality of the journal that the paper is published in is widely taken into consideration for the quality of the paper itself. The present study explores the publication pattern of scholarly articles of the Journal “Information Processing and Management,” a leading international journal published by Elsevier and indexed under Science Direct Database. It examines and presents an analysis of 550 articles (under Top25 hottest article of Science Direct) cited within the period from 2008 to 2013.The scholarly articles are analyzed from several bibliometric parameters such as the chronological distribution, authorship pattern and degree of collaboration, most prolific authors, country and institution-wise distribution, subject-wise distribution of articles, most downloaded and cited, the length of articles. Lotka’s law is also applied to examine authors’ productivity pattern and productivity index. Results indicated that a high level of collaboration exists among the authors, Information Science taking shape of a developing discipline within LIS and USA occupies the dominant position in terms of productive authors, institutions and country. A positive and significant relationship lies between the T25HA and the number of citations received. Keywords: Authorship Pattern; Lotka’s Law; Productivity Index; Citation; Degree of Collaboration; Top 25 hottest article (T25HA); Bibliometrics.
- 3. 1. Introduction Journals have occupied a significant position in the scholarly communication system. Though with the passage of time, the mode of delivery of scholarly communication has changed from oral to the written and then from print to electronic, the importance of journals has remained unchanged and unaffected. Library and information science (LIS) journals are one of the primary resources for communication that allows professionals in the field to exchange new ideas and to put forth their views on future developments in librarianship. With the recent advances in information technology, more and more LIS journals are appearing in electronic form alongside print form facilitating access to all categories of users. These LIS journals play an important role both in LIS education and in the development of librarianship practice. Journal articles are accorded greater prestige and merit within the scholarly community, relative to other forms of disseminating research findings. As such, analysis of such research articles has attracted the attention of the academic community in almost all fields of knowledge. It is pointed out by (Anyi, Zainab & Anuar, 2002) that, “when a single journal is studied bibliometrically, it creates a portrait of the journal, providing a description that offers an insight that is beyond the superficial. It can indicate the quality, maturity, and productivity of the journal in any field, in a country or region. It also informs us about the research orientation that it supports to disseminate. The journal being studied is regarded as important or significant in the field, important enough to be studied, to make inferences that the journal speaks for authors who publish in the field and somehow reflect the activity of research in the field. The journal being studied is often assessed on its quality characteristics, the degree of impact it achieves in a field, its ability to diffuse knowledge, the authorship and collaboration pattern it projects in the field, its national or international standing”. Taking insight from such kinds of single journal analysis, the present study examines the publication pattern of Top 25 hottest articles (T25-HA) published in the journal “Information Processing and Management” during the period 2008-2013. 2. Literature Review Bibliometric study of single journals covering a period of time is a favoured topic of research for the scholarly community not only in LIS field but also in other academic disciplines. An increased demand is perceived within many academic communities for bibliometric analysis in the evaluation of research productivity. The number of publications using the bibliometric analysis as a tool has been rising steadily during recent years. Review of Literature for the present study covers publications on single journal bibliometric analysis in Library & Information
- 4. Science, bibliometric analysis in several other disciplines, works on relationship between article download and citations as well as works on impact and quality of articles, impact of multi- authored works, institutional research productivity etc. The LIS journals of international nature studied bibliometrically are: Journal of the American Society for Information Science and Technology, (Tsay, 2008); Journal of Documentation (Tsay & Shu, 2011; Roy & Basak, 2013); Malaysian Journal of Library And Information Science (Tiew, Abdullah & Kaur, 2001; Bakri & Willett, 2008; Maharana & Das, 2013) ; African Journal of Library, Archives and Information Science (Tella & Olabooye, 2014); Internet Research (Swain, 2013); JASIST, IPM, JOD (Tsay, 2011); Journal of Information Science (Tsay, 2011); Library Trends (Das, 2013); Library Philosophy and Practice (Thanuskodi, 2010; Verma, Sonker & Gupta, 2015); Library Review (Swain, Swain & Rautaray, 2013); Reference Services Review (Mahraj, 2012; Clark, 2016); The Electronic Library (Negi, 2017). The journals of national nature are: Library Herald (Thanuskodi, 2011; Kumar, 2014); IASLIC Bulletin (Panda, Mohanty & Sahoo, 2011); Pakistan Journal of Library and Information Science (Warraich & Ahmad, 2011). DESIDOC Journal of Library and Information Technology (Kumar & Moorthy, 2011; Pandita, 2014; Bapte, 2017); International Research: Journal of Library and Information Science (Shukla, Moyon, 2017); and Pearl: A Journal of Library and Information Science (Singh, 2017). 2.1. LIS journals studied Bibliometrically Tiew, Abdullah and Kaur (2002) studied the “Malaysian Journal of Library and Information Science”(MJLIS) covering the period 1996-2000. Bakri and Willett (2008) analysed publication and citation patterns of the journal MJLIS from 2001-2006 and compared the results with those obtained in an earlier study by Tiew, Abdullah and Kaur (2002). Tsay (2008) explored the relationship between “Journal of the American Society for Information Science and Technology” (JASIST) and other disciplines by citation analysis. The results revealed that JASIST itself is the most highly cited journal followed by four LIS journals, namely “Information Processing and Management”, “Journal of Documentation”, “Annual Review of Information Science and Technology” and “Journal of Information Science”. Thanuskodi (2010) did a bibliometric study of 249 articles published during the period from 2005-09 in the journal “Library Philosophy and Practice” and the results revealed that the highest number of articles have appeared in the area of computer application in library and information science. Tsay& Shu (2011) studied the journal bibliometric characteristics of the “Journal of Documentation” (JOD) and the subject relationship with other disciplines by citation analysis. Another study for the same JOD conducted by Roy & Basak (2013) revealed that majority of papers are multi-authored. The
- 5. geographical distribution reveals that the contribution by the United Kingdom is the highest. Tsay (2011) studied the bibliometric characteristics of the “Journal of Information Science” (JIS) and made a citation analysis of the journal to find out the subject relationship of LIS with other disciplines. Publication output, authorship pattern, subject coverage of publications, institutional productivity citation analysis etc. are the different dimensions of bibliometric studies conducted across the LIS journals of national nature. Isiakpona (2012) conducted abibliometric study of “Library & Information Science Research Electronic Journal” and results revealed that, most of the articles were within the general subject area of Library and Information Science and were written by a single author and the majority of the publications were contributed by authors affiliated to universities. Das (2013) conducted a bibliometric study of 206 articles published in the journal “Library Trends” from 2007-2012. Results show that majority of authors preferred to publish their research results in individual authorship mode. Tella & Olabooye (2014) in their study of “African Journal of Library, Archives & Information Science” indicated that the majority of the articles were theoretical papers, while the others were empirical papers, book reviews, and short communications. Verma, Sonker and Gupta (2015) conducted a bibliometric study of the e-journal Library Philosophy and Practice and found that there is a predominance of single authored works and highest number of articles are published on library services. Negi (2017) examined the articles published in the journal “The Electronic Library” during 2007-2016 and explored contribution of Indian authors’ in the journal and found that the authors of India have contributed 101 articles out of 576 articles which are quite appreciative. All the reviewed journals give a vivid account of the publication pattern and research orientation of the respective journals. 2.2. Journals in Other disciplines studied bibliometrically Apart from LIS journals, bibliometric studies conducted in other disciplines for journals like : Journal of Advanced Nursing (Zeleznik, Vosner&Kokol, 2017); Journal of Business Research (Merigó et al.,2015); Computers in Human Behavior (Vosner, et al., 2016); Information Sciences (Yu, et al., 2017) International Journal of Intelligent Systems (Merigo, et al.,2017); International Journal of Mental Health Systems (Minas, et al., 2014); Journal of Mathematical Chemistry (Restrepo & Willett, 2017); and Journal of School Health (Zhang, et al., 2017) Computers & Industrial Engineering (Cancino et al.,2017).While Zeleznik, Vosner &Kokol (2017) identified the most prolific authors, papers, institutions and countries of Journal of Advanced Nursing, Merigó et al.,(2015) highlighted on the publication pattern, citation structure and the most cited articles in the Journal of Business Research, Vosner, et al., (2016) focused on the trends of
- 6. research literature production, the established patterns of cooperation among countries and institutions and the most productive research themes and their evolution through time using VOS viewer software. Yu, et al., (2017) studied the most cited authors, most representative articles, top influential institutions, the co-citation network of knowledge structure and emerging trends of research of INS using CiteSpace, a data visualization software. Using VOS viewer, Merigo, et al., (2017) depicted the bibliographic coupling of authors and co-citation of documents in IJIS. Minas, et al., (2014) studied the geographic reach and international collaboration of the Journal of Mental Health Systems. Restrepo & Willett (2017) focused on the citation impact of the articles and the cognate areas from the citations come from in the journal of Mathematical Chemistry. Zhang et al. (2017) highlighted on the cooperation network of high frequency authors using CiteSpace. Cancino et al., (2017) identified the leading trends of the journal Computers & Industrial Engineering (CIE) in terms of impact, topics, universities and countries and made graphical analysis citation connections in terms of bibliographic coupling, co-citation, citation, coauthorship and co-occurrence of keywords using VOS viewer software. 2.3. Studies on article download and citations Davis et al. (2008) measured the effect of free access to the scientific literature on article downloads and citations and revealed that open access articles had more downloads but exhibited no increase in citations in the year after publication. Open access publishing may reach more readers than subscription access publishing but the citation advantage of open access may be an artefact of other explanations such as self selection. Jahandideh (2007) in his study on prediction of future citations of a research paper from number of its internet downloads found out that, more citations have been done to hottest articles at the same period compared to non-hottest articles. The study investigated that more downloads at a limited period of time is an indicator of more citations to the article in long term interval. Singson, Thiyagarajan and Leeladharan(2016)examined the relationship between electronic journal downloads to find out whether online electronic resource usage can be adopted as an alternative to citation for evaluation of scholarly discourse. Results revealed that Journal IF and price significantly influence usage and journal IF plays an important role in the intensity of the use. 2.4. Works on measuring impact of articles, authors and institutions Li et al. (2017) developed a framework of 17 article level indicators and basing upon these indicators conducted an experiment to rank Chinese institutions in the field of Information Management. The findings revealed that among the article count indicators, the Straight count
- 7. indicator is significantly different than others and the rankings based on the indicators which are weighted by quality are consistent with those based on the indicators using article count. Levitt and Thelwall (2011) developed a new hybrid indicator known as weighted sum indicator to predict the impact of articles. This new indicator is the weighted sum of two indicators in common usage that is the article’s total number of citations in a citation window, and the Impact Factor of the journal in which the article was published. The results show that for citation windows of 0 or 1 years, the correlation of the simplified weighted sum with long-term citation is substantially higher than the correlation of the standard indicator of article citation with long- term citation. Fiala (2012) measured country shares in publications indexed by CiteSeer and compared them to those based on mainstream bibliographic data from the Web of Science and Scopus using several non-recursive as well as recursive methods such as citation counts or PageRank. The author concluded that even if East Asian countries are underrepresented in CiteSeer, its data may well be used along with other conventional bibliographic databases for comparing the computer science research productivity and performance of countries. Suárez- Balseiro, García-Zorita and Sanz-Casado (2009) used multi-dimensional indicators and multivariate analysis techniques, to analyze and represent the visibility of the papers published in mainstream scientific journals. The results of the study show that the establishment and furtherance of local and international co-authorship favour the visibility of the papers. 3. Data and Method: The study is based upon 550 research articles published in the journal “Information Processing and Management (IP&M). IP&M is a leading international journal published by Elsevier and cited under Science Direct Database. This journal is devoted to reporting of basic and applied research in information science, computer science, cognitive science, management of information resources, services, systems and networks and digital libraries. The Cite Score of the journal is: 2.83 and the impact factor is 2.391. While Cite Score values are based on citation counts in a given year (e.g. 2014) to documents published in three previous calendar years (e.g. 2011 – 13), divided by the number of documents in these three previous years (e.g. 2011 – 13), impact factor of a journal is calculated by dividing the number of current year citations to the source items published in that journal during the previous two years. All the 550 articles are indexed under Science Direct database under its Top 25 hottest articles (T25-HA) category from 2008-2013(April-June) for the journal IP&M. The top 25 is a free quarterly service which provides lists of most read articles counted by article downloads on Science Direct and as a result it cites 100 hottest papers in a year. For all the 550 papers included in the study during the above
- 8. period, a database was developed incorporating essential fields viz. title of the article, year of publication, number of authors, name of authors with institutional and geographical affiliation of the authors, number of citations received to the articles, length of articles using the MS-Excel spreadsheet. Finally subsequent analysis and interpretation of the data is done as per the research questions. 4. Research Questions (RQ): RQ 1: How are the 550 hottest articles of IP&M distributed over time? RQ 2: What are the general characteristics of the authorship pattern of IP&M publications? Is there any relationship between mean authorship and degree of collaboration of IP&M literature? RQ 3: Does the productivity of authors’ conform to the Lotka’s law? RQ 4: How does productivity index help to classify the level of productions in IP&M literature with regard to the Lotka’s classical method? RQ 5: Who are the authors whose works are most read and downloaded among others? Is there any reasonableness for such high downloads with LIS research areas? RQ 6: Which countries have made a significant impact with respect to the different level of contributions on the IP&M publications? RQ 7: Which institutions have a visible impact as regards to IP&M publications? RQ 8: What subject areas do these Top 25-Hottest Articles (T25-HA) focus on in terms of most preferred research areas of IP&M? RQ 9: What are the works that have downloaded more times and on which research areas of IP&M? RQ 10: What is the preferred range of IP&M publications on the basis of pagination pattern? RQ 11: What are the works that have fetched more citations than other articles in IP&M? 5. Results and Discussion: RQ-1: How do the 550 hottest articles are distributed over time? Table 1: Chronological Distribution of Top 25 Hottest Article (T25-HA) of IP&M Publications Sl. No. Year of publication T25-HA of IP&M % Cumulative No. 1 1992 -1999 20 3.64 20 2 2000- 2006 129 23.46 149 3 2006- 2013 401 72.90 550 Total 550 100 To address the RQ-1, the chronological distribution of the 550 top research papers is derived on
- 9. the basis of year of publication of each article. It is to be noted here that, all the 550 articles which are cited under the top-25 category for each quarter in a year during the period from 2008 to 2013 were originally published during the time period from 1992 to 2013. Out of the total 550 T25- HA category, the highest number of articles (401, 72.90%) are published during the period from 2006-2013 followed by the time span from 2000-2006 (129, 23.46%) and 1992-1999(20, 3.64%) respectively. As T25-HA category is determined on the basis of articles downloaded, it is clearly reflected that users have referred articles of recent publications mostly published from 2000 onwards. So it is interpreted that, users have taken much interest in currently published research works. RQ-2: what are the general characteristics of the authorship pattern of IP&M publications? Is there any relationship between mean authorship and degree of collaboration of IP&M literature? Table 2: Authorship pattern and degree of collaboration Year Single Author Papers Multi- Author Papers No. of Papers (RP) Total Authorship (TA) Mean Authorship Degree of Collaboration 1992 to 1999 11 9 20 34 1.7 0.45 2000-2006 53 76 129 283 2.2 0.59 2006-2013 88 313 401 976 2.4 0.78 Total 152 (27.63%) 398 (72.37%) 550 1293 2.4 0.72 Table - 2 deals with authorship pattern and collaboration among authors for the 550 articles published in the journal IP&M that meets the RQ-2. It is observed that the total 550 numbers of T25-HA are contributed by 1293 numbers of authors which brings the average number of authors per paper is 2.4. Out of 550 papers, 152(27.63%) numbers of papers are contributed by single authors, and 398(72.37%) numbers of papers are by multiple authors. A steady increase in the mean authorship (from 2.2 to 2.4) as well as in the collaboration pattern of authors (from 0.45 to 0.78) is clearly reflected during the period of study. The degree of collaboration (DC) among authors is found to be 0.72 (398/ (398+152)) which is calculated using Subramanian’s formula (Subramanian, 1983). The high value of DC (0.72) indicates that multi-authored contributions occupy the prominent position that means collaborative research work has dominance over sole authorship works in IP& M. Thus, it can be stated that there is a directly proportional relationship between these two bibliometric parameters i.e. higher the values of collaborative co-efficient exhibit high values of mean authorships and vice versa.
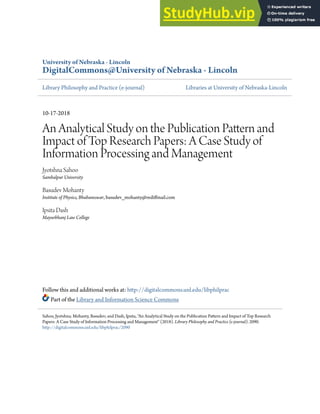
- 10. Figure 1: Mean Authorship and degree of collaboration of T25-HA RQ-3: Does the productivity of authors’ conform to the Lotka’s law? The RQ-3 is to assess the productivity of authors of IP&M publications for which Lotka's Law has been applied to the category of T25-HA. Lotka's Law (1926) describes the frequency of publications by authors in any given field. The general formula of Lotka's Law is: Xn Y = C = > n = 𝑳𝒐𝒈 𝑪 – 𝑳𝒐𝒈 𝒀 𝑳𝒐𝒈 𝑿 Where, X = Number of publications (1, 2, 3 ……, n) Y = Relative frequency of authors with X publications C = Constant which is equal to number of contributors with minimal Productivity n = Parameter “n” can be calculated by the least square method Measuring of author productivity is a vital part of the metric study which is induced for IP&M papers and presented in table 3 using Lotka’s derivation. It is observed that 190 numbers of authors out of 393 have contributed single paper each and its proportion is 48.35% which gives the value of Constant(C) that is equal to number of contributors with minimal Productivity. Table 3 gives the value of “n” using the above equation and the mean value of “n” is found to be 1.87. Using the value of Parameter “n” (1.87), the estimated frequencies of authors are calculated and presented in table 3. Figure – 2 illustrates the variation of observed and estimated authors’ percentile with their contributions. 1.70 2.19 2.43 2.35 0.45 0.59 0.78 0.72 Up to 1999 2000-2006 2006-2013 IP&M Mean Authorship Degree of Collaboration
- 11. Figure 2: Trend of Observed v/s Estimated Authors with their contributions Table 4: Kolmogorov-Smirnov (K-S) Goodness-of-fit test No. of contributions Observed Authors Estimated Authors Deviation Dmax No. Cumulative Frequency Relative Frequency { Sn(x) } No. Cumulative Frequency Relative Frequency { Fo(x) } D=Fo(x)- Sn(x) Max of |Fo(x)- Sn(x) | 1 190 190 0.5322 190 190 0.5793 0.0471 0.0509 2 89 279 0.7815 57 247 0.7527 -0.0288 3 33 312 0.8739 28 275 0.8383 -0.0356 4 24 336 0.9412 17 292 0.8902 -0.0509 5 12 348 0.9748 12 304 0.9255 -0.0493 6 3 351 0.9832 8 312 0.9511 -0.0321 7 3 354 0.9916 6 318 0.9707 -0.0209 8 2 356 0.9972 5 323 0.9862 -0.0110 9 1 357 1.0000 4 328 0.9989 -0.0011 Total 357 328 K-S statistics = 1.63/SQRT(n) --- > 0.0863 In order to test the applicability of Lotka’s law to a set of data, a statistical test (goodness-of-fit) is needed. The K-S (Kolmogorov-Smirnov) test determines the maximum deviation (D) as under: D = Max | Fo(x) - Sn(x) | where, Fo(X) ~ is the theoretical cumulative frequency function and Sn(X) ~ is the observed cumulative frequency function At a 0.01 level of significance, the K-S statistic is equal to 1.63/√n. If D is greater than the K-S statistic, then the sample distribution does not fit the theoretical distribution. As shown in table 4, D from the IP&M sample data is 0.0509 which is less than the K-S statistic i.e. 1.63/√663 ~ 0 10 20 30 40 50 60 70 1 2 3 4 5 6 7 8 9 10 Percentage of Authors No. of Contributions Applicability of Lotka's Law: Trend of Observed v/s Estimated Authors with their contributions % of Observed Authors % of Estimated Authors Expon. (% of Observed Authors)
- 12. 0.0863. Therefore Lotka’s generalized formula with exponent value “n” (1.87) fits to the IP&M sample. RQ-4: How does productivity index help to classify the level of productions in IP&M literature with regard to the Lotka’s classical method? With regard to the Lotka’s classical method to test the regularity in publication activity of authors as cited above, the index called Productivity Index (PI) (Garcia, 2005; Sevukan, 2007) had been applied to identify the level of productions in IP&M literature. The PI is the logarithm of the values of n publications for each author which helped to find out three classical levels as shown in table - 5. The PI revels that occasional producers (48.35% authors) who published only one paper each (PI = 0)) contribute 14.69% of total IP&M literature, the intermediate producers (42.49% authors) who published 2 – 9 papers (0 < PI < 1) contribute 38.44% of total IP&M literature while larger producers (only 9.16% authors) who published more than 10 papers (PI >= 1) produce 46.87% of total IP&M literature. Table 5: Productivity Index and Level of Contributions of Authors in IP&M Productivity Index (PI) No. of Authors % of Authors % of Contributions Level of contributions PI = 0 (1 article) 190 48.35 14.69 Occasional producers 0 < PI < 1 (2 - 9 articles) 167 42.49 38.44 Intermediate producers PI >= 1 (10 or more articles) 36 9.16 46.87 Larger producers RQ-5: Who are the authors whose works are most read and downloaded among others? Is there any reasonableness for such high downloads with LIS research areas? In order to address the RQ-5, the rank list of the most prolific authors contributed to IP&M publications during the period of study is provided in Table 6. Here the rank lists of prolific authors are derived on the basis of number of times the articles of the authors are downloaded. It is found that Bernard J. Jansen occupies the first rank who has contributed seven unique articles during the study period, but the seven articles all together downloaded 55 times in different quarters. It is seen that number of articles contributed by the authors varies from one (1) to seven (7) and the corresponding download varies from eighteen (18) to fifty-five (55).The ten prolific authors are from five countries viz. USA (6-authors) and one each from the countries of Denmark, Taiwan, UK, and Greece. The H- index of the prolific authors is provided in Table-6 in which a wide variation (from minimum 4 to highest 57) is observed. It is to be noted further
- 13. that Bernard J. Jansen from USA who has highest contributions (7) and highest downloads (55) has also the distinction of highest h-index 57 among the prolific authors. Table 6: Top ten authors on the basis of download of Articles Sl. No. Authors Country Total No. of Downloads No. of Unique Contributions h- index (GS) 1 Bernard J.Jansen USA 55 7 57 2 Birger Hjorland Denmark 22 2 43 3 Hong Iris Xie USA 22 1 24 4 Yuen-Hsian Tseng Taiwan 22 1 19 5 J.Bhogal UK 19 1 4 6 Marcos Andre Goncalves USA 19 1 40 7 Ziming Liu USA 19 1 21 8 Giannis Tsakonas Greece 18 1 9 9 David Robins USA 18 1 - 10 Madhu C. Reddy USA 18 2 26 Total 6 Unique countries 232 (42.18%) 18 In order to assess the reasonableness for such high downloads across the 18 unique contributions of the 10 prolific authors; the research areas dealt are examined. All the eighteen papers focus on relatively new areas of research in LIS like online searching, analysis of search engine transaction logs, analysis of user queries on the web, effectiveness of web search engines, ontology-based query expansion, collaborative information behaviour, text mining, model for digital library, user perception of electronic resources etc. Thus, It can be inferred that as an academic discipline LIS is a developing and expanding field, emerging areas are coming up and users have shown their significant interest in the latest areas of research than the traditional LIS research areas, and there is a significant impact of information technology on the LIS discipline. RQ-6: Which countries have made a significant impact with respect to the different level of contributions on the IP&M publications? Assessment of country and institutional research productivity has a long-standing tradition of research impact analysis. Ranking the institutional research productivity enhances the reputation of an organization or a university and affects its ability to raise funds and reflects the relative position of the institution among others with regard to a specific research interest. Moreover, the volume and impact of academic publications are believed to reflect the nation’s scientific wealth. The rank list of the countries and institutions are derived on the basis of number of downloads done from these institutions affiliated with the names of the first authors of the publications which
- 14. address RQ 5 and 6. It is reflected that T25-HA are contributed from 36 unique countries, whereas the top ten countries contributed highest papers (496) which is (89.81%) of the entire publication. Out of the top ten countries, it is observed that the USA prominently leads the list with 236 (42.9%) number of papers among other top contributing countries followed by UK, Taiwan, and Denmark. These top four countries can be considered as larger producers as contribute around 70% of total hottest papers. Other 6 countries namely Australia, Brazil, Greece, Spain, China, and Canada can be considered as intermediate producers with 20% contributions while rest 26 countries can be considered as occasional producers with only less than 10% of total contributions. Though USA leads among affiliated countries but contributions from other mentioned countries reflect the global character of the IP&M journal. Table 7: Top ten countries of T25-HA Rank Country No. of T25-HA % of T25-HA Level of Contributions 1 USA 236 42.9 Larger Producers (around 70%) 2 UK 75 13.6 3 Taiwan 39 7.1 4 Denmark 37 6.7 5 Australia 23 4.2 Intermediate Producers (around 20%) 5 Brazil 23 4.2 6 Greece 21 3.8 7 Spain 14 2.5 8 China 11 2.1 9 Canada 9 1.6 10 Finland 8 1.5 Other 26 countries 54 9.8 Occasional Producers (around 10%) 36 550 100 RQ-7: Which institutions have a visible impact as regards to IP&M publications? Similarly, as regards to the institutional profile of the T25-HA, there are 7 universities placed in the top 10 categories. School of Information Science and Technology, the Pennsylvania State University of USA leads the other institutions credited with the highest download of articles (63). Adding to this University, three other Universities from USA also occupied rank 3, 5 and 9 respectively (122 downloads affiliated to four universities of USA). The other 6 universities belong to the countries of Denmark, Taiwan, UK, Brazil, Greece and Australia. It is reflected
- 15. that, universities have contributed significantly to IP&M publications and faculties working in universities are more active in research work. Table 8: Top Ten Institutions of T25-HA Sl. No. Name of the Institutes Country No. of Downloads 1 School of Information Science and Technology, Pennsylvania State University. USA 63 2 Royal School of Library and Information Science. Denmark 31 3 University of Wisconsin-Milwaukee USA 22 4 National Taiwan Normal University Taiwan 22 5 School of Library and Information Science, San Jose' State University. USA 19 6 Department of Computing, University of Central England UK 19 7 Department of Computer Science, Federal University of Minas Gerais Brazil 19 8 Ionian University Greece 18 9 Kent State University USA 18 10 University of Technology Sydney Australia 16 RQ-8: What subject areas do these Top 25-Hottest Articles (T25-HA) focus on in terms of most preferred research areas of IP&M? Table 9: Most preferred research areas of IP&M Top 25-Hottest Articles (T25-HA) Sl. No. Subject Total % Preferred Areas 1 Information Needs & Seeking Behaviour 116 21.1 Most preferred areas (3 areas ~ 50%) 2 Information Retrieval 92 16.7 3 Digital library 63 11.5 4 Knowledge Management (KM) 32 5.8 Moderate preferred areas (10 areas ~ 45%) 5 Web search Engine 30 5.5 6 Semantic Web & Web Ontology 30 5.5 7 Text Mining 28 5.1 8 Knowledge Organization 27 4.9 9 Electronic Resources 24 4.4 10 LIS Theory & Practices 23 4.2 11 Social Media & Social Networking 23 4.2 12 Website Design 21 3.8 13 Bibliometrics 15 2.7 14 Information system 10 1.8 Least preferred/ Upcoming areas (8 areas ~ 5%) 15 Sentiment Analysis 3 0.5 ... Others (6 areas) 13 2.4 Total 550 100
- 16. In order to assess the subject areas of T25-HA and to meet the RQ8, all the full-text articles are examined thoroughly. Topic categories are designated out of the patterns emerged from analyzing the content of each and every article. It is found that a wide variety of topics are covered in the journal during the study period. An integration of traditional topics of LIS studied with new perspectives as well as emerging areas of research are seen. All the research themes are classified in order from highest amount of coverage to least to find out most preferred areas. It is observed that works on only a few aspects such as information retrieval, information need of various user groups, digitization, and digital library are the most preferred areas of research as 50% of the articles are focused on these and related areas. Next to it are moderately preferred areas of research which constitute 10 areas that account for 45% of the total research. Under this group some relatively new aspects of LIS discipline such as KM, text mining, web search engine, semantic web and web ontology are discovered. Third category of LIS research includes 8 areas like information system, sentiment analysis, open access, pioneers of online age, digital qualities of humanities research, patent collaboration, literature aggregation, mobile information management etc. As very fewer numbers of research paper focused on these areas, it is designated as least preferred areas of research which account for 5% of the total topic categories. However, many new areas of research like sentiment analysis, emotion recognition, and patent collaboration are found under this category. RQ-9: What are the works that have downloaded more times and focus on which research areas of LIS in IP&M? Table 10: Top Ten Articles of IP&M by Number of times downloaded Sl. Articles No. of times downloaded Rank Authors & Country 1 How are We Searching The World Wide Web? A Comparison of Nine Search Engine Transaction Logs 22 1 Bernard J. Jansen & Amanda Spink (USA) 2 Text Mining Techniques For Patent Analysis 22 1 Yuen-Hsien Tseng, Chi-Jen Lin, Yu-I Lin, (Taiwan) 3 User's Evaluations of Digital Libraries (DLS): Their Criteria, and Their Assessment 22 1 Hong Iris Xie (USA) 4 Library and Information Science: Practice, Theory and Philosophical Basis 20 2 Birger Hjorland (Denmark) 5 A Review of Ontology Based Query Expansion 19 3 J. Bhogal , A. Macfarlane & P. Smith (UK) 6 Exploring Usefulness & Usability in The Evalution of Open Access Digital Libraries 18 3 Giannis Tsakonas, & Christos Papatheodorou (Greece)
- 17. 7 Print VS Electronic Resources: A Study of User Perceptions, Preferences, and use. 19 3 Ziming Liu (USA) 8 What is a Good Digital Library"? A Quality Model For Digital Libraries 19 3 Marcos A. Goncalves & Ba´rbara L. Moreira (Brazil); Edward A. Fox & Layne T. Watson (USA) 9 Aesthetics and Credibility in Website Design 18 4 David Robins, & Jason Holmes (USA) 10 Tagging and Searching: Search Retrieval Effectiveness of Folksonomies on The World Wide Web. 12 5 P. Jason Marrison (USA) The unit of analysis of this paper is T25-HA of IP&M. Out of these 550 articles Table 10 provides the top 10 articles on the basis of maximum download count that addresses the RQ 9. An examination of the contents of the articles reveals these top downloaded works are relatively new areas of research in LIS field and there is a greater impact of the developments of IT, internet and web resources on LIS discipline. These 10 highest downloaded articles are focused towards various aspects of IT and ICT like website design, search engine, digital library, effective information retrieval, e-resources, text mining techniques etc. RQ-10: What is the preferred range of IP&M publications on the basis of pagination pattern? Table 11: Pagination pattern of articles Sl. No. Page Length No. of IP&M articles % 1 1 to 10 56 10.2 2 11 to 20 294 53.5 3 21 to 30 155 28.2 4 31 to 40 45 8.2 Total 550 100 RQ 10 is about the page length of IP&M publications depicted in Table 11. Out of the 550 T25- HA, highest (294) numbers of papers are within 11-20 pages which accounts for 53.5% of the total pagination pattern followed by 155 articles which are within 21-30 pages, 56 articles within the page range of 1-10 pages, and 45 articles within 31-40 pages. The preferred page range of IP&M publications is between 11-20 pages as more than 73% of total papers are within this range. RQ-11: What are the works that have fetched more citations than other articles in IP&M?
- 18. RQ 11 is about the citation pattern of the T25-HA articles. The Scopus citation data for all the 154 unique (together downloaded 550 times) articles are collected, and out of this, 10 most cited papers are reported in Table 12. Such citation analysis is essential for many reasons. It is of significant value to the authors, whose work is accounted among the most cited works; these studies identify the seminal works in the discipline, illustrate the development of the literature over a period of time and map the critical intellectual trends within the field. It helps to determine which issues have been central to the field and identify those individuals who have made significant contributions to the field. All the unique 154 articles have received 12698 citations, whereas the top 10 most cited paper account for 21.6% citations. Eight out of the top ten papers have more than 200 citations, and authors of five papers have affiliations in the United States. Apart from USA top cited papers are from other countries like China, Japan, UK, Denmark and Finland which reflects internationalization of LIS research as regards to IP&M publication. Table 12: Top 10 Highly Cited Articles Sl. Top Ten Articles on the basis of number of Citations received No. of Citations % Authors & Country 1 Real Life, Real Users and Real Needs: A Study and Analysis of User Queries on The Web 808 4.99 Bernard J. Jansen, Amanda Spink, & Tefko Saracevic (USA) 2 A Systematic Analysis of Performance Measures for Classification Tasks 618 3.81 Marina Sokolova, & Guy Lapalme (Canada,USA) 3 How are We Searching The World Wide Web? A Comparison of Nine Search Engine Transaction Logs 454 2.80 Bernard J. Jansen & Amanda Spink (USA) 4 Text Mining Techniques For Patent Analysis 347 2.14 Yuen-Hsien Tseng, Chi- jenLin, & Yu-I Lin (China) 5 A Review of Ontology-Based Query Expansion 240 1.48 J. Bhogal, A. Macfarlane, & P.smith (UK) 6 An Information-Theoretic Perspective of TF-IDF Measures 238 1.47 Akiko Aizawa (Japan) 7 Determining the Information, Navigational and Transaction Intent of Web Queries 237 1.46 Bernard J. Jansen & Danielle L. Booth (USA); Amanda Spink (Australia) 8 The Information-Seeking Practices of Engineer's Searching For Documents as Well as for people 202 1.25 Morten Hertzum & Annelise M. Pejtersen (Denmark) 9 Task Complexity Problem Structure and Information Actions- Integrating Studies on Information Seeking and Retrieval 188 1.16 Pertti Vakkari (Finland) 10 User's Criteria For Relevance Evaluation: a Cross-Situational Comparison 172 1.06 Caroll L. Barry & Linda Schamber (USA) Rest 144 unique titles 12698 78.4 Most of the top ten highly cited articles are oriented towards studying and analyzing web queries, web search engines. While traditional topics like information seeking behavior, information
- 19. retrieval, and classification are of interest to the academia but these topics are studied from new perspectives. 6. Conclusion Libraries as a purveyor of knowledge ventured early into the field of ICT for delivering information services to its users and the LIS research too not far lagging behind the trend. It is quite encouraging that LIS as an academic discipline shows a developmental trend with multiple new areas of research and the scholarly community are inquisitive to keep themselves abreast of the latest developments in the field. In this study, the publication pattern of Top 25 hottest articles (T25-HA) published in the journal Information Processing and Management, as well as the value of various bibliometrics indicators derived, shows the popularity, the quality as well as the impact of IP&M publications in LIS literature. This subject analysis of T25-HA on the basis of top downloads and citation received provides an insight into the development of LIS discipline during the period covered and indicates the subject trends and significant issues dealt through IP&M publications. These indicators, not only helps editorial boards to re-evaluate their journal but also to the researchers, librarians and academic administrators to identify their core journals. References: 1. Anyi K. W. U., Zainab A. N., & Anuar N. B. (2009). Bibliometric studies on single journals: a review. Malaysian Journal of Library & Information Science, 14(1), 17-55. 2. Bakri, A., & Willett, P. (2008). The Malaysian Journal of Library & Information Science 2001-2006: A Bibliometric Study. Malaysian Journal of Library & Information Science, 13(1), 103-116 3. Bapte, V. D. (2017). DESIDOC Journal of Library and Information Technology (DJLIT): A Bibliometric Analysis of Cited References. DESIDOC Journal of Library & Information Technology, 37(4), 264–269. https://doi.org/10.14429/djlit.37.4.10712 4. Cancino, C., Merigó, J. M., Coronado, F., Dessouky, Y., & Dessouky, M. (2017). Forty years of Computers & Industrial Engineering: A bibliometric analysis. Computers & Industrial Engineering, 113, 614–629. https://doi.org/10.1016/j.cie.2017.08.033 5. Clark, K. W. (2016). Reference Services Review: content analysis, 2012-2014. Reference Services Review, 44(1), 61–75. https://doi.org/10.1108/RSR-06-2015-0031 6. Das, T. (2013). A bibliometric analysis of contributions in the journal Library Trends. Library Philosophy and Practice (E-Journal). Retrieved from https://digitalcommons.unl.edu/libphilprac/1014 7. Davis, P. M., Lewenstein, B. V., Simon, D. H., Booth, J. G., & Connolly, M. J. L. (2008). Open access publishing, article downloads, and citations: randomised controlled trial. The BMJ, 337:a568. https://doi.org/10.1136/bmj.a568 8. Fiala, D. (2012). Bibliometric analysis of CiteSeer data for countries. Information Processing & Management, 48(2), 242–253. https://doi.org/10.1016/j.ipm.2011.10.001
- 20. 9. Garcia, P., et al. (2005). Evolution of Spanish Scientific Production in International Obstetrics and Gynecology Journals during the period 1986-2002. Journal of Obstetrics & Gynecology and Reproductive Biology, 123, 150-156. 10. Jahandideh, S., Abdolmaleki, P., & Asadabadi, E. B. (2007). Prediction of future citations of a research paper from number of its internet downloads. Medical Hypotheses, 69(2), 458– 459. https://doi.org/10.1016/j.mehy.2007.01.007 11. Kumar, M., & Moorthy, A. L. (2011). Bibliometric Analysis of DESIDOC Journal of Library and Information Technology from 2001-2010. DESIDOC Journal of Library & Information Technology, 31(3). https://doi.org/10.14429/djlit.31.3.989 12. Kumar, Mahendra (2014). Library Herald Journal: A Bibliometric Study. Journal of Education & Social Policy. (1)2. 13. Levitt, J. M., & Thelwall, M. (2011). A combined bibliometric indicator to predict article impact. Information Processing & Management, 47(2), 300–308. https://doi.org/10.1016/j.ipm.2010.09.005 14. Li, J., Wu, D., Li, J., & Li, M. (2017). A comparison of 17 article-level bibliometric indicators of institutional research productivity: Evidence from the information management literature of China. Information Processing & Management, 53(5), 1156–1170. https://doi.org/10.1016/j.ipm.2017.05.002 15. Lotka, A. J. (1926). Frequency distribution of scientific productivity. Journal of Washington Academic Science, 16(12), 317-323. 16. Maharana, R. K., & Das, A. K. (2013). Bibliometric Analysis of Malaysian Journal of Library & Information Science (MJLIS) During 2007-2011. eLibrary Science Research Journal, 1(10), 1-11. 17. Mahraj, K. (2012). Reference Services Review: content analysis, 2006‐2011. Reference Services Review, 40(2), 182–198. https://doi.org/10.1108/00907321211228237 18. Merigó, J. M., Blanco-Mesa, F., Gil-Lafuente, A. M., & Yager, R. R. (2017). Thirty Years of the International Journal of Intelligent Systems: A Bibliometric Review. International Journal of Intelligent Systems, 32(5), 526–554. https://doi.org/10.1002/int.21859 19. Merigó, J. M., Mas-Tur, A., Roig-Tierno, N., & Ribeiro-Soriano, D. (2015). A bibliometric overview of the Journal of Business Research between 1973 and 2014. Journal of Business Research, 68(12), 2645–2653. https://doi.org/10.1016/j.jbusres.2015.04.006 20. Minas, H., Wright, A., Zhao, M., & Kakuma, R. (2014). International journal of mental health systems: a bibliometric study. International Journal of Mental Health Systems, 8(1). https://doi.org/10.1186/1752-4458-8-1 21. Negi U. (2017). The Electronic Library, 2007-2016: A Bibliometric Study. J Adv Res Lib Inform Sci., 4(4), 30-36. https://doi.org/10.24321/2395.2288.201710 22. Panda, J. Mohanty, B. and Sahoo, J. (2011). Mapping of Publication Pattern of IASLIC Bulletin: A decade’s Analysis (2000-2009), IASLIC Bulletin, 56(3), 234-243. 23. Pandita, R. (2014). DESIDOC Journal of Library and Information Technology (DJLIT): A Bibliometric Study (2003-12). Library Philosophy and Practice (E-Journal). Retrieved from https://digitalcommons.unl.edu/libphilprac/1038 24. Restrepo, G., & Willett, P. (2017). The Journal of Mathematical Chemistry: a bibliometric profile. Journal of Mathematical Chemistry, 55(8), 1589–1596. https://doi.org/10.1007/s10910-017-0747-7 25. Roy, S., & Basak, M. (2013). Journal of Documentation : a Bibliometric Study. Library Philosophy and Practice (E-Journal). Retrieved from https://digitalcommons.unl.edu/libphilprac/945 26. Sevukan, R. et. al. (2007). Research Output of Faculties of Plant Sciences in Central Universities of India: a Bibliometric Study, Annals of Library and Information Sciences, 54, 129-139.
- 21. 27. Shukla, A., & Moyon, N. T. (2017). International Research - Journal of Library and Information Science: A Bibliometric Analysis. Library Philosophy and Practice (E-Journal). Retrieved from https://digitalcommons.unl.edu/libphilprac/1530 28. Singh, J. (2017). Bibliometric Analysis of Pearl: A Journal of Library and Information. Asian Journal of Information Science and Technology. 7 (2), 1-7. 29. Singson, M., Thiyagarajan, S., & Leeladharan, M. (2016). Relationship between electronic journal downloads and citations in library consortia. Library Review, 65(6/7), 429–444. https://doi.org/10.1108/LR-02-2016-0019 30. Suárez-Balseiro, C., García-Zorita, C., & Sanz-Casado, E. (2009). Multi-authorship and its impact on the visibility of research from Puerto Rico. Information Processing & Management, 45(4), 469–476. https://doi.org/10.1016/j.ipm.2009.03.001 31. Swain, C., Swain, D. K., & Rautaray, B. (2013). Bibliometric analysis of Library Review from 2007 to 2011. Library Review, 62(8/9), 602–618. https://doi.org/10.1108/LR-02-2013- 0012 32. Swain, D. K. (2013). Journal Bibliometric Analysis: A Case Study on Internet Research. Library Philosophy and Practice (E-Journal). Retrieved from https://digitalcommons.unl.edu/libphilprac/985 33. Tella, A., & Olabooye, A. A. (2014). Bibliometric analysis of African Journal of Library, Archives and Information Science from 2000-2012. Library Review, 63(4/5), 305–323. https://doi.org/10.1108/LR-07-2013-0094 34. Thanuskodi, S. (2010). Bibliometric Analysis of the Journal Library Philosophy and Practice from 2005-2009. Library Philosophy and Practice (E-Journal). Retrieved from https://digitalcommons.unl.edu/libphilprac/437 35. Thanuskodi, S. (2011). Library Herald Journal: A Bibliometric Study. Researchers World: Journal of Arts, Science and Commerce (RW-JASC), 2(4). 68-76. 36. Tiew, W. S., Abdullah, A., & Kaur, K. (2001). Malaysian Journal of Library and Information Science 1996-2000: a bibliometric study. Malaysian Journal of Library & Information Science, 6(1), 43–56. 37. Tsay, M. (2008). Journal bibliometric analysis: a case study on the JASIST. Malaysian Journal of Library & Information Science, 13(2), 121-139 38. Tsay, M. (2011). A bibliometric analysis and comparison on three information science journals: JASIST, IPM, JOD, 1998–2008. Scientometrics, 89(2), 591. https://doi.org/10.1007/s11192-011-0460-4 39. Tsay, M., & Shu, Z. (2011). Journal bibliometric analysis: a case study on the Journal of Documentation. Journal of Documentation, 67(5), 806–822. https://doi.org/10.1108/00220411111164682 40. Tsay, Ming-Yueh. (2011) Bibliometric Analysis on the Journal of Information Science. Journal of Library and Information Science Research, (5) 2 , 1-28. 41. Verma, A., Sonkar, S., & Gupta, V. (2015). A Bibliometric Study of the Library Philosophy and Practice (E-Journal) For the Period 2005-2014. Library Philosophy and Practice (E- Journal). Retrieved from https://digitalcommons.unl.edu/libphilprac/1292 42. Vošner, H. B., Kokol, P., Bobek, S., Železnik, D., & Završnik, J. (2016). A bibliometric retrospective of the Journal Computers in Human Behavior (1991–2015). Computers in Human Behavior, 65, 46–58. https://doi.org/10.1016/j.chb.2016.08.026 43. Warraich, N. F., & Ahmad, S. (2011). Pakistan Journal of Library and Information Science: A bibliometric analysis. Pakistan Journal of Information Management and Libraries. Retrieved January 15, 2018, from http://eprints.rclis.org/25600/ 44. Yu, D., Xu, Z., Pedrycz, W., & Wang, W. (2017). Information sciences 1968–2016: A retrospective analysis with text mining and bibliometric. Information Sciences, 418–419, 619–634. https://doi.org/10.1016/j.ins.2017.08.031
- 22. 45. Železnik, D., Blažun Vošner, H., & Kokol, P. (2017). A bibliometric analysis of the Journal of Advanced Nursing, 1976–2015. Journal of Advanced Nursing, 73(10), 2407–2419. https://doi.org/10.1111/jan.13296 46. Zhang, C.-C., Zheng, X., Su, C.-H., Huang, H., Yan, F.-R., Pan, X.-J., … Jin, Z.-Z. (2017). A bibliometric study of the Journal of School Health: 1965–2014. Chinese Nursing Research, 4(2), 75–83. https://doi.org/10.1016/j.cnre.2017.03.011