2 November Daily technical trader
•
0 likes•374 views

The document provides a technical analysis of the QE Index and key Qatari stocks to consider. It finds the QE Index ended lower, losing 277 points, and several stocks like Qatar Electricity & Water Co. and Qatar Insurance declined and breached important support levels. However, some stocks like Barwa Real Estate Co. and Milaha gained and have potential to continue their upward moves if they surpass resistance levels. Overall, the analysis adopts a neutral short-term view of the QE Index and Al Rayan Islamic Index, and identifies both upward and downward potential in various stocks.

Recommended
More Related Content
What's hot
What's hot (20)
Viewers also liked
Viewers also liked (20)
Similar to 2 November Daily technical trader
Similar to 2 November Daily technical trader (11)
More from QNB Group
More from QNB Group (20)
Recently uploaded
Recently uploaded (20)
2 November Daily technical trader
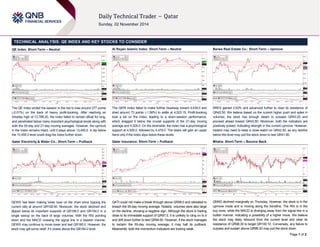
- 1. Page 1 of 2 TECHNICAL ANALYSIS: QE INDEX AND KEY STOCKS TO CONSIDER QE Index: Short-Term – Neutral The QE Index ended the session in the red to lose around 277 points (-2.01%) on the back of heavy profit-booking. After reaching an intraday high of 13,788.20, the index failed to remain afloat for long, and penetrated below many important psychological levels along with both the 55-day and 21-day moving averages. However, the upmove in the index remains intact, until it stays above 13,450.0. A dip below the 13,450.0 level could drag the index further down. Qatar Electricity & Water Co.: Short-Term – Pullback QEWS has been making lower lows on the chart since topping the current rally at around QR192.60. Moreover, the stock declined and dipped below its important supports of QR186.0 and QR184.0 in a single swoop on the back of large volumes. With the RSI pointing down and the MACD crossing the signal line in a bearish manner, QEWS may continue to move lower and test QR180.0. However, the stock may get some relief, if it closes above the QR184.0 level. Al Rayan Islamic Index: Short-Term – Neutral The QERI Index failed to make further headway toward 4,639.0 and shed around 73 points (-1.58%) to settle at 4,523.15. Profit-booking took a toll on the index, leading to a down-session performance, which dragged it below the crucial supports of the 21-day moving average and 4,529.0. On the downside, the index has a psychological support at 4,500.0, followed by 4,476.0. The bears will gain an upper hand only if the index slips below these levels. Qatar Insurance: Short-Term – Pullback QATI could not make a break through above QR99.0 and retreated to breach the 55-day moving average. Notably, volumes were also large on the decline, showing a negative sign. Although the stock is trading close to its immediate support of QR97.0, it is unlikely to cling on to it and drift down further to test QR94.60. However, if the stock manages to reclaim the 55-day moving average, it may halt its pullback. Meanwhile, both the momentum indicators are looking weak. Barwa Real Estate Co.: Short-Term – Upmove BRES gained 2.63% and advanced further to clear its resistance of QR42.50. We believe based on the current higher push and spike in volumes, the stock has enough steam to surpass QR43.20 and proceed ahead toward QR43.80. Moreover, both the indicators are positively poised, indicating strength in the current upmove. However, traders may need to keep a close watch on QR42.50, as any decline below this level may pull the stock down to test QR41.80. Milaha: Short-Term – Bounce Back QNNS declined marginally on Thursday. However, the stock is in the upmove mode and is moving along the trendline. The RSI is in the buy zone, while the MACD is diverging away from the signal line in a bullish manner, indicating a possibility of a higher move. We believe the stock may likely rebound from the current level and clear its resistance of QR98.30 to target QR100.10. Conversely, any failure to surpass and sustain above QR98.30 may pull the stock down.
- 2. Contacts Saugata Sarkar Abdullah Amin, CFA Shahan Keushgerian Sahbi Kasraoui Ahmed Al-Khoudary QNB Financial Services SPC Head of Research Senior Research Analyst Senior Research Analyst Manager - HNWI Head of Sales Trading – Institutional Contact Center: (+974) 4476 6666 Tel: (+974) 4476 6534 Tel: (+974) 4476 6569 Tel: (+974) 4476 6509 Tel: (+974) 4476 6544 Tel: (+974) 4476 6548 PO Box 24025 saugata.sarkar@qnbfs.com.qa abdullah.amin@qnbfs.com.qa shahan.keushgerian@qnbfs.com.qa sahbi.alkasraoui@qnbfs.com.qa ahmed.alkhoudary@qnbfs.com.qa Doha, Qatar DISCLAIMER: This publication has been prepared by QNB Financial Services SPC (“QNBFS”) a wholly-owned subsidiary of Qatar National Bank (“QNB”). QNBFS is regulated by the Qatar Financial Markets Authority and the Qatar Exchange; QNB is regulated by the Qatar Central Bank. This publication expresses the views and opinions of QNBFS at a given time only. It is not an offer, promotion or recommendation to buy or sell securities or other investments, nor is it intended to constitute legal, tax, accounting, or financial advice. We therefore strongly advise potential investors to seek independent professional advice before making any investment decision. Although the information in this report has been obtained from sources that QNBFS believes to be reliable, we have not independently verified such information and it may not be accurate or complete. While this publication has been prepared with the utmost degree of care by our analysts, QNBFS does not make any representations or warranties as to the accuracy and completeness of the information it may contain, and declines any liability in that respect. QNBFS reserves the right to amend the views and opinions expressed in this publication at any time. It may also express viewpoints or make investment decisions that differ significantly from, or even contradict, the views and opinions included in this report. COPYRIGHT: No part of this document may be reproduced without the explicit written permission of QNBFS. Page 2 of 2 *These stocks are today’s suggested ideas Overall Methodology: The charts and descriptions on Page 1 provide an indicative view of the future direction of the equities mentioned. The table on page 2 has been provided to denote historical movements in certain stocks. The historical trend analysis uses 21- and 55- day SMAs for indicating short-term and long-term trends, respectively. Based on these SMAs, the historical direction of the trend is denoted as UP, DOWN or FLAT. Selection of Key Stocks of the Day: Key stocks’ selection is based on our analysis of 19 members of the QE Index (excludes QNBK QD). Analysis includes identifying trends (short-term as well as long-term), patterns and support/resistance levels. Trend Direction: The methods used to determine trend direction are subjective in nature. We use 21-day SMA and 55-day SMA, absolute price movements, price movements relative to SMAs and accurately drawn trend lines and chart patterns to determine the short- and long-term trends. Investment Horizon: The definition of short term and long term depends upon investors’ preferences and their investment objectives. As a rule of thumb, the time horizon for traders/short-term trend is 1-3 weeks while it is 1-3 months for investors/long-term trend. Combining Technical and Fundamental Analysis: Investors can combine technical analysis (TA) with fundamental analysis (FA) to maximize their investment returns. While the “True Value” of stocks could be estimated by FA, the entry and exit timings could be fine tuned using technical analysis to benefit from short-term movements in stock prices. Trading Tactics: The trend direction should be analyzed based on the time-horizon of your investments. In general, investors attempt selling close to resistance levels during a downtrend and attempt buying close to support levels during uptrend. Definitions: 1> Simple Moving Average (SMA): A SMA is the average of the closing price of a security for a given period. 2> RSI (Relative Strength Index): A technical momentum indicator that ranges from 0 to 100 and compares the stock’s recent price movements by evaluating recent gains and losses. Stocks with RSI above 70 could be considered overbought and below 30 could be considered oversold. If the RSI falls below 70, it is a bearish signal. On the other hand, if the RSI rises above 30 it is considered bullish. We use a RSI of 14 days. 3> MACD (Moving Average Convergence Divergence): MACD denotes the relationship between two moving averages, which is used to spot changes in strength, direction, momentum and duration of a stock price trend. The MACD is calculated by subtracting the 26-day exponential moving average (EMA) from the 12-day EMA. A nine-day EMA of the MACD, called the signal line, is also plotted on top of the MACD, functioning as a trigger for buy/sell signals. The MACD line above the signal line provides a positive signal and vice versa. Name (Ticker) Last Close Trend Support Resistance Short Term Long Term First Second First Second Qatar Exchange Index (QE Index) 13,498.86 FLAT DOWN 13,447.17 13,400.00 13,500.00 13,584.34 Al Rayan Islamic Index (QERI Index) 4,523.15 DOWN DOWN 4,500.00 4,476.45 4,528.58 4,584.50 Banks and Financial Services Banks and Masraf Al Rayan (MARK QD) 51.00 DOWN DOWN 50.40 49.75 51.80 52.80 Commercial Bank of Qatar (CBQK QD) 73.90 UP UP 73.40 72.50 74.30 75.00 Doha Bank (DHBK QD) 58.00 FLAT DOWN 58.00 57.20 59.20 60.50 Qatar Islamic Bank (QIBK QD) 112.00 DOWN DOWN 111.00 110.00 113.00 115.00 Qatar International Islamic Bank (QIIK QD) 87.00 FLAT DOWN 86.10 84.90 87.30 89.00 Qatar Insurance (QATI QD)* 97.10 DOWN DOWN 97.00 94.60 98.00 99.00 Consumer Goods and Services Consumer Goods Medicare Group (MCGS QD) 126.40 DOWN DOWN 124.75 121.50 126.50 128.80 Industrials Industrials Industries Qatar (IQCD QD) 188.40 FLAT FLAT 186.40 184.00 188.50 190.00 Qatar Electricity & Water Co. (QEWS QD)* 182.20 DOWN DOWN 180.00 178.18 184.00 186.00 Gulf International Services (GISS QD) 119.00 DOWN FLAT 118.10 115.00 119.50 121.00 Qatari Investors Group (QIGD QD) 49.35 DOWN DOWN 48.90 47.70 49.75 51.00 Real Estate Real Estate Barwa Real Estate Co. (BRES QD)* 42.95 UP UP 42.50 41.80 43.20 43.80 United Development Co. (UDCD QD) 26.65 DOWN DOWN 26.45 26.10 26.70 27.00 Ezdan Holding Group (ERES QD) 19.70 UP UP 19.36 18.97 20.04 20.35 Mazaya Qatar Real Estate Development (MRDS QD) 24.10 UP FLAT 23.89 23.35 24.25 25.00 Telecom Telecom Ooredoo (ORDS QD) 123.50 DOWN DOWN 122.90 121.00 123.70 124.90 Vodafone Qatar (VFQS QD) 20.70 DOWN FLAT 20.40 20.00 20.79 21.10 Transportation Transportation Nakilat (QGTS QD) 23.75 DOWN DOWN 23.40 23.00 23.90 24.12 Milaha (QNNS QD)* 97.80 UP UP 97.20 96.50 98.30 100.10