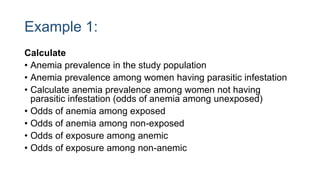
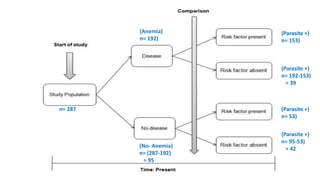
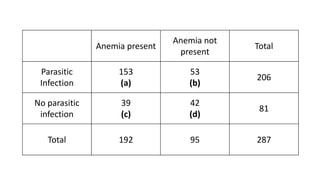
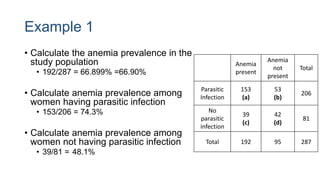
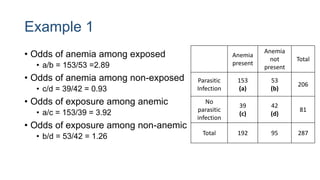
RESEARCH DESIGN
Prabesh Ghimire
Observational Analytical Study Designs
Cross-Sectional Design
Cross-Sectional Study
• Cross-sectional studies are observational studies in which
exposure and outcome are analyzed simultaneously (at a
single point in time).
• These studies are also known as prevalence studies, since they
enable calculation of disease frequency in a particular sample.
• They can determine
• the presence or absence of a disease (such as the percentage of
people with lung cancer) or
• exposure to a particular causal factor at a particular time (such as the
influence of smoking on coronary disease).
Cross-Sectional Study
• They are also often used to determine the diagnostic
characteristics of a test, by comparing it to a gold standard and
deriving the classic measures of association.
• The measure of association in cross-sectional studies is
prevalence.
Design of Cross-Sectional Study
Formal Structure of Design
• In a cross-sectional study all measurements are made at one
time point. Its formal structure is similar to that of a cohort study,
except for the time at which the measurements are made.
• Unlike cohort studies, in cross-sectional studies there is no
clear time relation between exposure and outcome.
Design of Cross-Sectional Study
Sample Selection
• Selection of the study groups naturally begins by selecting the
relevant population.
• The next step after determining the population is to select a
sample. i.e. those who will be the subjects of the study. In larger
populations, sampling may be systematic or random.
Design of Cross-Sectional Study
Analysis of measures of association
• The measure of association in cross-sectional studies is
prevalence, the ratio between the diseased subjects at one
point in time and all subjects at risk at the point of time.
• We may also calculate odds ratios to measure the strength of
association
• Findings of prevalence surveys must be interpreted cautiously;
the mere fact that two variables are associated does not mean
that they are causally related.
Figure source: https://www.ncbi.nlm.nih.gov/pmc/articles/PMC4885177/
Example 1
• We are interested to know the prevalence of anemia among
pregnant women in a village.
• We design a population-based survey to assess the prevalence
of this condition. We go to all the households having pregnant
(that were supposed to be included in the study) and examine
the population.
• Suppose, the total sample surveyed is 287. Of these, we found
that 192 pregnant women were anemic.
• 153 anemic women and 53 non-anemic women had parasitic
infection
Example 1:
Calculate
• Anemia prevalence in the study population
• Anemia prevalence among women having parasitic infestation
• Calculate anemia prevalence among women not having
parasitic infestation (odds of anemia among unexposed)
• Odds of anemia among exposed
• Odds of anemia among non-exposed
• Odds of exposure among anemic
• Odds of exposure among non-anemic
(Anemia)
n= 192)
(No- Anemia)
n= (287-192)
= 95
(Parasite +)
n= 153)
(Parasite +)
n= 53)
(Parasite +)
n= 192-153)
= 39
(Parasite +)
n= 95-53)
= 42
n= 287
Anemia present
Anemia not
present
Total
Parasitic
Infection
153
(a)
53
(b)
206
No parasitic
infection
39
(c)
42
(d)
81
Total 192 95 287
Example 1
• Calculate the anemia prevalence in the
study population
• 192/287 = 66.899% =66.90%
• Calculate anemia prevalence among
women having parasitic infection
• 153/206 = 74.3%
• Calculate anemia prevalence among
women not having parasitic infection
• 39/81 = 48.1%
Anemia
present
Anemia
not
present
Total
Parasitic
Infection
153
(a)
53
(b)
206
No
parasitic
infection
39
(c)
42
(d)
81
Total 192 95 287
Example 1
• Odds of anemia among exposed
• a/b = 153/53 =2.89
• Odds of anemia among non-exposed
• c/d = 39/42 = 0.93
• Odds of exposure among anemic
• a/c = 153/39 = 3.92
• Odds of exposure among non-anemic
• b/d = 53/42 = 1.26
Anemia
present
Anemia
not
present
Total
Parasitic
Infection
153
(a)
53
(b)
206
No
parasitic
infection
39
(c)
42
(d)
81
Total 192 95 287
Strengths and Limitations
Strengths
• No need to wait for the outcome, and so there are no risks for
loss to follow up;
• It is the only study design that can determine the disease
prevalence;
• It can be accomplished in short duration of time as compared to
other studies
Strengths and Limitations
Strengths
• These are studies are conducted either before planning a
cohort study or a baseline in a cohort study.
• Several outcomes can be studied at the same time
• These study designs may be useful for public health planning,
monitoring, and evaluation. For example, the National AIDS
Program conducts cross-sectional IBB survey among high-risk
groups to monitor the prevalence of HIV in these groups.
Strengths and Limitations
Limitations
• Impossible for rare predictors or outcomes
• Impossible to establish a sequence of events
• Cannot be used to calculate incidence or relative risk
• Cannot establish causality or the natural history or prognosis of
a disease
Case-Control Design
Case-Control Study
• In this design, participants are selected for the study based on
their outcome status.
• A number of cases and non-cases (controls) are identified, and
the occurrence of one or more prior exposures is compared
between groups to evaluate exposure–outcome associations.
• A case–control study runs in reverse relative to a cohort study.
When to use a case-control design
• To investigate risk factors for a rare disease where a
prospective study would take too long to identify sufficient cases
• To investigate an acute outbreak in order to identify causal
factor quickly.
Design of a case-control-study
Design of Case-Control Study
Selection of cases
• It is essential that the case definition is clearly defined at the
outset of the investigation to ensure that all cases included in
the study are based on the same diagnostic criteria.
• Sometimes, definition of a disease may be based on multiple
criteria; thus, all these points should be explicitly stated in case
definition.
• Sources of cases needs to be clearly defined
Design of Case-Control Study
Selection of cases
• Cases may be recruited from a number of sources; for example they
may be recruited from a hospital, clinic, or may be population based.
• Selecting only hospital-based cases may lead to systematic error
related to hospital admission practices (a phenomenon known as
Berksonian bias).
• Population based case control studies are generally more expensive
and difficult to conduct.
• Preferably, new (incident) cases should be selected, as non-incident
cases usually over-represent long-term survivors, and diagnostic
practices may change over time, introducing potential bias.
Design of Case-Control Study
Selection of controls
• The next important point in designing a case-control study is the
selection of control.
• Essentially, the controls should come from a population with the
same exposure distribution as the cases.
• Common choices of control include
• Hospital Control: Patients in the same hospital but with unrelated disease or
conditions
• Relative/friend controls
• Population controls: A random sample of the population from which the
cases come
• Clearly the best control group is the third option, but this is expensive
and time consuming
Design of Case-Control Study
Matching
• Matching is often used in case-control control studies to ensure
that the cases and controls are similar in certain characteristics.
• For example, in the smoking and lung cancer study, the authors
select controls that are similar in age and sex to carcinoma
cases.
• Matching is a useful technique to increase the efficiency of
study.
• ‘Individual matching’ is one common technique used in case-
control study.
Design of Case-Control Study
Matching
• Matching may be useful to control for certain types of
confounders.
• For instance, environment variables may be accounted for by
matching controls for neighborhood or area of residence.
• Household environment and genetic factors may be accounted
for by enrolling siblings as controls.
Design of Case-Control Study
Measurement of exposure status
• Exposure status is measured to assess the presence or level of
exposure for each individual for the period of time prior to the
onset of the disease or condition under investigation when the
exposure would have acted as a causal factor.
• In case-control studies the measurement of exposure is
established after the development of disease and as a result is
prone to both recall and observer bias.
Design of Case-Control Study
Analysis of measure of association
• In a case-control study, the odds ratio is the usual measure of
association reported.
• This measure is the ratio of the odds of an exposure between
cases and controls.
• Since we are not able to measure incidence data in case-
control study, an odds ratio is a reasonable measure of the
relative risk (under some assumptions).
Figure source: https://www.ncbi.nlm.nih.gov/pmc/articles/PMC4817437/
Additional Points
What should be the ratio of cases : control?
• The most optimum case-to-control ratio is 1:1.
• For a fixed sample size, the chi square test for independence is most
powerful if the number of cases is same as the number of controls.
• However, in many situations we may not be able recruit a large number of
cases and it may be easier to recruit more controls for the study.
• We can increase the number of controls to increase statistical power (if we
have limited number of cases) of the study.
• If data are available at no extra cost, then we may recruit multiple controls
for each case.
• However, if it is expensive to collect exposure and outcome information
from cases and controls, then the optimal ratio is 4 controls: 1 case.
Strengths and Limitations
Strengths
• They are efficient for rare diseases or diseases with a long latency
period between exposure and disease manifestation (e.g.
melanoma).
• Cost-effective relative to other analytical studies such as cohort
studies.
• It is also useful to study multiple exposures in the same outcome.
• No problems of attrition (loss to follow up)
• No risks to subjects. So, ethical problems are minimal
• Case-control studies are useful to study the association of risk
factors and outcomes in outbreak investigations.
Strengths and Limitations
Limitations
• Not useful to study rare exposures. It may be prudent to
conduct a cohort study for rare exposures
• The design is not useful to study multiple outcomes.
• Sometimes the temporality of the exposure and outcome may
not be clearly established in case-control studies
• Prone to certain biases (selection, observer and recall bias)
• Selection of control may be difficult
For further reading about case-control
study
• Methodology Series Module 2: Case-control Studies:
https://www.ncbi.nlm.nih.gov/pmc/articles/PMC4817437/
• https://www.healthknowledge.org.uk/e-
learning/epidemiology/practitioners/introduction-study-design-
ccs
Nested Case-Control Design
Nested Case Control Study
• A nested case-control study is a type of case-control study that
draws its cases and controls from a cohort population that has
been followed for a period of time.
• A nested-case control study depends on the pre-existence of a
cohort that has been followed over time.
• This cohort, at its inception or during the course of follow-up,
has had exposure information collected that are of interest to
the investigator.
Nested Case Control Study
• The investigator identifies cases of disease that occurred in the
cohort during the follow-up period.
• The investigator also identifies disease-free individuals within
the cohort to serve as controls.
• Using previously collected data and obtaining additional
measurements of exposures from available bio-specimens, the
investigator compares the exposure frequencies in cases and
controls as in a non-nested case-control study
Design of Nested Case-Control Study
Example of Nested Case-Control Study
• Breast Cancer Occurrence Among Women With or Without DDT
Exposure
Strengths and Limitations
Strengths
• It is more efficient than a cohort design. i.e. it can detect differences
as statistically significant with a smaller sample size than that
required for a cohort analysis.
• Exposure histories are not subject to recall bias because they are
determined before the cases are diagnosed.
• This design also avoids the potential bias of not including fatal cases
and may minimize the potential bias of non-participation, since
exposure data is collected before diagnosis of disease.
• It also minimizes selection bias introduced when cases and controls
are not selected from the same populations.
• Eliminates suspicion bias
Strengths and Limitations
Limitations
• Data on exposure must be collected on the entire cohort at
baseline. Therefore the cost of data collection is likely to be
higher than traditional case control study.
• The time required is longer and less suitable for very rare
disease or those with long latent periods
Cohort Study Design
Cohort Study
• Study design used to investigate the cause of disease and to
establish links between risk factors and health outcomes.
• A group of individuals (Cohort) is followed over time (often
years) to determine the occurrence of disease
• exposed /unexposed to the risk factor.
• The incidence of disease in the exposed group is compared
with the incidence of disease in the unexposed group.
Features of Cohort Study
• The cohorts are identified prior to the appearance of the
disease under investigation
• The study groups are observed over a period of time to
determine the frequency of disease among them.
• The study proceeds forward from cause to
effect.(exposure>>outcome)
Design of Cohort Study
1. Selection of study participants
• The participants of a cohort study are usually assembled either
from general population or select groups of the population that
can be readily studied
• E.g.: persons with different degrees of exposures to the suspected
causal factor
• The cohorts must be free from the disease under study.
Design of Cohort Study
2. Obtaining data on exposure
• Exposure information should be collected in such a manner that
the study group can be classified according to the degree of
exposure.
• Information about the exposure may be obtained from number
of sources
• From cohort members through interview or mailed questionnaire
• Review of records
• Medical examination or special tests
• Environmental surveys
Design of Cohort Study
3. Selection of comparison group
a. Internal comparison:
• A single general cohort is entered in the study
• Then its members are classified into different exposure groups on the
basis of information obtained before the development of disease.
b. External comparison:
• When information on degree of exposure is not available, it is
necessary to put up an external control, to evaluate the experience of
the exposed group.
• E.g., a cohort of radiologist can be compared with cohort of
ophthalmologist to investigate the effect of radiation on development of
malignancy.
Design of Cohort Study
3. Selection of comparison group
c. Comparison with general population rates
• If none is available, the morbidity/mortality experience of the exposed
group is compared with the experience of the general population in the
same geographic area as the exposed people.
• E.g., comparison of frequency of cancer among asbestos workers with
the rate in general population in the same geographic area.
Design of Cohort Study
4. Follow up
• At the beginning of the study, method should be developed to
obtain data for assessing the outcome.
• The entire study participant should be followed up from point of
exposure.
5. Analysis of measure of association
• For cohort studies, the exposure outcome association is usually
expressed as
• relative risk or
• incidence rates of outcome among exposed and non-exposed.
Types of Cohort Study
1. Prospective cohort studies
• Prospective cohort study is one in which the outcome has not
yet occurred at the time the investigation begins.
• The study subjects are classified on the basis of presence or
absence of exposure and followed up to find the development of
the outcome of interest.
Types of Cohort Study
2. Retrospective (historical) cohort study
• The subjects are classified on the basis of presence or absence
of exposure but in this type the exposure and the outcome of
interest have already occurred at the beginning of the study.
• A historical cohort study depends upon the availability of good
data or records that allow the reconstruction of the exposure of
cohorts to a suspected risk factor.
Types of Cohort Study
3. Combination of retrospective and prospective cohort
studies
• In this type of study, both the retrospective and prospective
elements are combined.
• The cohort is identified from past records, and is assessed of
date for the outcome.
• The same cohort is followed up prospectively into future for
further assessment of outcome.
Strengths and Limitations
Strengths
• The temporal sequence i.e. exposure preceding outcome is
explicit in the study design
• Cohort studies are relatively efficient for studying rare
exposures.
• Multiple outcomes may be assessed for a single exposure.
• The incidence of a particular outcome among persons exposed
can be directly calculated.
Strengths and Limitations
Limitations
• Long observation periods may be more susceptible to losses to
follow-up (attrition) and to inaccurate measurement of
exposures and outcomes.
• They are unsuitable for investigating rare diseases or
diseases with low incidence.
• Since the study take place for longer periods, it is difficult to
keep large number of people under surveillance indefinitely.
• Cohort studies are expensive.
Source:
https://en.wikipedia.org/wiki/Cohort_study#/media/
File:ExplainingCaseControlSJW-en.svg
For further reading
• Song, J. W., & Chung, K. C. (2010). Observational studies: cohort and
case-control studies. Plastic and reconstructive surgery, 126(6), 2234–
2242. https://doi.org/10.1097/PRS.0b013e3181f44abc
• https://www.healthknowledge.org.uk/e-
learning/epidemiology/practitioners/introduction-study-design-cs
THANK YOU

Observational analytical study: Cross-sectional, Case-control and Cohort studies

  • 1.
  • 2.
  • 3.
    Cross-Sectional Study • Cross-sectionalstudies are observational studies in which exposure and outcome are analyzed simultaneously (at a single point in time). • These studies are also known as prevalence studies, since they enable calculation of disease frequency in a particular sample. • They can determine • the presence or absence of a disease (such as the percentage of people with lung cancer) or • exposure to a particular causal factor at a particular time (such as the influence of smoking on coronary disease).
  • 4.
    Cross-Sectional Study • Theyare also often used to determine the diagnostic characteristics of a test, by comparing it to a gold standard and deriving the classic measures of association. • The measure of association in cross-sectional studies is prevalence.
  • 5.
  • 6.
    Design of Cross-SectionalStudy Formal Structure of Design • In a cross-sectional study all measurements are made at one time point. Its formal structure is similar to that of a cohort study, except for the time at which the measurements are made. • Unlike cohort studies, in cross-sectional studies there is no clear time relation between exposure and outcome.
  • 7.
    Design of Cross-SectionalStudy Sample Selection • Selection of the study groups naturally begins by selecting the relevant population. • The next step after determining the population is to select a sample. i.e. those who will be the subjects of the study. In larger populations, sampling may be systematic or random.
  • 8.
    Design of Cross-SectionalStudy Analysis of measures of association • The measure of association in cross-sectional studies is prevalence, the ratio between the diseased subjects at one point in time and all subjects at risk at the point of time. • We may also calculate odds ratios to measure the strength of association • Findings of prevalence surveys must be interpreted cautiously; the mere fact that two variables are associated does not mean that they are causally related.
  • 9.
  • 10.
    Example 1 • Weare interested to know the prevalence of anemia among pregnant women in a village. • We design a population-based survey to assess the prevalence of this condition. We go to all the households having pregnant (that were supposed to be included in the study) and examine the population. • Suppose, the total sample surveyed is 287. Of these, we found that 192 pregnant women were anemic. • 153 anemic women and 53 non-anemic women had parasitic infection
  • 11.
    Example 1: Calculate • Anemiaprevalence in the study population • Anemia prevalence among women having parasitic infestation • Calculate anemia prevalence among women not having parasitic infestation (odds of anemia among unexposed) • Odds of anemia among exposed • Odds of anemia among non-exposed • Odds of exposure among anemic • Odds of exposure among non-anemic
  • 12.
    (Anemia) n= 192) (No- Anemia) n=(287-192) = 95 (Parasite +) n= 153) (Parasite +) n= 53) (Parasite +) n= 192-153) = 39 (Parasite +) n= 95-53) = 42 n= 287
  • 13.
    Anemia present Anemia not present Total Parasitic Infection 153 (a) 53 (b) 206 Noparasitic infection 39 (c) 42 (d) 81 Total 192 95 287
  • 14.
    Example 1 • Calculatethe anemia prevalence in the study population • 192/287 = 66.899% =66.90% • Calculate anemia prevalence among women having parasitic infection • 153/206 = 74.3% • Calculate anemia prevalence among women not having parasitic infection • 39/81 = 48.1% Anemia present Anemia not present Total Parasitic Infection 153 (a) 53 (b) 206 No parasitic infection 39 (c) 42 (d) 81 Total 192 95 287
  • 15.
    Example 1 • Oddsof anemia among exposed • a/b = 153/53 =2.89 • Odds of anemia among non-exposed • c/d = 39/42 = 0.93 • Odds of exposure among anemic • a/c = 153/39 = 3.92 • Odds of exposure among non-anemic • b/d = 53/42 = 1.26 Anemia present Anemia not present Total Parasitic Infection 153 (a) 53 (b) 206 No parasitic infection 39 (c) 42 (d) 81 Total 192 95 287
  • 16.
    Strengths and Limitations Strengths •No need to wait for the outcome, and so there are no risks for loss to follow up; • It is the only study design that can determine the disease prevalence; • It can be accomplished in short duration of time as compared to other studies
  • 17.
    Strengths and Limitations Strengths •These are studies are conducted either before planning a cohort study or a baseline in a cohort study. • Several outcomes can be studied at the same time • These study designs may be useful for public health planning, monitoring, and evaluation. For example, the National AIDS Program conducts cross-sectional IBB survey among high-risk groups to monitor the prevalence of HIV in these groups.
  • 18.
    Strengths and Limitations Limitations •Impossible for rare predictors or outcomes • Impossible to establish a sequence of events • Cannot be used to calculate incidence or relative risk • Cannot establish causality or the natural history or prognosis of a disease
  • 19.
  • 20.
    Case-Control Study • Inthis design, participants are selected for the study based on their outcome status. • A number of cases and non-cases (controls) are identified, and the occurrence of one or more prior exposures is compared between groups to evaluate exposure–outcome associations. • A case–control study runs in reverse relative to a cohort study.
  • 21.
    When to usea case-control design • To investigate risk factors for a rare disease where a prospective study would take too long to identify sufficient cases • To investigate an acute outbreak in order to identify causal factor quickly.
  • 22.
    Design of acase-control-study
  • 23.
    Design of Case-ControlStudy Selection of cases • It is essential that the case definition is clearly defined at the outset of the investigation to ensure that all cases included in the study are based on the same diagnostic criteria. • Sometimes, definition of a disease may be based on multiple criteria; thus, all these points should be explicitly stated in case definition. • Sources of cases needs to be clearly defined
  • 24.
    Design of Case-ControlStudy Selection of cases • Cases may be recruited from a number of sources; for example they may be recruited from a hospital, clinic, or may be population based. • Selecting only hospital-based cases may lead to systematic error related to hospital admission practices (a phenomenon known as Berksonian bias). • Population based case control studies are generally more expensive and difficult to conduct. • Preferably, new (incident) cases should be selected, as non-incident cases usually over-represent long-term survivors, and diagnostic practices may change over time, introducing potential bias.
  • 25.
    Design of Case-ControlStudy Selection of controls • The next important point in designing a case-control study is the selection of control. • Essentially, the controls should come from a population with the same exposure distribution as the cases. • Common choices of control include • Hospital Control: Patients in the same hospital but with unrelated disease or conditions • Relative/friend controls • Population controls: A random sample of the population from which the cases come • Clearly the best control group is the third option, but this is expensive and time consuming
  • 26.
    Design of Case-ControlStudy Matching • Matching is often used in case-control control studies to ensure that the cases and controls are similar in certain characteristics. • For example, in the smoking and lung cancer study, the authors select controls that are similar in age and sex to carcinoma cases. • Matching is a useful technique to increase the efficiency of study. • ‘Individual matching’ is one common technique used in case- control study.
  • 27.
    Design of Case-ControlStudy Matching • Matching may be useful to control for certain types of confounders. • For instance, environment variables may be accounted for by matching controls for neighborhood or area of residence. • Household environment and genetic factors may be accounted for by enrolling siblings as controls.
  • 28.
    Design of Case-ControlStudy Measurement of exposure status • Exposure status is measured to assess the presence or level of exposure for each individual for the period of time prior to the onset of the disease or condition under investigation when the exposure would have acted as a causal factor. • In case-control studies the measurement of exposure is established after the development of disease and as a result is prone to both recall and observer bias.
  • 29.
    Design of Case-ControlStudy Analysis of measure of association • In a case-control study, the odds ratio is the usual measure of association reported. • This measure is the ratio of the odds of an exposure between cases and controls. • Since we are not able to measure incidence data in case- control study, an odds ratio is a reasonable measure of the relative risk (under some assumptions).
  • 30.
  • 31.
    Additional Points What shouldbe the ratio of cases : control? • The most optimum case-to-control ratio is 1:1. • For a fixed sample size, the chi square test for independence is most powerful if the number of cases is same as the number of controls. • However, in many situations we may not be able recruit a large number of cases and it may be easier to recruit more controls for the study. • We can increase the number of controls to increase statistical power (if we have limited number of cases) of the study. • If data are available at no extra cost, then we may recruit multiple controls for each case. • However, if it is expensive to collect exposure and outcome information from cases and controls, then the optimal ratio is 4 controls: 1 case.
  • 32.
    Strengths and Limitations Strengths •They are efficient for rare diseases or diseases with a long latency period between exposure and disease manifestation (e.g. melanoma). • Cost-effective relative to other analytical studies such as cohort studies. • It is also useful to study multiple exposures in the same outcome. • No problems of attrition (loss to follow up) • No risks to subjects. So, ethical problems are minimal • Case-control studies are useful to study the association of risk factors and outcomes in outbreak investigations.
  • 33.
    Strengths and Limitations Limitations •Not useful to study rare exposures. It may be prudent to conduct a cohort study for rare exposures • The design is not useful to study multiple outcomes. • Sometimes the temporality of the exposure and outcome may not be clearly established in case-control studies • Prone to certain biases (selection, observer and recall bias) • Selection of control may be difficult
  • 34.
    For further readingabout case-control study • Methodology Series Module 2: Case-control Studies: https://www.ncbi.nlm.nih.gov/pmc/articles/PMC4817437/ • https://www.healthknowledge.org.uk/e- learning/epidemiology/practitioners/introduction-study-design- ccs
  • 35.
  • 36.
    Nested Case ControlStudy • A nested case-control study is a type of case-control study that draws its cases and controls from a cohort population that has been followed for a period of time. • A nested-case control study depends on the pre-existence of a cohort that has been followed over time. • This cohort, at its inception or during the course of follow-up, has had exposure information collected that are of interest to the investigator.
  • 37.
    Nested Case ControlStudy • The investigator identifies cases of disease that occurred in the cohort during the follow-up period. • The investigator also identifies disease-free individuals within the cohort to serve as controls. • Using previously collected data and obtaining additional measurements of exposures from available bio-specimens, the investigator compares the exposure frequencies in cases and controls as in a non-nested case-control study
  • 38.
    Design of NestedCase-Control Study
  • 39.
    Example of NestedCase-Control Study • Breast Cancer Occurrence Among Women With or Without DDT Exposure
  • 40.
    Strengths and Limitations Strengths •It is more efficient than a cohort design. i.e. it can detect differences as statistically significant with a smaller sample size than that required for a cohort analysis. • Exposure histories are not subject to recall bias because they are determined before the cases are diagnosed. • This design also avoids the potential bias of not including fatal cases and may minimize the potential bias of non-participation, since exposure data is collected before diagnosis of disease. • It also minimizes selection bias introduced when cases and controls are not selected from the same populations. • Eliminates suspicion bias
  • 41.
    Strengths and Limitations Limitations •Data on exposure must be collected on the entire cohort at baseline. Therefore the cost of data collection is likely to be higher than traditional case control study. • The time required is longer and less suitable for very rare disease or those with long latent periods
  • 42.
  • 43.
    Cohort Study • Studydesign used to investigate the cause of disease and to establish links between risk factors and health outcomes. • A group of individuals (Cohort) is followed over time (often years) to determine the occurrence of disease • exposed /unexposed to the risk factor. • The incidence of disease in the exposed group is compared with the incidence of disease in the unexposed group.
  • 44.
    Features of CohortStudy • The cohorts are identified prior to the appearance of the disease under investigation • The study groups are observed over a period of time to determine the frequency of disease among them. • The study proceeds forward from cause to effect.(exposure>>outcome)
  • 45.
  • 46.
    Design of CohortStudy 1. Selection of study participants • The participants of a cohort study are usually assembled either from general population or select groups of the population that can be readily studied • E.g.: persons with different degrees of exposures to the suspected causal factor • The cohorts must be free from the disease under study.
  • 47.
    Design of CohortStudy 2. Obtaining data on exposure • Exposure information should be collected in such a manner that the study group can be classified according to the degree of exposure. • Information about the exposure may be obtained from number of sources • From cohort members through interview or mailed questionnaire • Review of records • Medical examination or special tests • Environmental surveys
  • 48.
    Design of CohortStudy 3. Selection of comparison group a. Internal comparison: • A single general cohort is entered in the study • Then its members are classified into different exposure groups on the basis of information obtained before the development of disease. b. External comparison: • When information on degree of exposure is not available, it is necessary to put up an external control, to evaluate the experience of the exposed group. • E.g., a cohort of radiologist can be compared with cohort of ophthalmologist to investigate the effect of radiation on development of malignancy.
  • 49.
    Design of CohortStudy 3. Selection of comparison group c. Comparison with general population rates • If none is available, the morbidity/mortality experience of the exposed group is compared with the experience of the general population in the same geographic area as the exposed people. • E.g., comparison of frequency of cancer among asbestos workers with the rate in general population in the same geographic area.
  • 50.
    Design of CohortStudy 4. Follow up • At the beginning of the study, method should be developed to obtain data for assessing the outcome. • The entire study participant should be followed up from point of exposure. 5. Analysis of measure of association • For cohort studies, the exposure outcome association is usually expressed as • relative risk or • incidence rates of outcome among exposed and non-exposed.
  • 51.
    Types of CohortStudy 1. Prospective cohort studies • Prospective cohort study is one in which the outcome has not yet occurred at the time the investigation begins. • The study subjects are classified on the basis of presence or absence of exposure and followed up to find the development of the outcome of interest.
  • 52.
    Types of CohortStudy 2. Retrospective (historical) cohort study • The subjects are classified on the basis of presence or absence of exposure but in this type the exposure and the outcome of interest have already occurred at the beginning of the study. • A historical cohort study depends upon the availability of good data or records that allow the reconstruction of the exposure of cohorts to a suspected risk factor.
  • 53.
    Types of CohortStudy 3. Combination of retrospective and prospective cohort studies • In this type of study, both the retrospective and prospective elements are combined. • The cohort is identified from past records, and is assessed of date for the outcome. • The same cohort is followed up prospectively into future for further assessment of outcome.
  • 54.
    Strengths and Limitations Strengths •The temporal sequence i.e. exposure preceding outcome is explicit in the study design • Cohort studies are relatively efficient for studying rare exposures. • Multiple outcomes may be assessed for a single exposure. • The incidence of a particular outcome among persons exposed can be directly calculated.
  • 55.
    Strengths and Limitations Limitations •Long observation periods may be more susceptible to losses to follow-up (attrition) and to inaccurate measurement of exposures and outcomes. • They are unsuitable for investigating rare diseases or diseases with low incidence. • Since the study take place for longer periods, it is difficult to keep large number of people under surveillance indefinitely. • Cohort studies are expensive.
  • 56.
  • 58.
    For further reading •Song, J. W., & Chung, K. C. (2010). Observational studies: cohort and case-control studies. Plastic and reconstructive surgery, 126(6), 2234– 2242. https://doi.org/10.1097/PRS.0b013e3181f44abc • https://www.healthknowledge.org.uk/e- learning/epidemiology/practitioners/introduction-study-design-cs
  • 59.