Derivative 22 October 2013 By Mansukh Investment and Trading Solution
Moneysukh Weekly Market Outlook
1. Weekly Market Outlook - 20.03.2010
DATA MATRIX FOR THE WEEK SNAPSHOT
The key benchmarks attained two month closing highs after moving in a tight range throughout
15th Mar 10 - 19th Mar 10 the day. Index heavyweight Reliance Industries (RIL) surged in late rally. IT and realty stocks fell.
But, PSU banks, auto and consumer durables stocks rose. Some side counters surged. The BSE 30-
Weekly Markets share Sensex rose 58.97 points or 0.34%, up close to 80 points from the day's low and off close to 20
points from the day's high. The market was volatile. The market edged higher in early trade. It
Sensex 17578 2.39% soon trimmed gains. The market surged again in morning trade, with the 50-unit S&P CNX Nifty
Nifty 5263 2.45% hitting its highest level in two months. The market once gains trimmed gains. The market
regained strength after hitting a fresh intraday low in morning trade. The market erased almost
Gold(US$/oz) 1107.3 0.53% the entire intraday gains in mid-morning trade. It recovered later. The market slipped into the red
Re/US$ 45.43 -0.02% in afternoon trade. Stocks regained positive zone after hitting fresh intraday lows in afternoon
trade. The market pared gains after hitting a two-month high in late trade.
Dow 10,742 1.10%
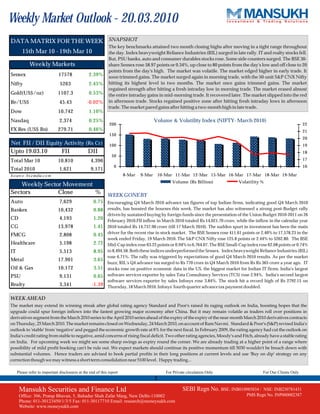
Nasdaq 2,374 0.25% Volume & Volatility Index (NIFTY- March 2010)
200 22
FX Res (US$ Bn) 279.71 0.46% 21
150
20
Net FII / DII Equity Activity (Rs Cr) 100 19
Upto 19.03.10 FII DII 18
50
Total Mar 10 10,810 4,396 17
0 16
Total 2010 1,621 9,171
S o urc e : bs e india.c o m 8-Mar 9-Mar 10-Mar 11-Mar 12-Mar 15-Mar 16-Mar 17-Mar 18-Mar 19-Mar
Volume (Rs Billion) Volatility %
Weekly Sector Movement
Sectors Close % WEEK GONE BY
Auto 7,629 0.75 Encouraging Q4 March 2010 advance tax figures of top Indian firms, indicating good Q4 March 2010
Bankex 10,432 0.88 results, has boosted the bourses this week. The market has also witnessed a strong post-Budget rally
driven by sustained buying by foreign funds since the presentation of the Union Budget 2010-2011 on 26
CD 4,193 1.20 February 2010.FII inflow in March 2010 totaled Rs 14,021.70 crore, while the inflow in the calendar year
CG 13,978 1.41 2010 totaled Rs 14,737.90 crore (till 17 March 2010). The sudden spurt in investment has been the main
FMCG 2,808 0.45 driver for the recent rise in stock market. The BSE Sensex rose 411.61 points or 2.40% to 17,578.23 in the
week ended Friday, 19 March 2010. The S&P CNX Nifty rose 125.8 points or 2.44% to 5262.80. The BSE
Healthcare 5,198 2.72 Mid-Cap index rose 63.22 points or 0.94% to 6,764.07. The BSE Small-Cap index rose 62.08 points or 0.74%
IT 5,513 8.95 to 8,494.58. Both these indices underperformed the Sensex. Index heavyweight Reliance Industries (RIL)
rose 6.71%. The rally was triggered by expectations of good Q4 March 2010 results. As per the market
Metal 17,901 3.65
buzz, RIL's Q4 advance tax surged to Rs 770 crore in Q4 March 2010 from Rs Rs 365 crore a year ago. IT
Oil & Gas 10,172 3.51 stocks rose on positive economic data in the US, the biggest market for Indian IT firms. India's largest
PSU 9,131 0.65 software services exporter by sales Tata Consultancy Services (TCS) rose 2.94%. India's second largest
software services exporter by sales Infosys rose 3.84%. The stock hit a record high of Rs 2792.15 on
Realty 3,341 -1.39 Thursday, 18 March 2010. Infosys' fourth quarter advance tax payment doubled.
Please refer to important disclosures at the end of this report For Private circulation Only For Our Clients Only
1
Mansukh Securities and Finance Ltd SEBI Regn No. BSE: INB010985834 / NSE: INB230781431
Office: 306, Pratap Bhavan, 5, Bahadur Shah Zafar Marg, New Delhi-110002 PMS Regn No. INP000002387
Phone: 011-30123450/1/3/5 Fax: 011-30117710 Email: research@moneysukh.com
Website: www.moneysukh.com
2. Weekly Market Outlook
INDEX - TECHNICAL STAND POINT
Index Composition
Date 19.03.10
INDEX Value Chg
NIFTY
Mar Fut 5270 2.4%
Apr Fut 5272 2.5%
Mar OI 22058050 -12.3%
Apr OI 6926100 224.0%
BANK NIFTY
Mar Fut 9272 1.0%
Apr Fut 9273 1.2%
Mar OI 1138800 6.3%
Apr OI 107750 297.6%
CNX IT
Mar Fut 6156 3.2%
Mar OI 44200 51.4%
TREND LINE CONJECTURE:-
We have projected a horizontal line from the top of 5310-5320. We believe it should be a crucial level to watch as we expect it may be a crucial ress for
current rally. Trend line drawn from the highs of 6357 and 5310 currently shattered at this point of time however we may watch out for another 2-3
consecutive sessions for any bullish confirmation. We believe market should consolidate around these levels in upcoming sessions though
possibility of mild profit booking shouldn’t be rule out. However any sustainable breakout above these levels could generate another 10-15% return
in near term where traders are advised to book marginal profits for their long positions.
Moreover trend line drawn from the lows of 25398 and 4675 seems to be a vital support at this juncture. Also 200 DMA providing next level of
support to this trend line though we might see some sort of consolidation near 5100 in upcoming sessions.
ELLIOT WAVE CONJECTURE:-
Remember we have already determined 'X2' wave of this diametric formation shaped in benchmark indices with nearby target at around 16850 in
previous sessions. Now with above the target levels, 'X2' wave continued to show strength however advance decline ratio displays lack of
conviction around these levels. As we have assumed that we may be into 'C' wave of the A-B-C pattern from 17776.
Since last Friday(26 Feb’10), the Index has been forming 'HIGHER TOP' formation, which continues the optimistic preconceived notion. As in the
A-B-C move, entire move from the lows of 15651 treated as a “c” leg, conceivably waiting 'Oct high of 17493 to be near term top decisively. During
the nutshell the perfidious wave marked as corrective 'B' wave, 86% up-move originated 8047 (6th March'09) to 14931 (19th May'09) adage FII
inflows of only Rs.25000 crs. Since 19th May, the FII inflows encompass explode by further Rs.62000 crs, in response to which, market moved barely
16%.
Beneath this bullish unusual composition, a Complex insider wave has been shaping from March lows in 2009. Within this, the 1st move ended at
17493 as a Diametric formation, and 2nd corrective move now seems to shaping from last week lows as domestic indices manages to past 17493 on
the last day of 2009 though index unable to sustain these levels on closing basis.. Under this alternative, the 2nd counteractive move if it possible
mostly a diagonal move, which can triggered the Sensex ahead of 17500. If it's a Diametric, the size of the 2nd corrective would be about 6-7
months with a value target of 61.8% of the 1st corrective move mentioned earlier. This would gauge to19700 on Sensex (preferably in June-Sept
2010). Well let's wait and watch if Sensex remain constraint between 15330-17500 or goes in for a decisive surge above 17800 to reap new highs of
2010.
Please refer to important disclosures at the end of this report For Private circulation Only For Our Clients Only
2
Mansukh Securities and Finance Ltd SEBI Regn No. BSE: INB010985834 / NSE: INB230781431
Office: 306, Pratap Bhavan, 5, Bahadur Shah Zafar Marg, New Delhi-110002 PMS Regn No. INP000002387
Phone: 011-30123450/1/3/5 Fax: 011-30117710 Email: research@moneysukh.com
Website: www.moneysukh.com
3. Weekly Market Outlook
MOVING AVERAGES AND THE CANDLE STICK PATTERN:
The short term moving average is an indicator of the trend in the near future. The value for the short term moving average (20 DMA) is at 5058 and
medium term moving average (50 DMA) is at 5018. Presently, the Nifty trading above its all the tree moving averages (20,50,200) which conveys
still a positive signal in near term.
RETRACEMENT AND GAP CONJECTURE:-
As marked on the chart above, on 24Aug 09, Sensex formed a gap up of 122 points ( market as GG)which might be an exhaustive one, having upper
and lower values of 15,362 and 15,240 respectively. As per Japanese candle stick theory, any gap is an incitement for bulls/bears to get their
positions in order to fill such gaps. As this gap was created on last to last August, the Sensex has already consumed more than 60 trading sessions
and the gap has not filled yet. Unless this gap is filled, the Sensex will continue to move in upward trajectory in near term.
RETRACEMENT COUNTER RETRACEMENT
HIGHS LOWS POINTS DAYS LOWS HIGHS POINTS DAYS
15600 13320 2280 21 13320 16002 2682 14
16002 14684 1318 11 14684 15958 1274 7
15958 15357 601 5 15357 16435 1078 3
BANK NIFTY FUT
Analyzing above table we scrutinize that there is continuous faster retracement taking place in the Sensex, which is an optimistic signal. There
are three downward moves.
The move from 15,600 to 13,220 took 21 days and it got retraced in 14 days.
The move from 16,002 to 14,684 took 11 days and it almost got retraced in 7 days.
The move from 15,958 to 15,357 took 5 days and it got fully retraced in just 3 days.
FIBONACCI RETRACEMENT:-
Nifty Fut Chart
Entire move from the highs of 17712 to 15651 exactly took 13 trading sessions while its retracement move also took 13 trading sessions to its 80%
level at around 17060. On technical grounds we might see some consolidation in upcoming sessions though possibilty of mild profit booking
shouldn’t be rule out. Above these levels next resistence zone would be between 17520-17800-18190. Moreover such pull backs usually countered
by small corrections. Hence we expect 16500 should act as a major support zone on lower side.
Please refer to important disclosures at the end of this report For Private circulation Only For Our Clients Only
3
Mansukh Securities and Finance Ltd SEBI Regn No. BSE: INB010985834 / NSE: INB230781431
Office: 306, Pratap Bhavan, 5, Bahadur Shah Zafar Marg, New Delhi-110002 PMS Regn No. INP000002387
Phone: 011-30123450/1/3/5 Fax: 011-30117710 Email: research@moneysukh.com
Website: www.moneysukh.com
4. Weekly Market Outlook
OSCILLATORS:
OSCILLATORS CURRENT AVERAGE
MACD (E9,E24,S9) 79.13 55.23
RSI (14,E9) 73.74 68.29
STOCHASTICS %K= 89.67 %D= 85.69
FINAL VERDICT:
Remember we have said that breakout above the Neckline of the suspected H&S formation has been proving elusive for the time being. This has
BANK NIFTY FUT
been mainly due to lack of conviction shown by reduction in volumes. Also after clocking the highest-ever volume on the second day after election
results, we have seen volumes consistently lying in downward arena. Moreover Union Budget 2010-11 is having thrust on Infrastructure, boosted
investors community a lot. We believe in medium to long term domestic indices seems to be highly promising for 40% to 60% return at current levels
though global sentiments still a cause of concern. In the short term markets seems to be typically range bound to 4650-5370 with cautiously
optimistic approach. Hence any correction in near term should be used a decent opportunity to go long.
However at its highest levels of 5230 and above 17500 on Sensex, P/E ratio has reached to 22+, which is the maximum figure under normal
circumstances. Only foams can push it higher towards 27-28. Such fizz happened during 2000 and 2008, which were 8 year cyclical tops. Moreover
current move by FED by increasing Discount rate may be an alarm for FII's. Hence clients are advised to trade accordingly with extremely cautious
Nifty Fut Chart
view. On the positive side if we totally rely on the current rally and consider 2008 a retracement year, we might see key benchmark indices to cross
its previous highs of 2008 very soon. With such scenario we may witnessed a long term consolidation (similar in 1992-2003) however such
probability looks sluggish at this point of time.
Please refer to important disclosures at the end of this report For Private circulation Only For Our Clients Only
4
Mansukh Securities and Finance Ltd SEBI Regn No. BSE: INB010985834 / NSE: INB230781431
Office: 306, Pratap Bhavan, 5, Bahadur Shah Zafar Marg, New Delhi-110002 PMS Regn No. INP000002387
Phone: 011-30123450/1/3/5 Fax: 011-30117710 Email: research@moneysukh.com
Website: www.moneysukh.com
5. Weekly Market Outlook
Technicals
SCRIP ABIRLANUVO CMP 879.4
Recommendation BUY Buy Price Near 870-880
Trend BULLISH Stop Loss Below 850
MACD Buy mode First Target 910
ROC Buy mode Second Target 925
RSI Buy mode Time Frame Week
50 Days SMA 871
200 Days SMA 892.38
This stock is looking bullish as it is making higher top and higher bottom
formation after getting support at 780-790 level .Currently this stock has broken
stiff resistance level around 860-870 and tends to move in upward trajectory with
nearby targets at Rs 925.Currenty this stock is trading above the moving averages
(20 DSMA and 50 DSMA) and the technical indicators RSI and MACD shows
bullish momentum in near term. Hence we recomend BUY strategy in this stock.
SCRIP GRASIM IND CMP 2914
Recommendation BUY Buy Price Near 2850-2900
Trend BULLISH Stop Loss Below 2750
MACD Buy mode First Target 3050
ROC Buy mode Second Target 3150
RSI Buy mode Time Frame Week
50 Days SMA 2731
200 Days SMA 2545
This stock shows strength as it is continued bullish trend after getting support at
2050-2100 levels for previous weeks sessions. Currently stock has shown
tremendous support around 2850-2900 level and trading above all the three
moving averages 20 DSMA, 50 DSMA and 200 DSMA with all the daily
indicators i.e. MACD and RSI seems to be in bullish shape. Hence we
recommend 'BUY' strategy in this stock for the price target of 3050-3150 in near
term.
SCRIP GODREJ IND CMP 147.7
Recommendation SELL Buy Price Near 148-150
Trend BEARISH Stop Loss Above 155
MACD SELL mode First Target 143
ROC SELL mode Second Target 140
RSI SELL mode Time Frame Week
50 Days SMA 155
200 Days SMA 167
This stock is undoubtedly in a prolong downtrend and facing alot of resistance in
the range of 215-220. If the market will correct on profit booking concern the stock
will easily meet its target. Currently, this stocks price is below both the moving
average 50 DEMA & 100 DEMA. All the Daily indicators ROC, RSI and MACD
are looking bearish.
5
Mansukh Securities and Finance Ltd SEBI Regn No. BSE: INB010985834 /NSE: INB230781431
Office: 306, Pratap Bhavan, 5, Bahadur Shah Zafar Marg, New Delhi-110002 PMS Regn No. INP000002387
Phone: 011-30123450/1/3/5 Fax: 011-30117710 Email: research@moneysukh.com
Website: www.moneysukh.com
8. Weekly Market Outlook
EQUITY CALLS PERFORM ANCE FOR W EEK ENDED 12th M ar 2010
Total No. of Calls Target Achieved Profit Booked Positional/Hold Exit/Stop Loss Success Rate
53 9 26 8 10 77.78%
Research Desk Phone: 011-30211872/73 Email: research@moneysukh.com
NAME DESIGNATION E-MAIL
Varun Gupta Head - Research varungupta@moneysukh.com
Pashupati Nath Jha Research Analyst pashupatinathjha@moneysukh.com
Ajay Lakra Research Analyst ajaylakra@moneysukh.com
Vikram Singh Research Analyst vikram_research@moneysukh.com
This report is for the personal information of the authorized recipient and does not construe to be any investment, legal or taxation advice to you.
Mansukh Securities and Finance Ltd (hereinafter referred as MSFL) is not soliciting any action based on it. This report is not for public distribution
and has been furnished to you solely for your information and should not be reproduced or redistributed to any person in any form.
The report is based upon information that we consider reliable, but we do not represent that it is accurate or complete. MSFL or any of its affiliates
or employees shall not be in any way responsible for any loss or damage that may arise to any person from any inadvertent error in the information
contained in this report. MSFL or any of its affiliates or employees do not provide, at any time, any express or implied warranty of any kind,
regarding any matter pertaining to this report, including without limitation the implied warranties of merchantability, fitness for a particular
purpose, and non-infringement. The recipients of this report should rely on their own investigations.
MSFL and/or its affiliates and/or employees may have interests/positions, financial or otherwise in the securities mentioned in this report. This
information is subject to change without any prior notice. MSFL reserves the right to make modifications and alterations to this statement as may
be required from time to time. Nevertheless, MSFL is committed to providing independent and transparent recommendations to its clients, and
would be happy to provide information in response to specific client queries.
9
Mansukh Securities and Finance Ltd SEBI Regn No. BSE: INB010985834 / NSE: INB230781431
Office: 306, Pratap Bhavan, 5, Bahadur Shah Zafar Marg, New Delhi-110002 PMS Regn No. INP000002387
Phone: 011-30123450/1/3/5 Fax: 011-30117710 Email: research@moneysukh.com
Website: www.moneysukh.com