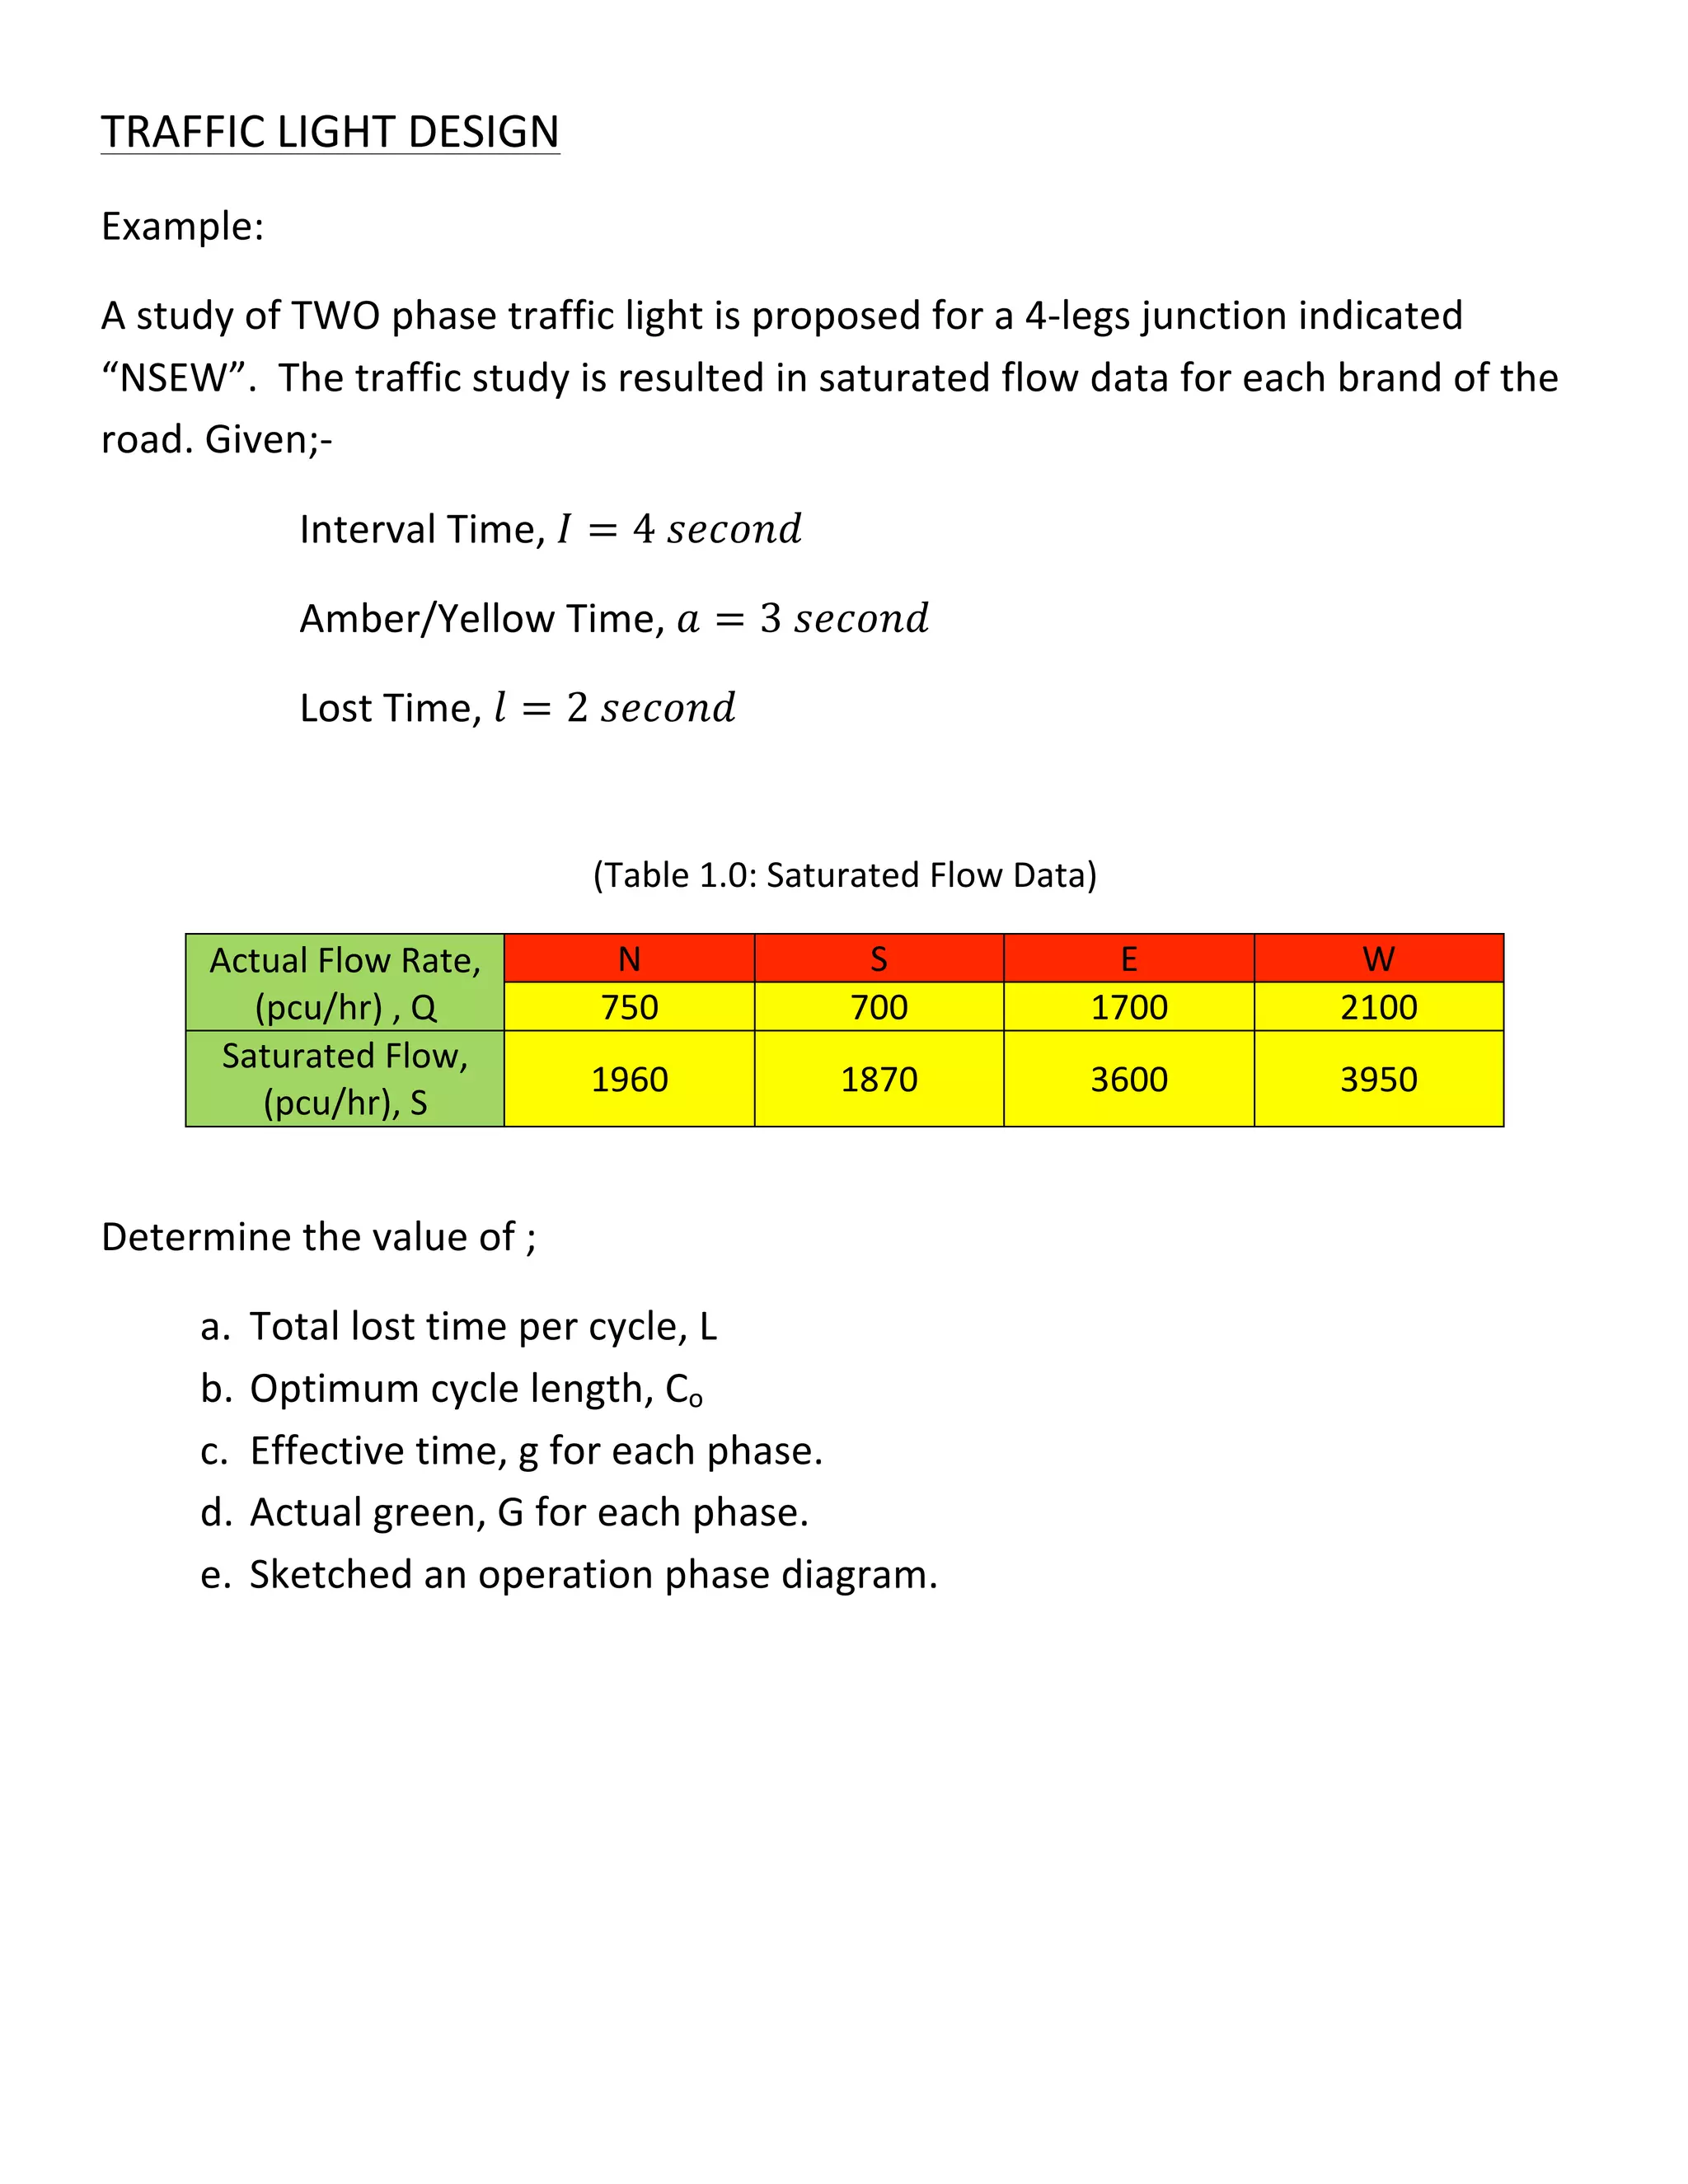
TRAFFIC
LIGHT
DESIGN

Example:

A
study
of
TWO
phase
traffic
light
is
proposed
for
a
4‐legs
junction
indicated

“NSEW”.

The
traffic
study
is
resulted
in
saturated
flow
data
for
each
brand
of
the

road.
Given;‐

Interval
Time, 𝐼 = 4 𝑠𝑒𝑐𝑜𝑛𝑑


Amber/Yellow
Time,
𝑎 = 3 𝑠𝑒𝑐𝑜𝑛𝑑

Lost
Time,
𝑙 = 2 𝑠𝑒𝑐𝑜𝑛𝑑


(Table
1.0:
Saturated
Flow
Data)

Actual
Flow
Rate,

(pcu/hr)
,
Q

N
 S
 E
 W

750
 700
 1700
 2100

Saturated
Flow,

(pcu/hr),
S

1960
 1870
 3600
 3950


Determine
the
value
of
;

a. Total
lost
time
per
cycle,
L

b. Optimum
cycle
length,
Co

c. Effective
time,
g
for
each
phase.

d. Actual
green,
G
for
each
phase.

e. Sketched
an
operation
phase
diagram.


The
solution

Step
1:
Saturated
flow
table.


 NS
 EW

N
 S
 E
 W

Actual
Flow
Rate,

(pcu/hr)
,
Q

750
 700
 1700
 2100

Saturated
Flow,

(pcu/hr),
S

1960
 1870
 3600
 3950


y
value
=
Q/S
 0.38
 0.37
 0.47
 0.53

ymax

0.38
 0.53


 Critical
flow
ratio,


𝑌 = 𝑌!"#


= 0.38 + 0.53


 = 0.91


a. The
total
lost
time
per
cycle,
L


 𝐿 =  𝐼 − 𝑎 + 𝑙


= 4 − 3 + 4 − 3 + 2 + 2 


= 6 𝑠𝑒𝑐𝑜𝑛𝑑


b. 
The
optimum
cycle
length,
Co

  𝐶! = 
1.5𝐿 + 5
1 − 𝑌


= 
!.!(!)!!
!!(!.!")

 =
155.56
second
>
Co
(120
s)


 Therefore,


Co
should
be
120
second


c. The
effective
time,
g

for
each
phase


𝑔 =
!!"#
!
(𝐶! − 𝐿)


 NS
phase


 EW
phase


𝑔!" =
!!"#
!
(𝐶! − 𝐿)


𝑔!" =
!!"#
!
(𝐶! − 𝐿)


=
!.!"
!.!"
(120 − 6)


=
!.!"
!.!"
(120 − 6)


= 47.60 𝑠𝑒𝑐𝑜𝑛𝑑


= 66.40 𝑠𝑒𝑐𝑜𝑛𝑑 


d. The
actual
green,
G
for
each
phase


𝐺 = 𝑔 + 𝑙 − 𝑎

NS
phase


 EW
phase

𝐺!" = 𝑔 + 𝑙 − 𝑎


𝐺!" = 𝑔 + 𝑙 − 𝑎


= 47.60 + 2 − 3


= 66.40 + 2 − 3


= 46.60 𝑠𝑒𝑐𝑜𝑛𝑑


= 65.40 𝑠𝑒𝑐𝑜𝑛𝑑


~ 47 𝑠𝑒𝑐𝑜𝑛𝑑


~ 65 𝑠𝑒𝑐𝑜𝑛𝑑


f. The
operation
phase
diagram.


G

R

R

a
=
3s


I
=
4s


a
=
3s


I
=
4s


NS
phase


EW
phase


Start
=
0s

 Co
=
120s

47s

 50s


51s

 116s

 119s


G

65s


Traffic light design

  • 1.
    TRAFFIC
LIGHT
DESIGN
 Example:
 A
study
of
TWO
phase
traffic
light
is
proposed
for
a
4‐legs
junction
indicated
 “NSEW”.

The
traffic
study
is
resulted
in
saturated
flow
data
for
each
brand
of
the
 road.
Given;‐
 Interval
Time, 𝐼 = 4 𝑠𝑒𝑐𝑜𝑛𝑑


 Amber/Yellow
Time,
𝑎 = 3 𝑠𝑒𝑐𝑜𝑛𝑑
 Lost
Time,
𝑙 = 2 𝑠𝑒𝑐𝑜𝑛𝑑
 
 (Table
1.0:
Saturated
Flow
Data)
 Actual
Flow
Rate,
 (pcu/hr)
,
Q
 N
 S
 E
 W
 750
 700
 1700
 2100
 Saturated
Flow,
 (pcu/hr),
S
 1960
 1870
 3600
 3950
 
 Determine
the
value
of
;
 a. Total
lost
time
per
cycle,
L
 b. Optimum
cycle
length,
Co
 c. Effective
time,
g
for
each
phase.
 d. Actual
green,
G
for
each
phase.
 e. Sketched
an
operation
phase
diagram.


  • 2.
    The
solution
 Step
1:
Saturated
flow
table.
 
 NS
 EW
 N
S
 E
 W
 Actual
Flow
Rate,
 (pcu/hr)
,
Q
 750
 700
 1700
 2100
 Saturated
Flow,
 (pcu/hr),
S
 1960
 1870
 3600
 3950
 
y
value
=
Q/S
 0.38
 0.37
 0.47
 0.53
 ymax
 0.38
 0.53
 
 
 Critical
flow
ratio,


𝑌 = 𝑌!"#


= 0.38 + 0.53


 = 0.91
 
 a. The
total
lost
time
per
cycle,
L


 𝐿 =  𝐼 − 𝑎 + 𝑙


= 4 − 3 + 4 − 3 + 2 + 2 


= 6 𝑠𝑒𝑐𝑜𝑛𝑑
 
 b. 
The
optimum
cycle
length,
Co
   𝐶! =  1.5𝐿 + 5 1 − 𝑌 


=  !.!(!)!! !!(!.!") 
 =
155.56
second
>
Co
(120
s)

 
 Therefore,


Co
should
be
120
second

  • 3.
    
 
 c. The
effective
time,
g

for
each
phase


𝑔 = !!"# ! (𝐶!− 𝐿)
 
 
 NS
phase


 EW
phase


𝑔!" = !!"# ! (𝐶! − 𝐿)


𝑔!" = !!"# ! (𝐶! − 𝐿)


= !.!" !.!" (120 − 6)


= !.!" !.!" (120 − 6)


= 47.60 𝑠𝑒𝑐𝑜𝑛𝑑


= 66.40 𝑠𝑒𝑐𝑜𝑛𝑑 
 
 d. The
actual
green,
G
for
each
phase


𝐺 = 𝑔 + 𝑙 − 𝑎
 NS
phase


 EW
phase
 𝐺!" = 𝑔 + 𝑙 − 𝑎


𝐺!" = 𝑔 + 𝑙 − 𝑎


= 47.60 + 2 − 3


= 66.40 + 2 − 3


= 46.60 𝑠𝑒𝑐𝑜𝑛𝑑


= 65.40 𝑠𝑒𝑐𝑜𝑛𝑑


~ 47 𝑠𝑒𝑐𝑜𝑛𝑑


~ 65 𝑠𝑒𝑐𝑜𝑛𝑑


  • 4.