Elastic and Dynamic analysis of a multistorey frame
LESETLHE 14001578
1. BY THABO LESETLHE
14001578
INTRODUCTION
The Italian 58m long, 14 500 metric tonnes Tower Of Pisa was constructed from 1173-1370 (197 years). Its purpose was to
house the bells of the cathedral of the Piazza dei Miracoli. Just after the construction of its first three levels, a slight tilt was
noticed, and from this moment on, the Tower had begun to lean southward at the rate of about 1.2 mm per year (from 1360-
1370). It has been found that about 10,000 years ago, in the location of the Tower was a river estuary (Arno River), hence the
place constitutes deposits of layers of soft sand, clay and silt. Its largest angle of tilt was 5.50 by 1990. Its uneven settling posed
a hazard to the public and surrounding structures and hence closed from public use until May 2001.
GROUND PROFILE UNDER THE TOWER OF PISA
These layers are underbedded by a stiff sand called C1 in horizon C that can be
treated as a natural boundary. More detailed information about the subsoil in
Pisa is given by Calabresi (1996).
CAUSE OF THE LEANING
The Leaning of the Tower of Pisa is due primarily to the location of the tower on the unstable ground underneath
the foundation which led to its differential or uneven settling over time. The weight of the tower compressed the
ground beneath beginning with 7 meters layer of silt and 30 meters of clay under the foundation. The reason the
Tower tilts southward is because the soil under the south side of the tower is more compressible or softer than on
the north side. Due to the creep deformation of clays deposited in the form of unevenly distributed lenses in the
sandy base, the tower settled and tilted to one side. Further depression of the clay below the foundation is a result
of consolidation.
3D CREEPANALYSIS OF THE DIFFERENTIAL SETTLING OF THE TOWER
FIRST PHASE OF CONSTRUCTION
FROM 1173 TO 1178
Average foundation pressure = 323 kPa,
Maximum excess pore pressure = 74 kPa,
Average settlement = 46 cm, The resulting
inclination = 0.22° .
After the 94 years of construction pause up to
1272. Further deformations took place due to
pure creep under constant effective stresses;
Average settlement = 1.25, Computed
inclination = 0.38°.
SECOND PHASE OF
CONSTRUCTION FROM 1272 TO
1278
Average foundation pressure = 473 kPa,
Average settlement = 1.74 m, The inclination
was computed to be 1.05°. After a long
construction pause of 82 years up to 1360,
there was a; Computed average settlement of
2.55 m and an inclination of 2.62°.
• A.G.I. (1991), The leaning tower of Pisa – Present situation, In A.G.I. (Eds.) Proceedings of the 10th ECSMFE, Volume 4: 1437-144, Florence, A.A. Balkema
• Berardi, G., Caroti, L., Giunta, G., Jamiolkoeski, M. & Lancellotta, R. (1991), Mechanical properties of Upper Pisa Clay, In A.G.I. (Eds.), Proceedings of the 10th ECSMFE, Volume 1: 7-10, Florence, A.A. Balkema
• Brinkgreve, R.B.J. & Vermeer, P.A. (Eds.) (1998), PLAXIS Finite Element Code for Soil and Rock Analyses, Version 7, A.A. Balkema
• Burland, J.B. & Potts, D.M. (1994), Development and application of a numerical model for the leaning tower of Pisa, In Shibuya, S., Mitachi, T. & Miura, S. (Eds.), Proceedings of 1st Int. Conf. on Pre-failure Deformation of Geomaterials, Volume 2: 715-738, Sapporo, A.A. Balkema
• Calabresi G., Rampello S. and Callisto L. (1993), The Leaning Tower of Pisa: Geotechnical Characterisation of the Tower´s Subsoil within the Framework of Critical State Theory, Università degli studi di Roma “La Sapienza”, Dipartimento di Ingegneria Strutturale e Geotecnica, Studi e Ricerche 1/93-2/93
THIRD CONSTRUCTION PHASE (BELL CHAMBER)
FROM 1360 TO 1370
Average foundation pressure is 496 kPa, the average
settlement is 2.60 m and the inclination of the tower is
computed to be 2.81°.
This 3D creep model shows
excess pore pressures
directly after the end of the
construction of the bell
chamber. The red zone has a
maximum excess pore
pressure of 3 kPa; the
average settlement is 2.60
m; the inclination is 2.81°.
This model shows
excess pore pressure
at the end of the first
construction phase.
The red zone has a
maximum excess pore
pressure of 74 kPa;
the average
settlement is 0.46 m;
the inclination is
0.22°.
This 3D creep model
shows excess pore
pressure at the end
of the second
construction phase.
The red zone has a
maximum excess
pore pressure of 59
kPa; the average
settlement is 1.74 m;
the inclination is
1.05°.
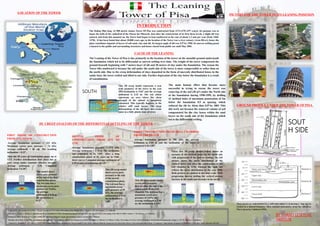
These two 3D creep models below shows an
increase of the vertical stress on the south side
with progression of the uneven settling. The left
picture shows the stress distribution of the
vertical stress just after the construction of the
bell chamber in 1370, whereas the right one
reflects the stress distribution in the year 1838.
Both pictures are plotted in the same scale. With
progressing uneven settling the vertical stresses
increase in the south and decrease in the north.
LOCATION OF THE TOWER
PICTURES OF THE TOWER IN ITS LEANING POSITION
This 3D creep model represents a true
scale geometry of the tower in the year
1993.Inclination is 5.02° and the average
settlement is 3.22 m. The red colour
represents an area where the shear
strength of the subsoil is completely
exhausted. This typically happens in the
relative stiff sand layers. The large
deformations of the silt layer also create
zones in a fully plastic state of stress
The main human effort that become more
successful in trying to rescue the tower was
removing of the soil (38 m3) under the North side
of the foundation during 1998-1999, by drilling
41 inclined holes of maximum penetration of 2m
below the foundation 0.5 m spacing, which
reduced the tilt by 44cm thus 0.50 by 2001 This
did work out because the removed volume of soil
compensated for the clay lenses within the sand
layers on the south side of the foundation which
led to the differential settling.
SOUT
H SIDE
SOUTH