1. 1secondtraveltime
Metamorphic
basement?
Lower Cretaceous
unconformities
Near-Base Cretaceous
K1
K2
K3
Diapir?
Rotational slump
Mass failure features
Cretaceous
fault
SW NE
Early Cretaceous
depocentre
Figure 6. Line diagram of southernmost remnant sequences.
10 km
Syn-riftUpper Cretaceous Chalk Group
Aptian (?) – Upper Cretaceous
Lower Cretaceous basin fill
Lower Cretaceous remnant
Middle & Upper Jurassic
1secondtraveltime
100 km
A
B
C
DE
35/19-1
35/30-1
North Porcupine Basin
South Porcupine
Basin
Moling
sub-basin
43/13-1
44/23-1
50°N
Figure 4. Location map of Near-Base Cretaceous unconformity
time structure.
1
5
4
2
3
0
2.0
TWT(seconds)
4.0
6.0
8.0
Figure 2
Main basin
Irish Mainland
Shelf
Porcupine
High
35/29-1
35/21-1
34/19-1
34/15-1
35/18-1
35/13-1
35/8-1
35/8-2
36/16-1A
35/2-1
34/5-1A
35/15-1
35/6-1
26/30-1
26/28-1
Figure 9
Figure 8
35/18-1
26/21-1
62/7-1
Wells
Sub-basin
North
K1
K4
K2
K3
Carboniferous (?)
– Triassic (?)
Metamorphic
basement (?)
SW NE
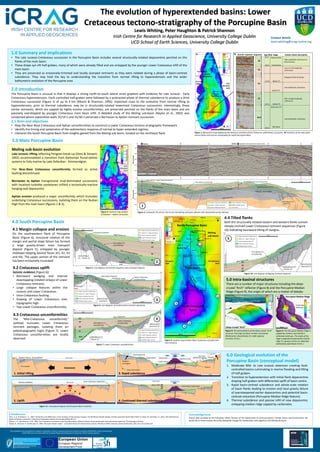
Figure 10. Line diagram of dipping remnant sequence.
Intra-Aptian (?)
unconformity
5 km
1secondtraveltime
Upper Cretaceous Chalk Group
Aptian (?) – Upper Cretaceous
Lower Cretaceous basin fill
Lower Cretaceous remnant
Middle & Upper Jurassic
W E
Rotated
slide
Carboniferous
(?) – Triassic (?)
K1
K4
K2
K3
Figure 5. Line diagram of remnant sequence mass transport deposit.
1secondtraveltime
5 km
Folds
Intra-Aptian (?)
unconformity
Upper Cretaceous Chalk Group
Aptian (?) – Upper Cretaceous
Lower Cretaceous basin fill
Lower Cretaceous remnant
Middle & Upper Jurassic
3.0
3.5
4.0
4.5
5.0
3.0
3.5
4.0
4.5
5.0
Upper Cretaceous Chalk Group
Aptian – Upper Cretaceous
Lower Cretaceous basin fill
Lower Cretaceous remnant
Middle & Upper Jurassic
Pre-Jurassic
Carboniferous (?)
– Triassic (?)
TWT(seconds)TWT(seconds)
Oxfordian - Kimmeridgian
35/19-1 (located 1.8 km east from seismic line)
Mid-Jurassic (?)
A B C D E F
A B C D E F
Cenomanian – Lower Campanian absent
Tithonian absent
Re-worked Hauterivian & Barremian
5 km
5 km
Figure 3. Composite 2D seismic line across the Moling sub-basin (above) with interpreted section (below).
Intra-Aptian unconformity
Base Barremian (?)
35/30-1
Main basin
fill
The evolution of hyperextended basins: Lower
Cretaceous tectono-stratigraphy of the Porcupine Basin
Lewis Whiting, Peter Haughton & Patrick Shannon
Irish Centre for Research in Applied Geoscience, University College Dublin
UCD School of Earth Sciences, University College Dublin
Moling sub-basin evolution
Late Jurassic rifting reflecting Pangean break-up (Dore & Stewart,
2002) accommodated a transition from Bathonian fluvial-deltaic
systems to fully marine by Late Oxfordian - Kimmeridgian.
The Near-Base Cretaceous unconformity formed as active
faulting discontinued.
Berriasian to Aptian transgressive mud-dominated successions
with localised turbidite sandstones infilled a tectonically-inactive
hanging wall depocentre.
Aptian erosion produced a major unconformity which truncates
underlying Cretaceous successions, isolating them on the Rudian
High from the main basin (figures 2 & 3).
4.0 South Porcupine Basin
4.1 Margin collapse and erosion
On the southwestern flank of Porcupine
Basin (Figure 4), structural rotation of the
margin and partial slope failure has formed
a large gravity-driven mass transport
deposit (Figure 5), onlapped by younger
shallower-dipping basinal facies (K1, K2, K3
and K4). The upper section of the remnant
has been erosionally-truncated.
3.0 Main Porcupine Basin
4.4 Tilted flanks
Both the structurally rotated eastern and western flanks contain
steeply-inclined Lower Cretaceous remnant sequences (Figure
10) indicating basinward tilting of margins.
4.3 Cretaceous unconformities
The "Mid-Cretaceous unconformity"
(yellow) truncates Lower Cretaceous
remnant packages, isolating them on
paleotopographic highs (Figure 7). Lower
Cretaceous unconformities are locally
observed.
2.0 Introduction
The Porcupine Basin is unusual in that it displays a strong north-to-south lateral strain gradient with evidence for Late Jurassic - Early
Cretaceous hyperextension. Fault controlled half-graben were followed by a protracted phase of thermal subsidence to produce a thick
Cretaceous succession (Figure 1) of up to 4 km (Moore & Shannon, 1995). Important clues to the evolution from normal rifting to
hyperextension, prior to thermal subsidence, may be in structurally-rotated lowermost Cretaceous successions. Interestingly, these
earlier remnants, which are capped by highly erosive unconformities, are preserved perched on the flanks of the main basin and are
passively overstepped by younger Cretaceous main basin infill. A detailed study of the Moling sub-basin (Naylor et al., 2002) was
conducted where exploration wells 35/19-1 and 35/30-1 penetrate a Berriasian to Aptian remnant succession.
2.1 Aims and objectives
• Map the Near-Base Cretaceous and Aptian unconformities to construct a Lower Cretaceous tectono-stratigraphic framework.
• Identify the timing and systematics of the sedimentary response of normal to hyper-extended regimes.
• Interpret the South Porcupine Basin from insights gained from the Moling sub-basin, located on the northeast flank.
4.2 Cretaceous uplift
Seismic evidence (Figure 6):
• Basinward wedging and internal
downlapping (rotated onlaps) of Lower
Cretaceous remnants.
• Large collapse features within the
Jurassic and Lower Cretaceous.
• Intra-Cretaceous faulting.
• Draping of Lower Cretaceous over
topographic high.
• Two Lower Cretaceous unconformities.
1.0 Summary and implications
• The Late Jurassic-Cretaceous succession in the Porcupine Basin includes several structurally-rotated depocentres perched on the
flanks of the main basin.
• These drape syn-rift half-graben, many of which were already filled and are onlapped by the younger Lower Cretaceous infill of the
main basin.
• They are preserved as erosionally-trimmed and locally slumped remnants as they were rotated during a phase of basin-centred
subsidence. They may hold the key to understanding the transition from normal rifting to hyperextension and the wider
bathymetric evolution of the Porcupine area.
This publication has emanated from research supported in part by a research grant from Science Foundation Ireland (SFI) under Grant Number
13/RC/2092 and co-funded under the European Regional Development Fund and by iCRAG industry partners.
6.0 References
Dore, A. G. & Stewart, I. C., 2002. Similarities and differences in the tectonics of two passive margins: the Northeast Atlantic Margin and the Australian North West Shelf. In: Keep, M. and Moss, S.J. (Eds.) The Sedimentary
Basins of Western Australia 3. Petroleum Exploration Society of Australia (PESA), 89-117.
Moore, J. G. and Shannon, P. M., 1995. The Cretaceous succession in the Porcupine Basin, offshore Ireland: facies distribution and hydrocarbon potential, The Geological Society.
Naylor, D., Shannon, P. and Murphy, N., 2002. Porcupine-Goban region - a standard structural nomenclature system, Petroleum Affairs Division; Special Publication 1/02, 65 p. & 2 enclosures.
6.0 Geological evolution of the
Porcupine Basin (conceptual model)
1. Moderate Mid- to Late Jurassic extension creating fault-
controlled basins culminating in marine flooding and filling
of half-graben.
2. Transition to hyperextension with initial flank depocentres
draping half-graben with differential uplift of basin centre.
3. Rapid basin-centred subsidence and whole-scale rotation
of basin flanks leading to erosion and local gravity failure
of oversteepened earlier depocentres and potential basin-
centred volcanism (Porcupine Median Ridge feature).
4. Thermal subsidence and passive infill of new depocentre,
onlapping median ridge capped by carbonates.
Contact details
lewis.whiting@icrag-centre.org
3
5.0 Intra-basinal structures
There are a number of major structures including the deep-
crustal “Arch” reflector (Figure 8) and the Porcupine Median
Ridge (Figure 9), the origin of which are a matter of debate.
Figure 11. Conceptual diagram of Porcupine Basin evolution.
Acknowledgements
Project data provided by the Petroleum Affairs Division of the Department of Communications, Climate Action and Environment. We
would like to thank Andrew McCarthy (Woodside Energy) for collaboration with regards to the Moling sub-basin.
1
1.0
0.6
Thickness(seconds)
0.4
0.2
0
0.8
Irish
Mainland
Shelf
Main basin
Remnant
packages
Figure 2. Isochron map of Base
Cretaceous – Aptian succession.
Main
basin
North
35/30-1
35/19-1
Wells
35/29-1
35/15-1
35/13-1
35/18-1
25 km
NW SE
Upper Cretaceous Chalk Group
Aptian (?) – Upper Cretaceous
Lower Cretaceous basin fill
Lower Cretaceous remnant
Middle & Upper Jurassic
K0.5
K1
K4
K2
K3
5 km
Carboniferous (?)
– Triassic (?)
Metamorphic
basement (?)
Lower Cretaceous
unconformity
Figure 7. Lower Cretaceous unconformities.
Intra-Aptian (?)
unconformity
1secondtraveltime
6.5
TWT(seconds)
7.5
8.0
7.0Near-Base Cretaceous unconformity
Deep-crustal “Arch”
Porcupine Median Ridge
Figure 8. 3D representation of the deep-crustal “Arch”
structure, the origin of which remains unresolved
(Mohorovicic discontinuity (?), mafic igneous
intrusion (?) etc.).
North
Carbonate
build-ups
Porcupine Median Ridge
4.6
TWT(seconds)
5.0
4.8
North
Figure 9. The Porcupine Median Ridge is
capped by northern and southern
carbonate build-ups. The origin of the
ridge is disputed (serpentinised mantle
ridge (?), igneous centre (?), detached
sedimentary fault block (?) etc.).
20 km
4
2
5
E
E
1. Initial rifting
Sea-level
2. Uplift 40 km
40 km
High heat flow
W
W
Shallow marine – fluvial/deltaic
Extension
Uplift
Early Cretaceous depositionSea-level
E
E
Marine conditions
Pre-Jurassic
3. Rapid subsidence
Flexure
Slope failure Submarine fans
K1
4. Continued thermal subsidence
K2
K3
K4Basin infills
Fault reactivation
40 km
40 km
Carbonates Erosion
Drowning of carbonates
W E
W E
PMR formsRotation
of margins
Sea-level
Sea-level
Sediment bypass
Oversteepening
Subsidence
Debris flows
Subsidence
Ruadan High
South Porcupine Basin
North Porcupine
Basin
Porcupine
Median Ridge
44/23-1
43/13-1
35/30-1
35/19-1
Moling
sub-basin
Figure 1. A) Isochron map displaying the thickness variation of the Cretaceous sedimentary succession. B) Summary of the main basin
seismic facies and seismic stratigraphy for South Porcupine Basin.
Low-amplitude, continuous
Mid- to high-amplitude,
continuous
Low-amplitude, continuous
High-amplitude continuous to
discontinuous
Polygonal faults & slumps
Low- to mid-amplitude,
continuous
K0.5
K1
K2
K3
K4
500mstraveltime
Seismic response Sequence Age (Ma) Stage Seismic facies description
2.5
1.5
Thickness(seconds)
1.0
0.5
0
2.0
3.0
3.5
Maastrichtian
Aptian (?)
Albian (?)
Berriasian
Barremian (?)
A) B)
100 km
Wells
Irish
Mainland
shelf
Porcupine
High
Cenomanian
Aptian (?)
145.0
125.0
100.5
66.0
113.0
Ruadan High
Erosional truncation