Download as PDF, PPTX


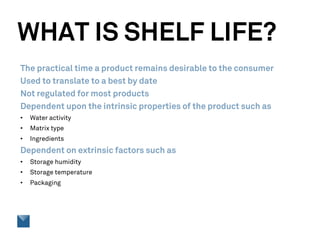
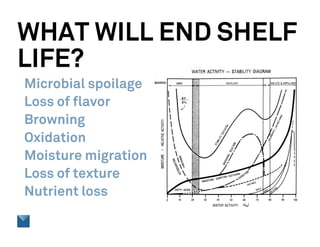
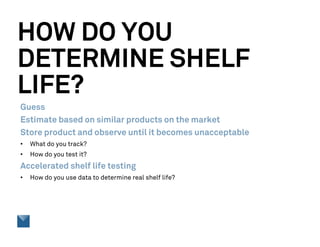
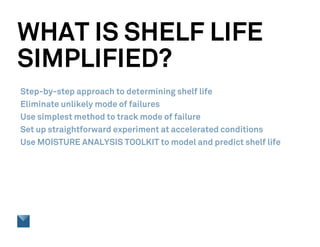
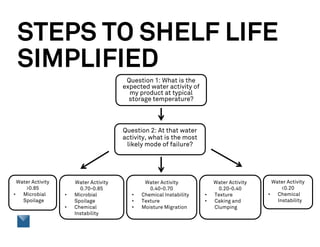
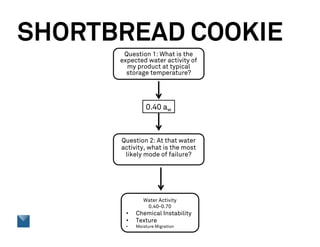
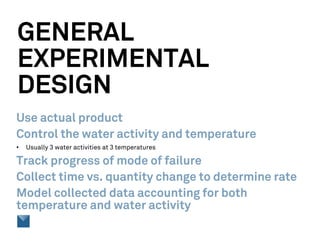
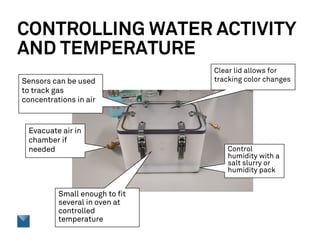
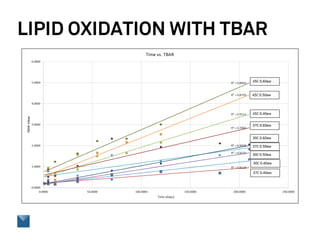
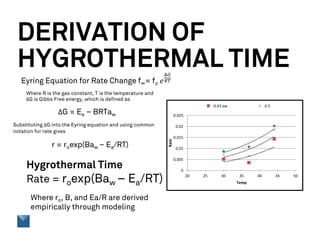
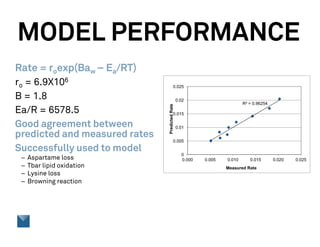
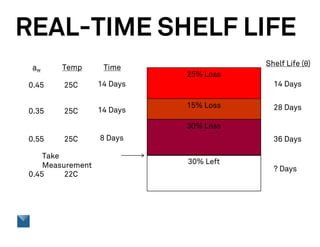
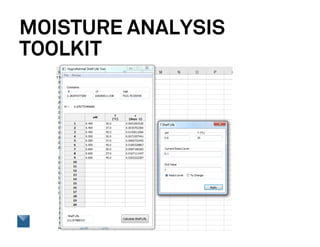
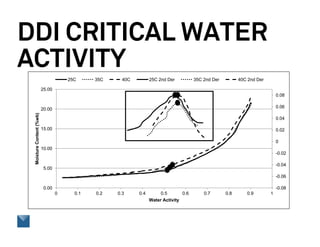
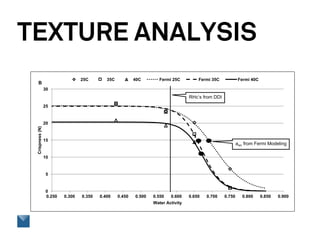
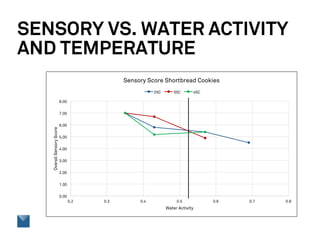
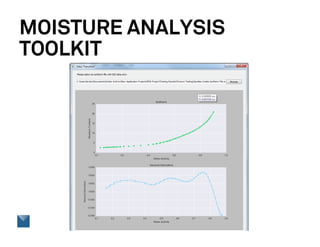
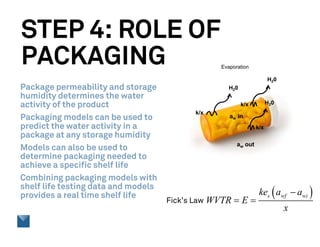
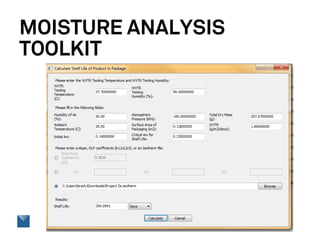


Dr. Brady Carter discusses simplified methods for determining product shelf life, emphasizing the influence of intrinsic properties like water activity and extrinsic factors like temperature and humidity on shelf stability. He outlines a systematic approach for accelerated shelf life testing, highlighting the importance of controlling water activity, tracking mode of failure, and using a moisture analysis toolkit. The presentation also covers the role of packaging in maintaining desired water activity levels and provides guidance for establishing appropriate best by dates based on empirical data.


