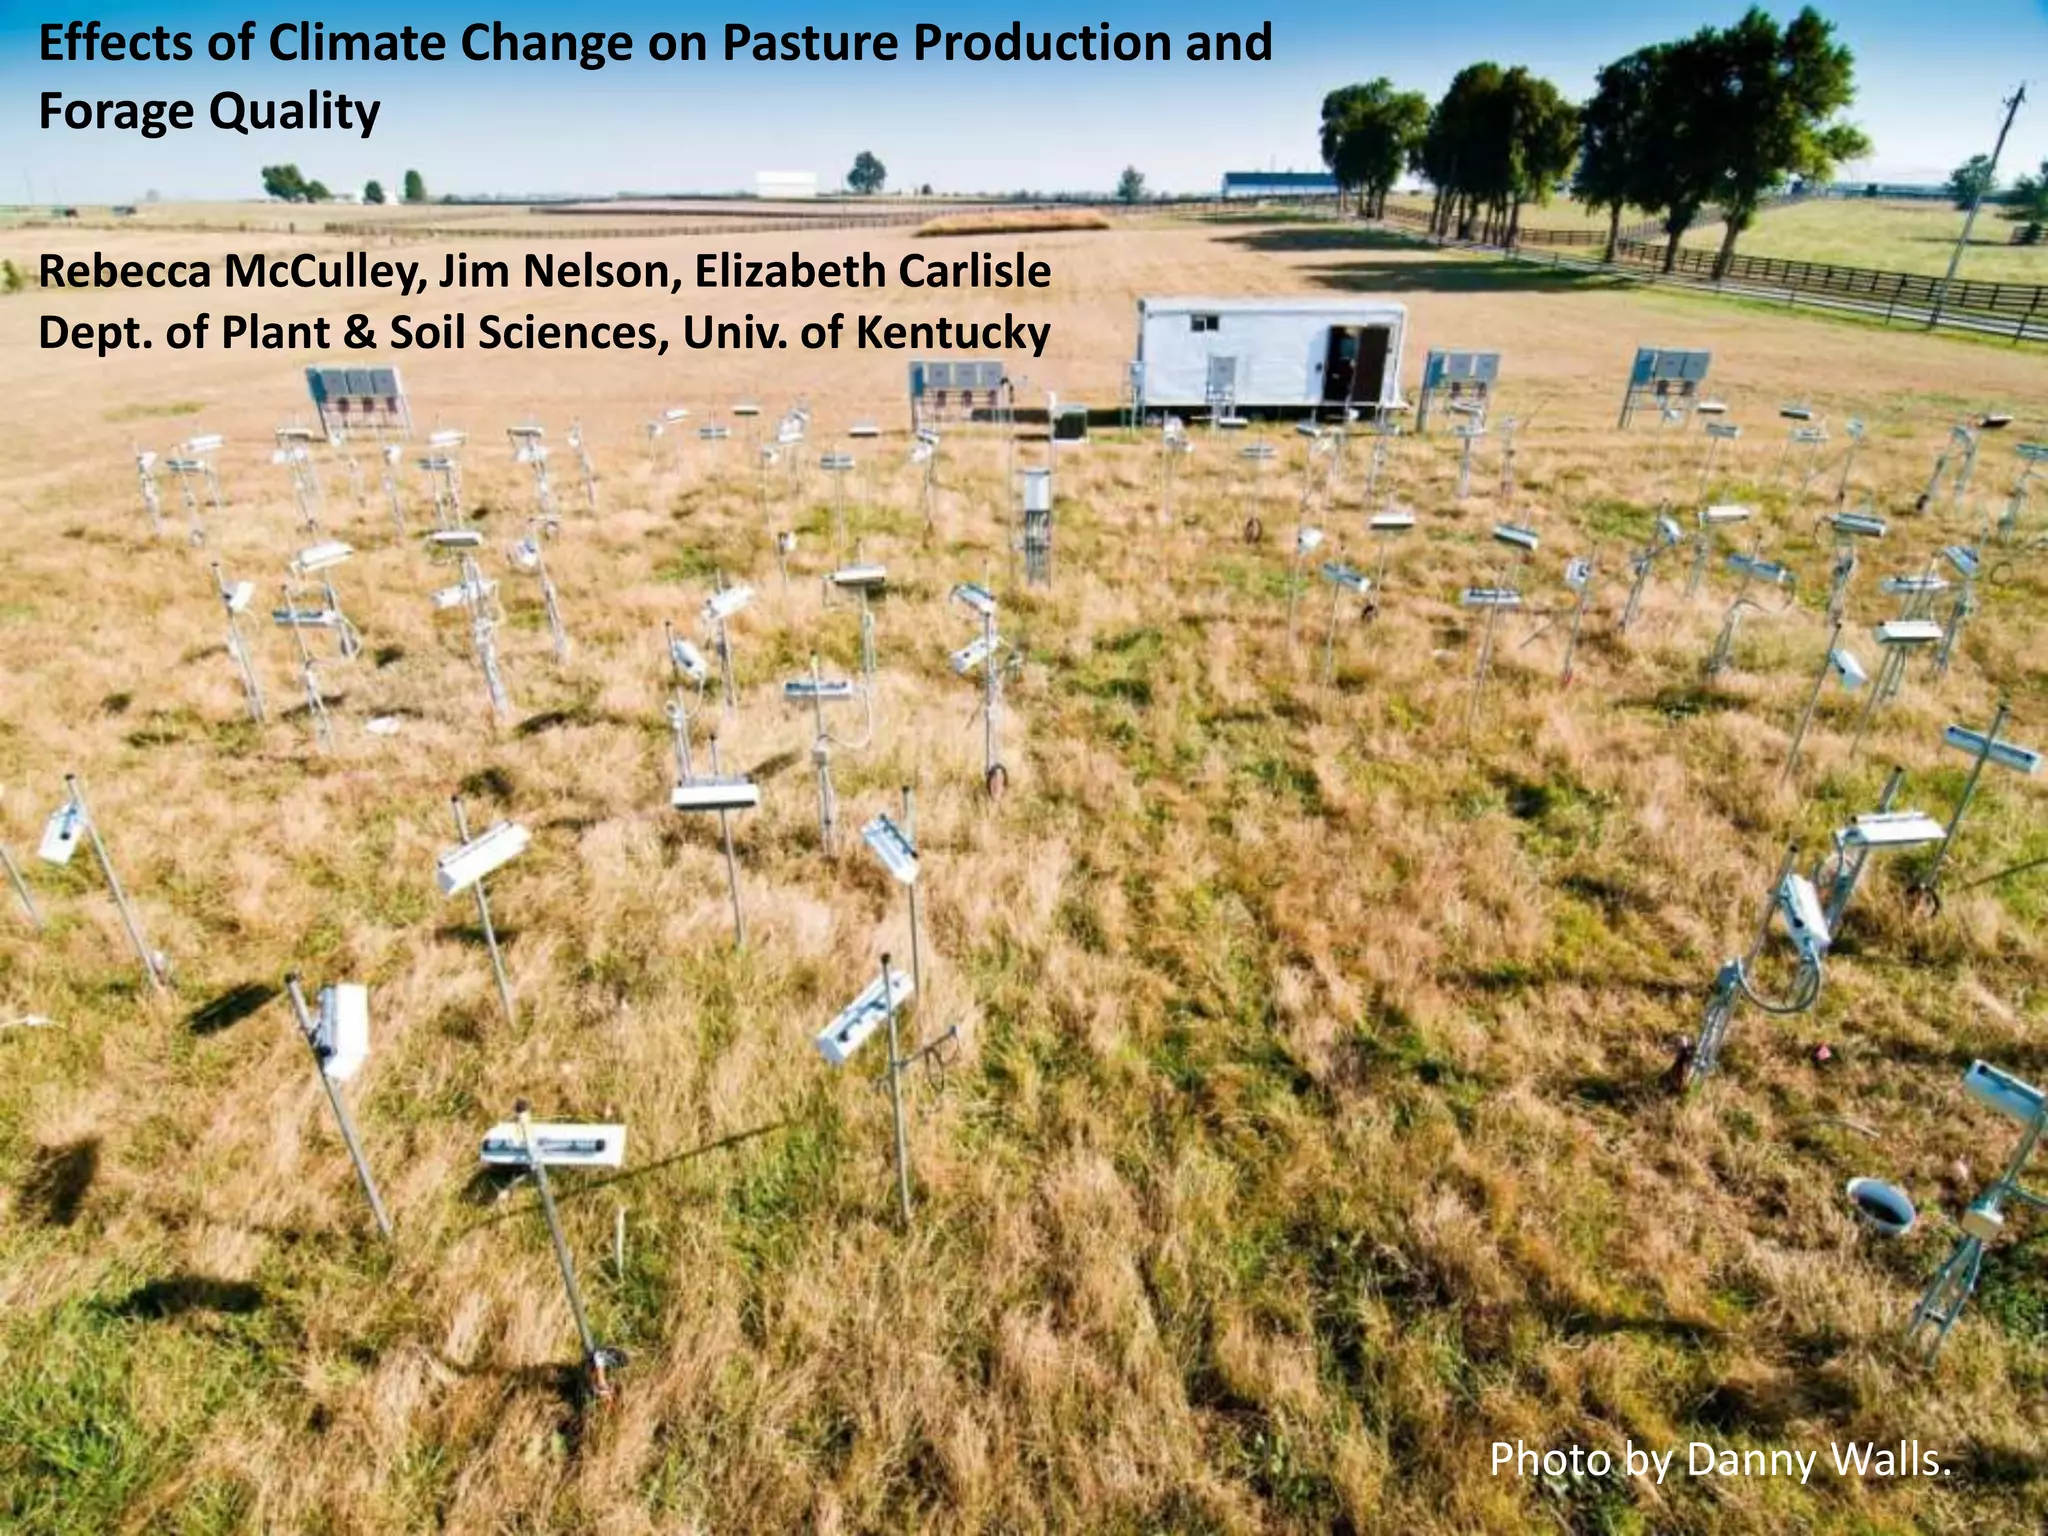
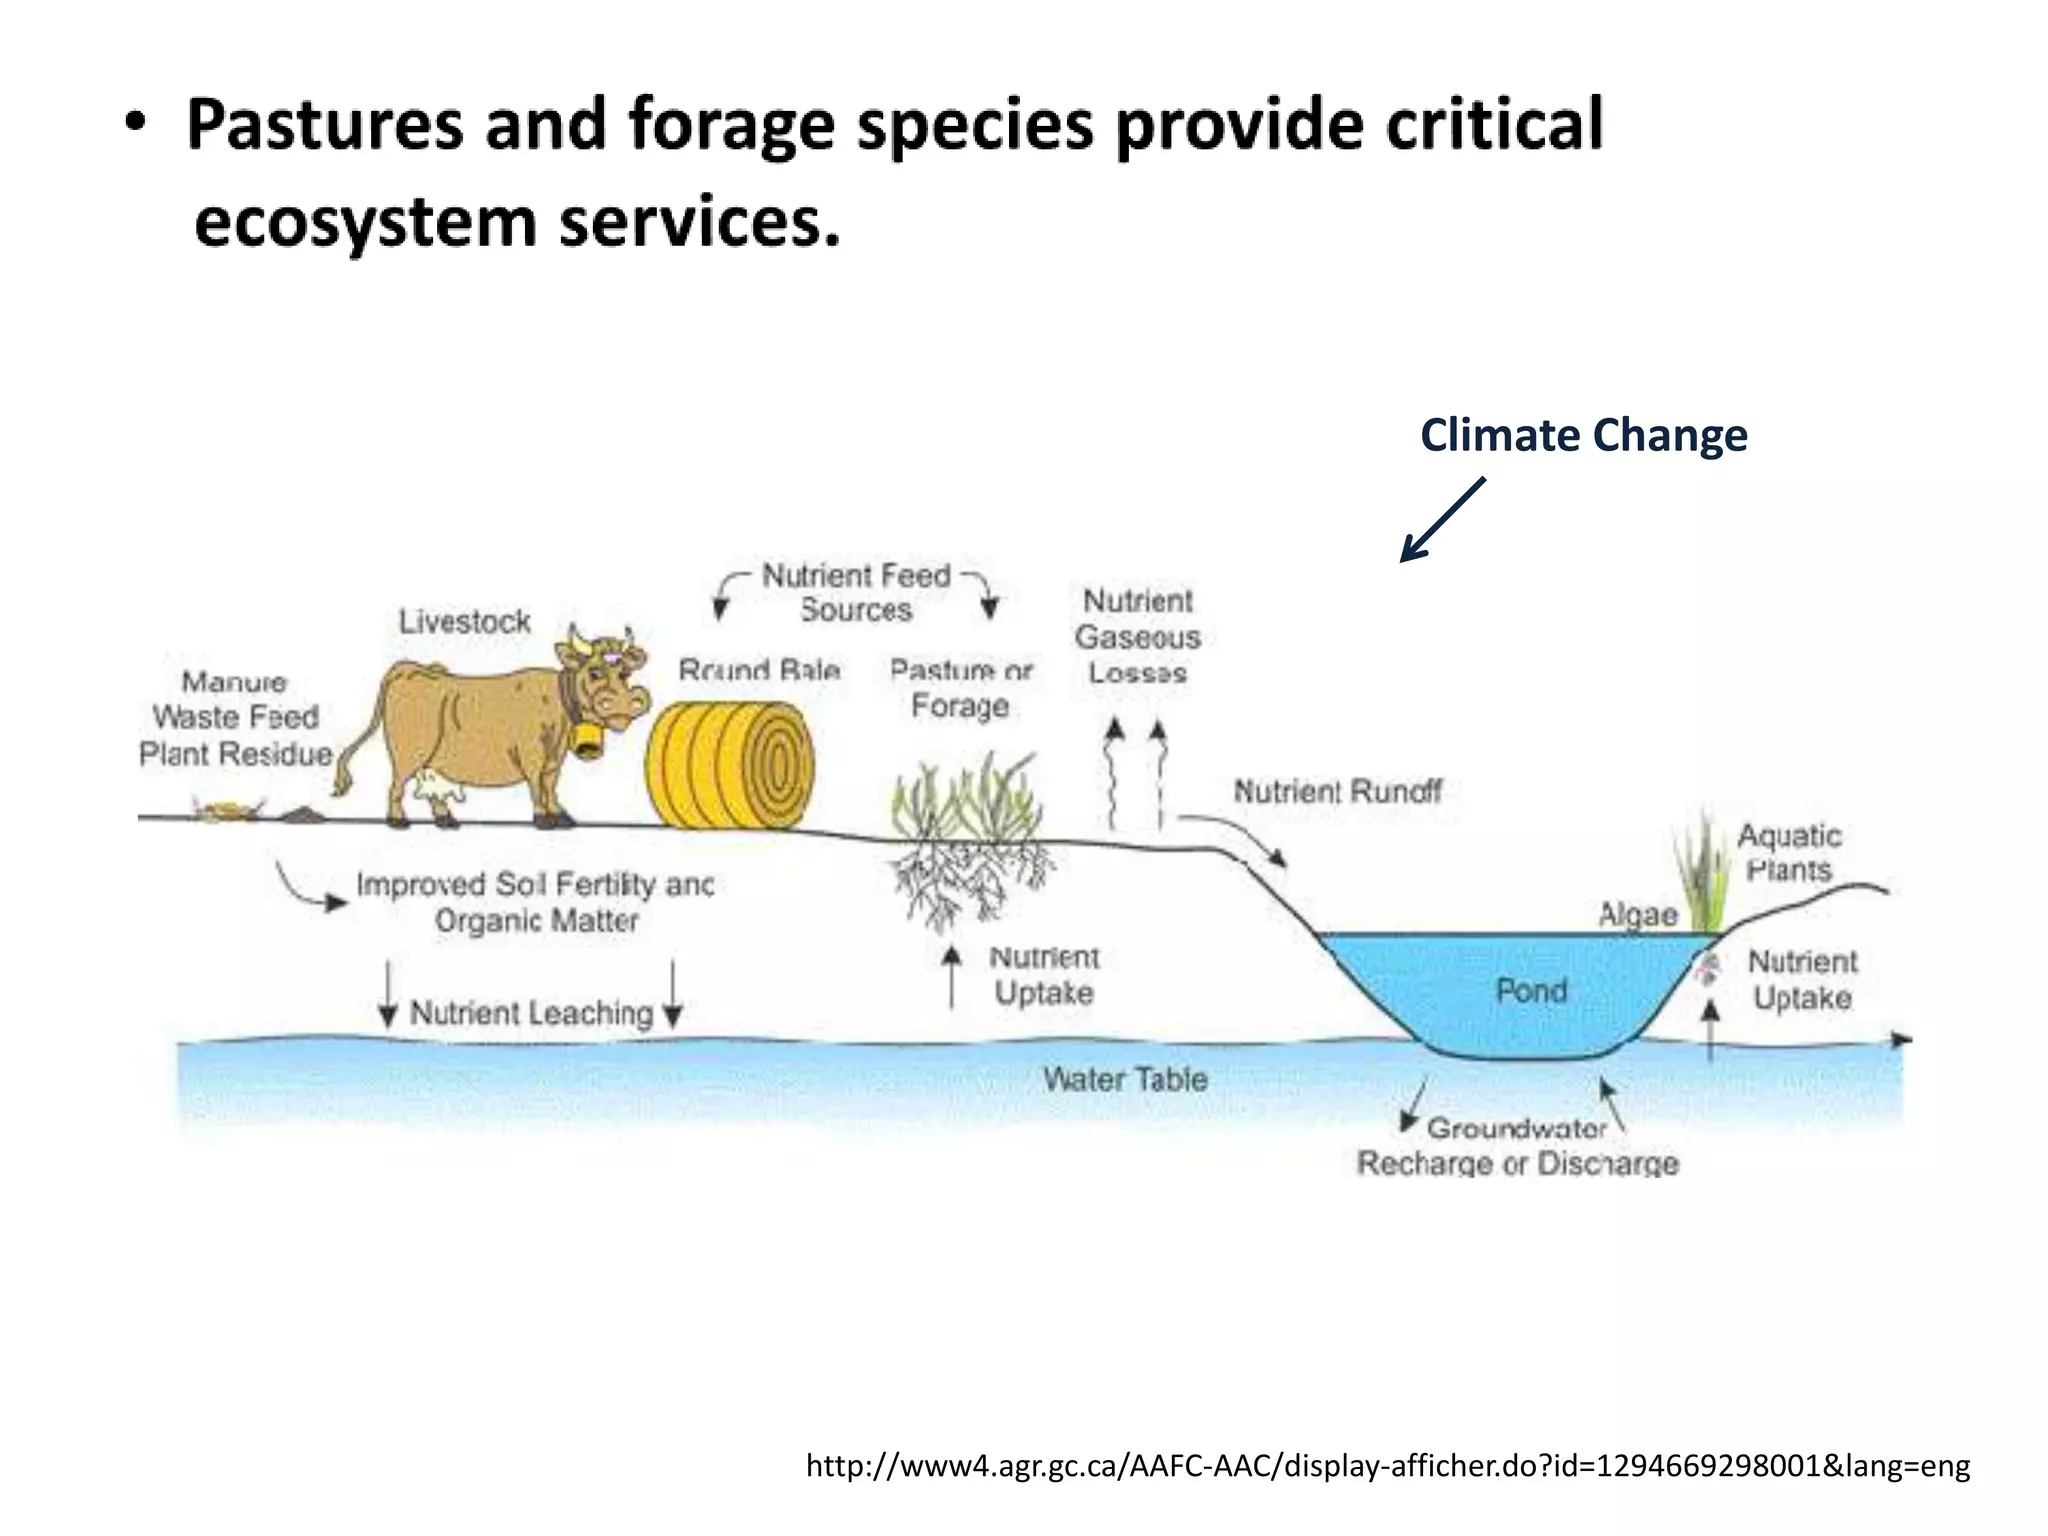
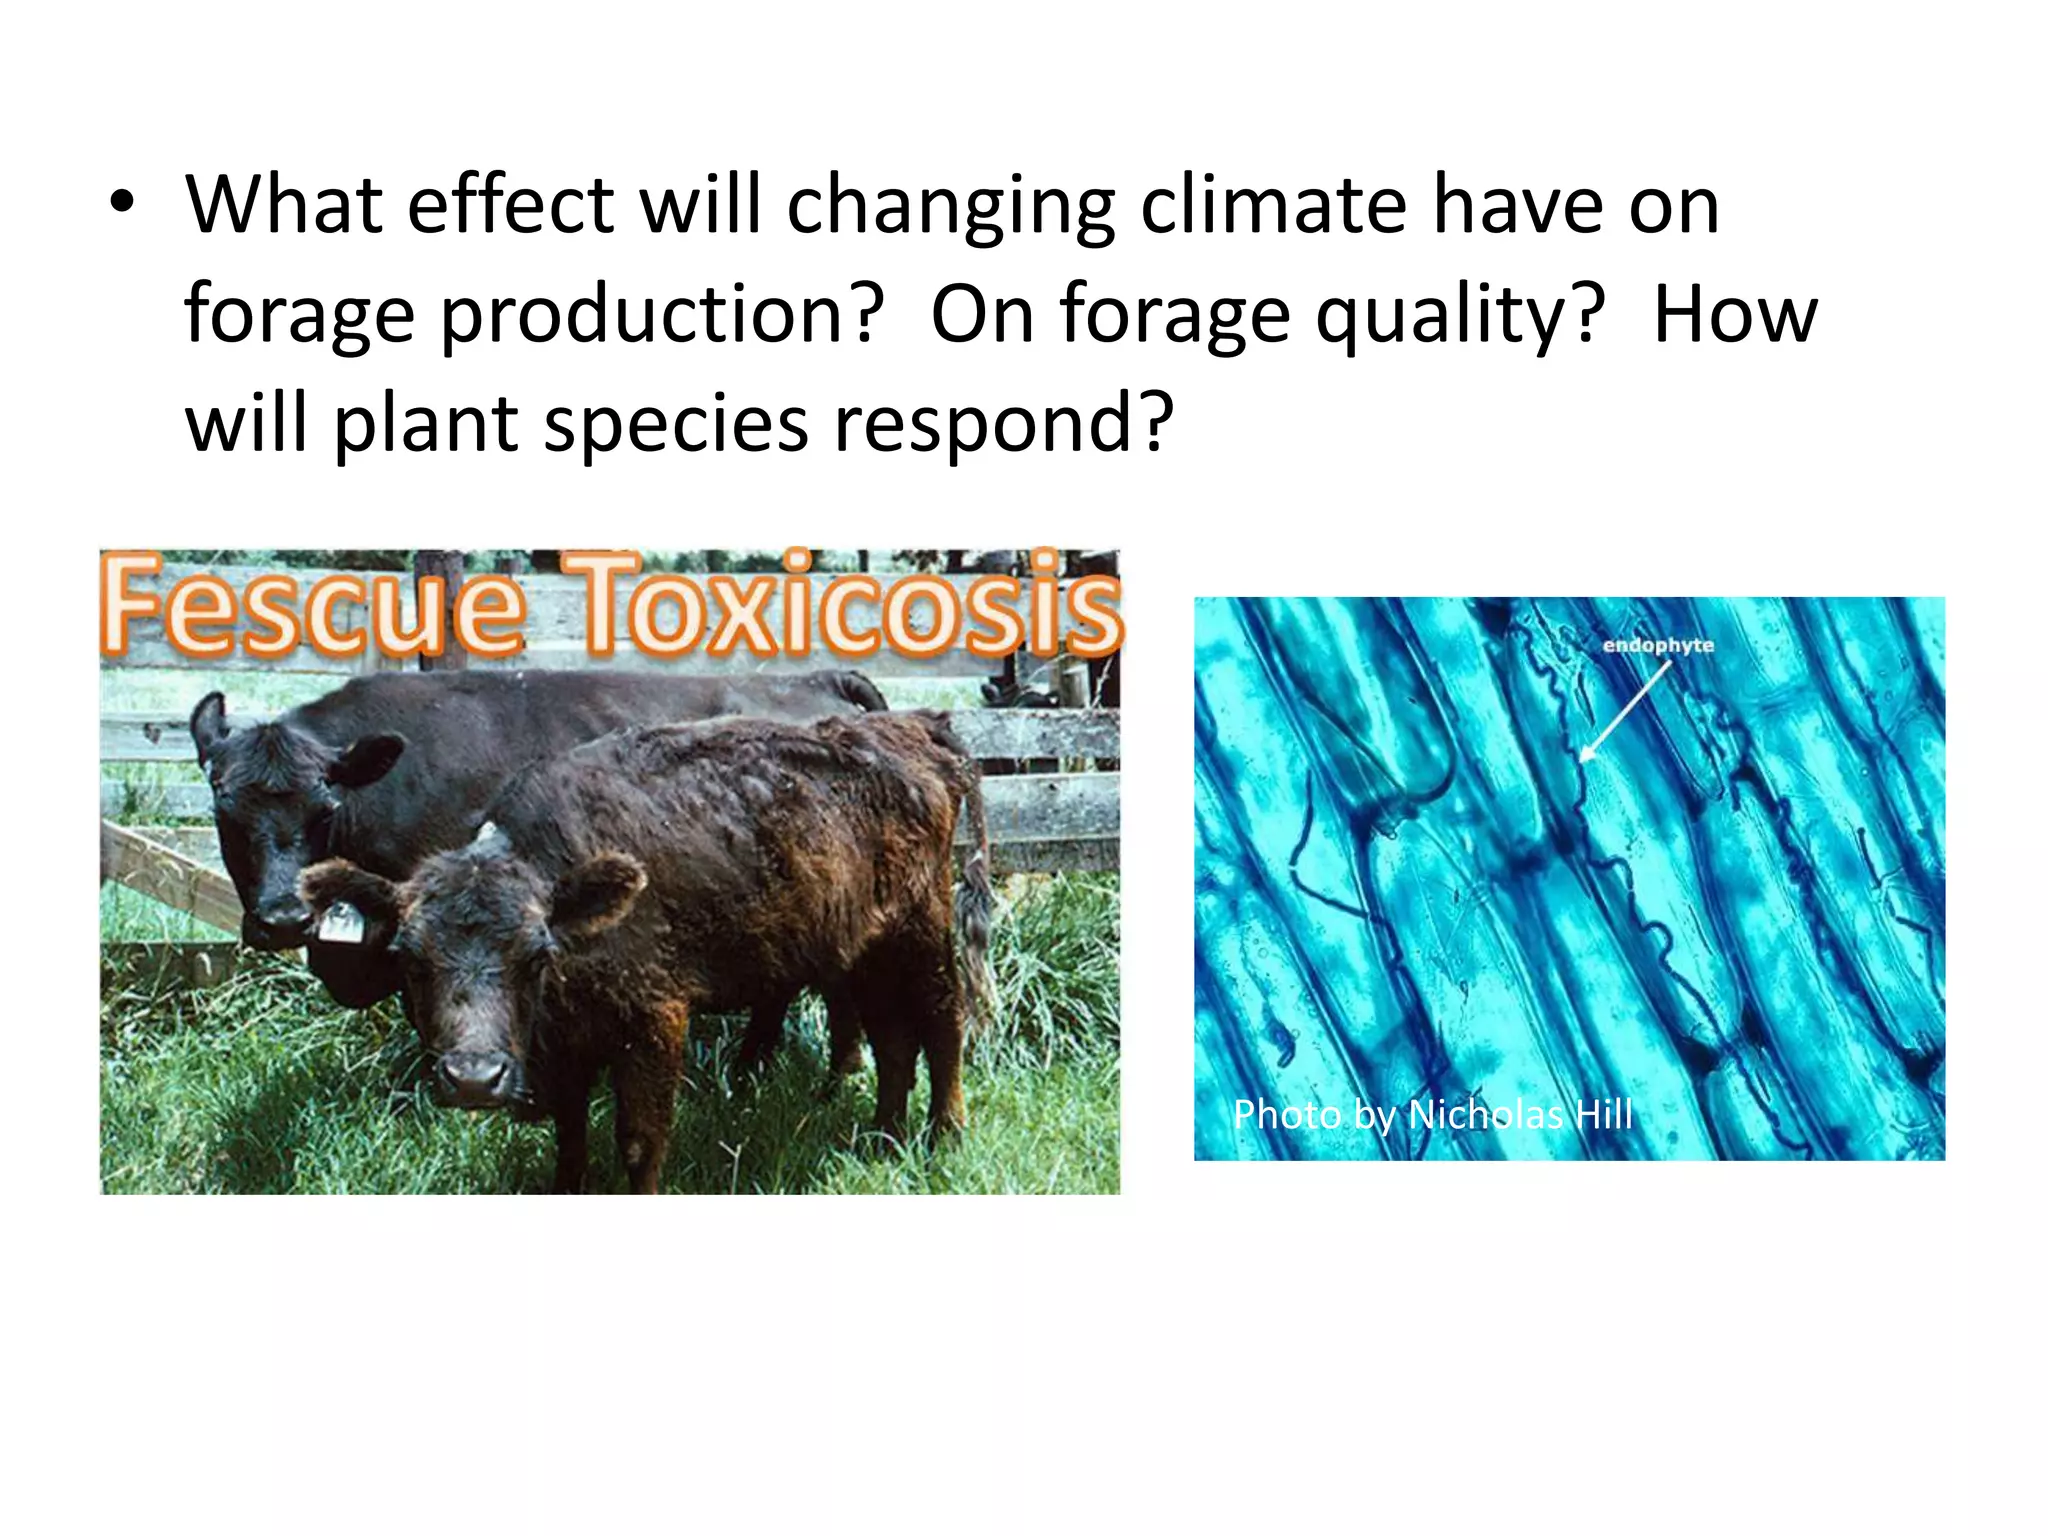
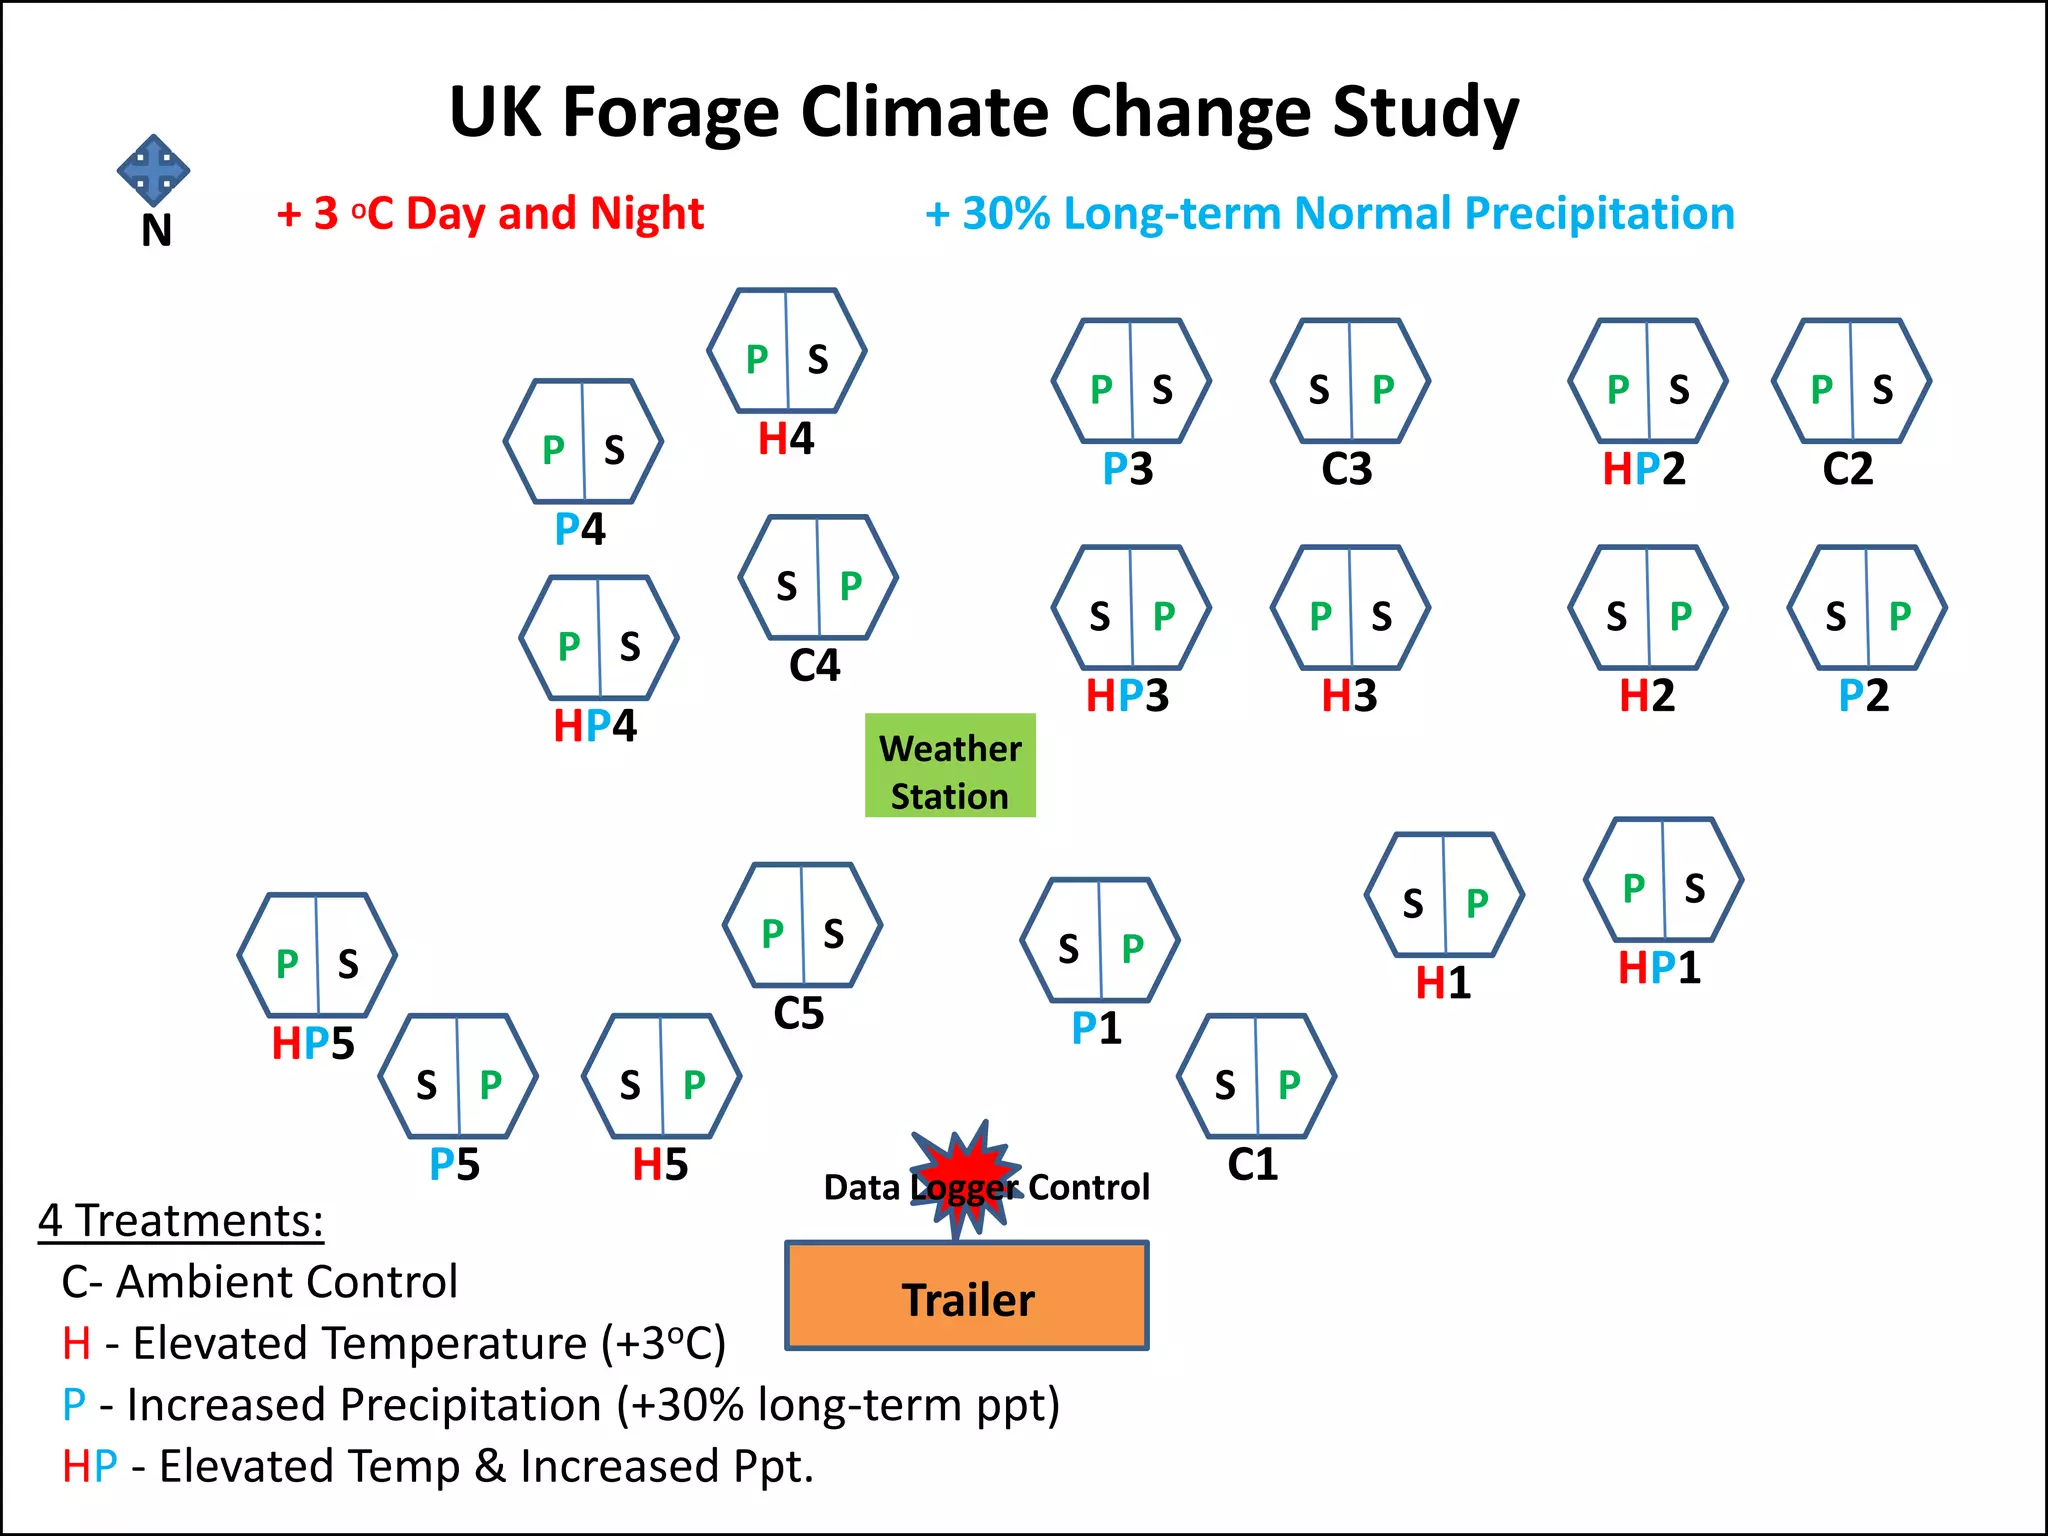
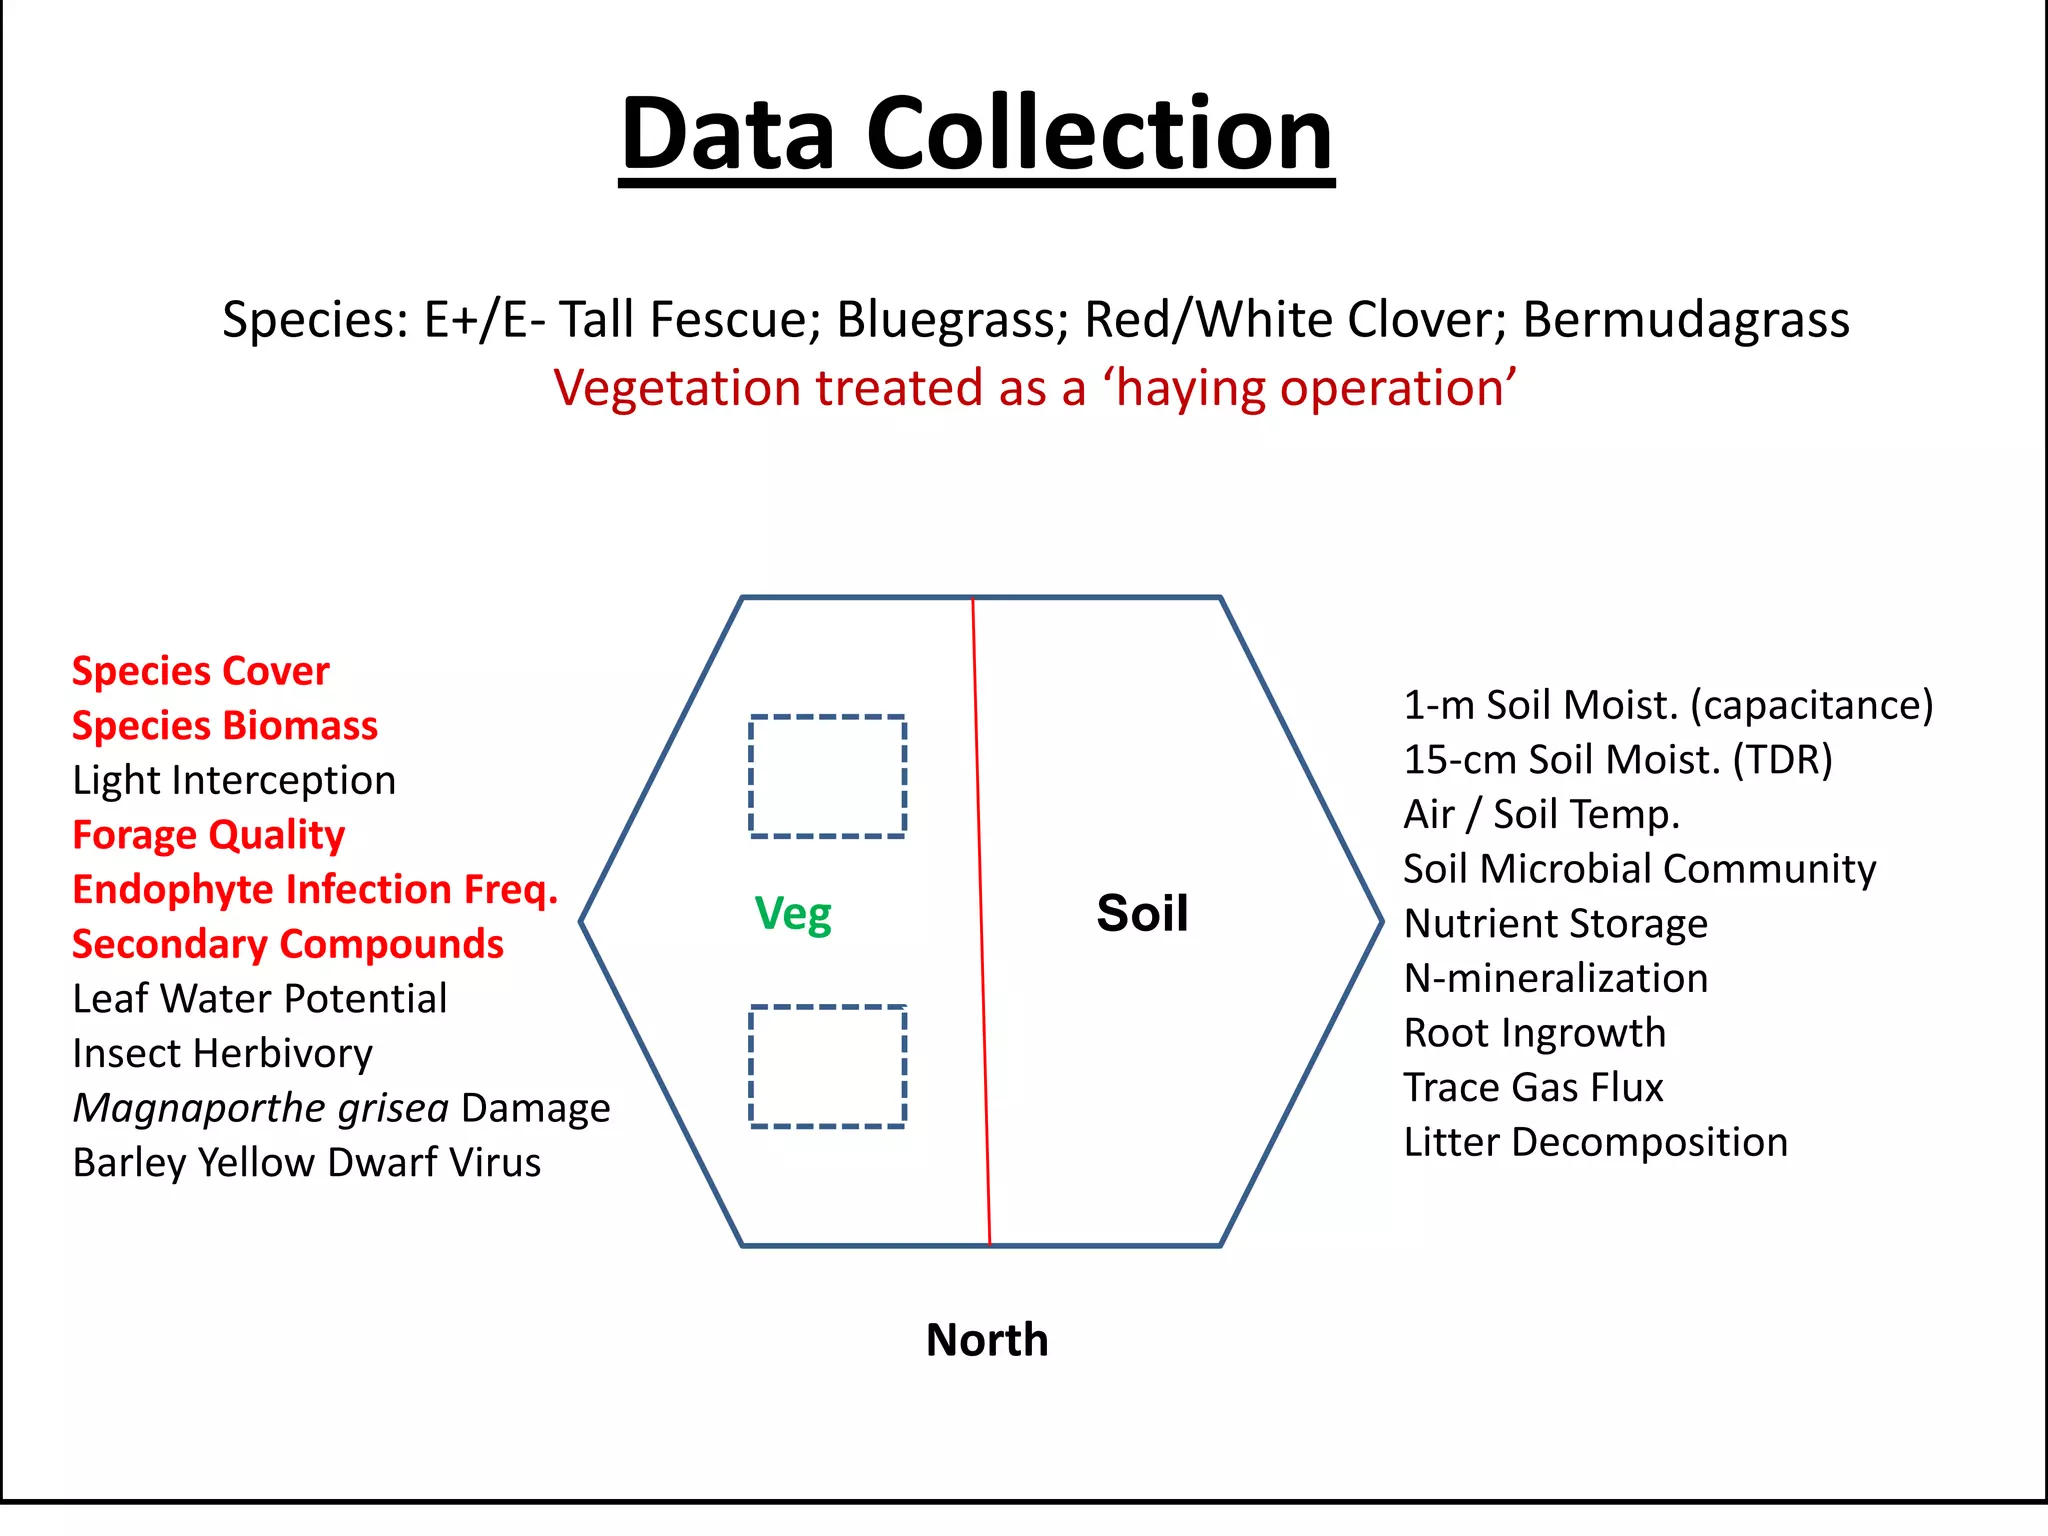
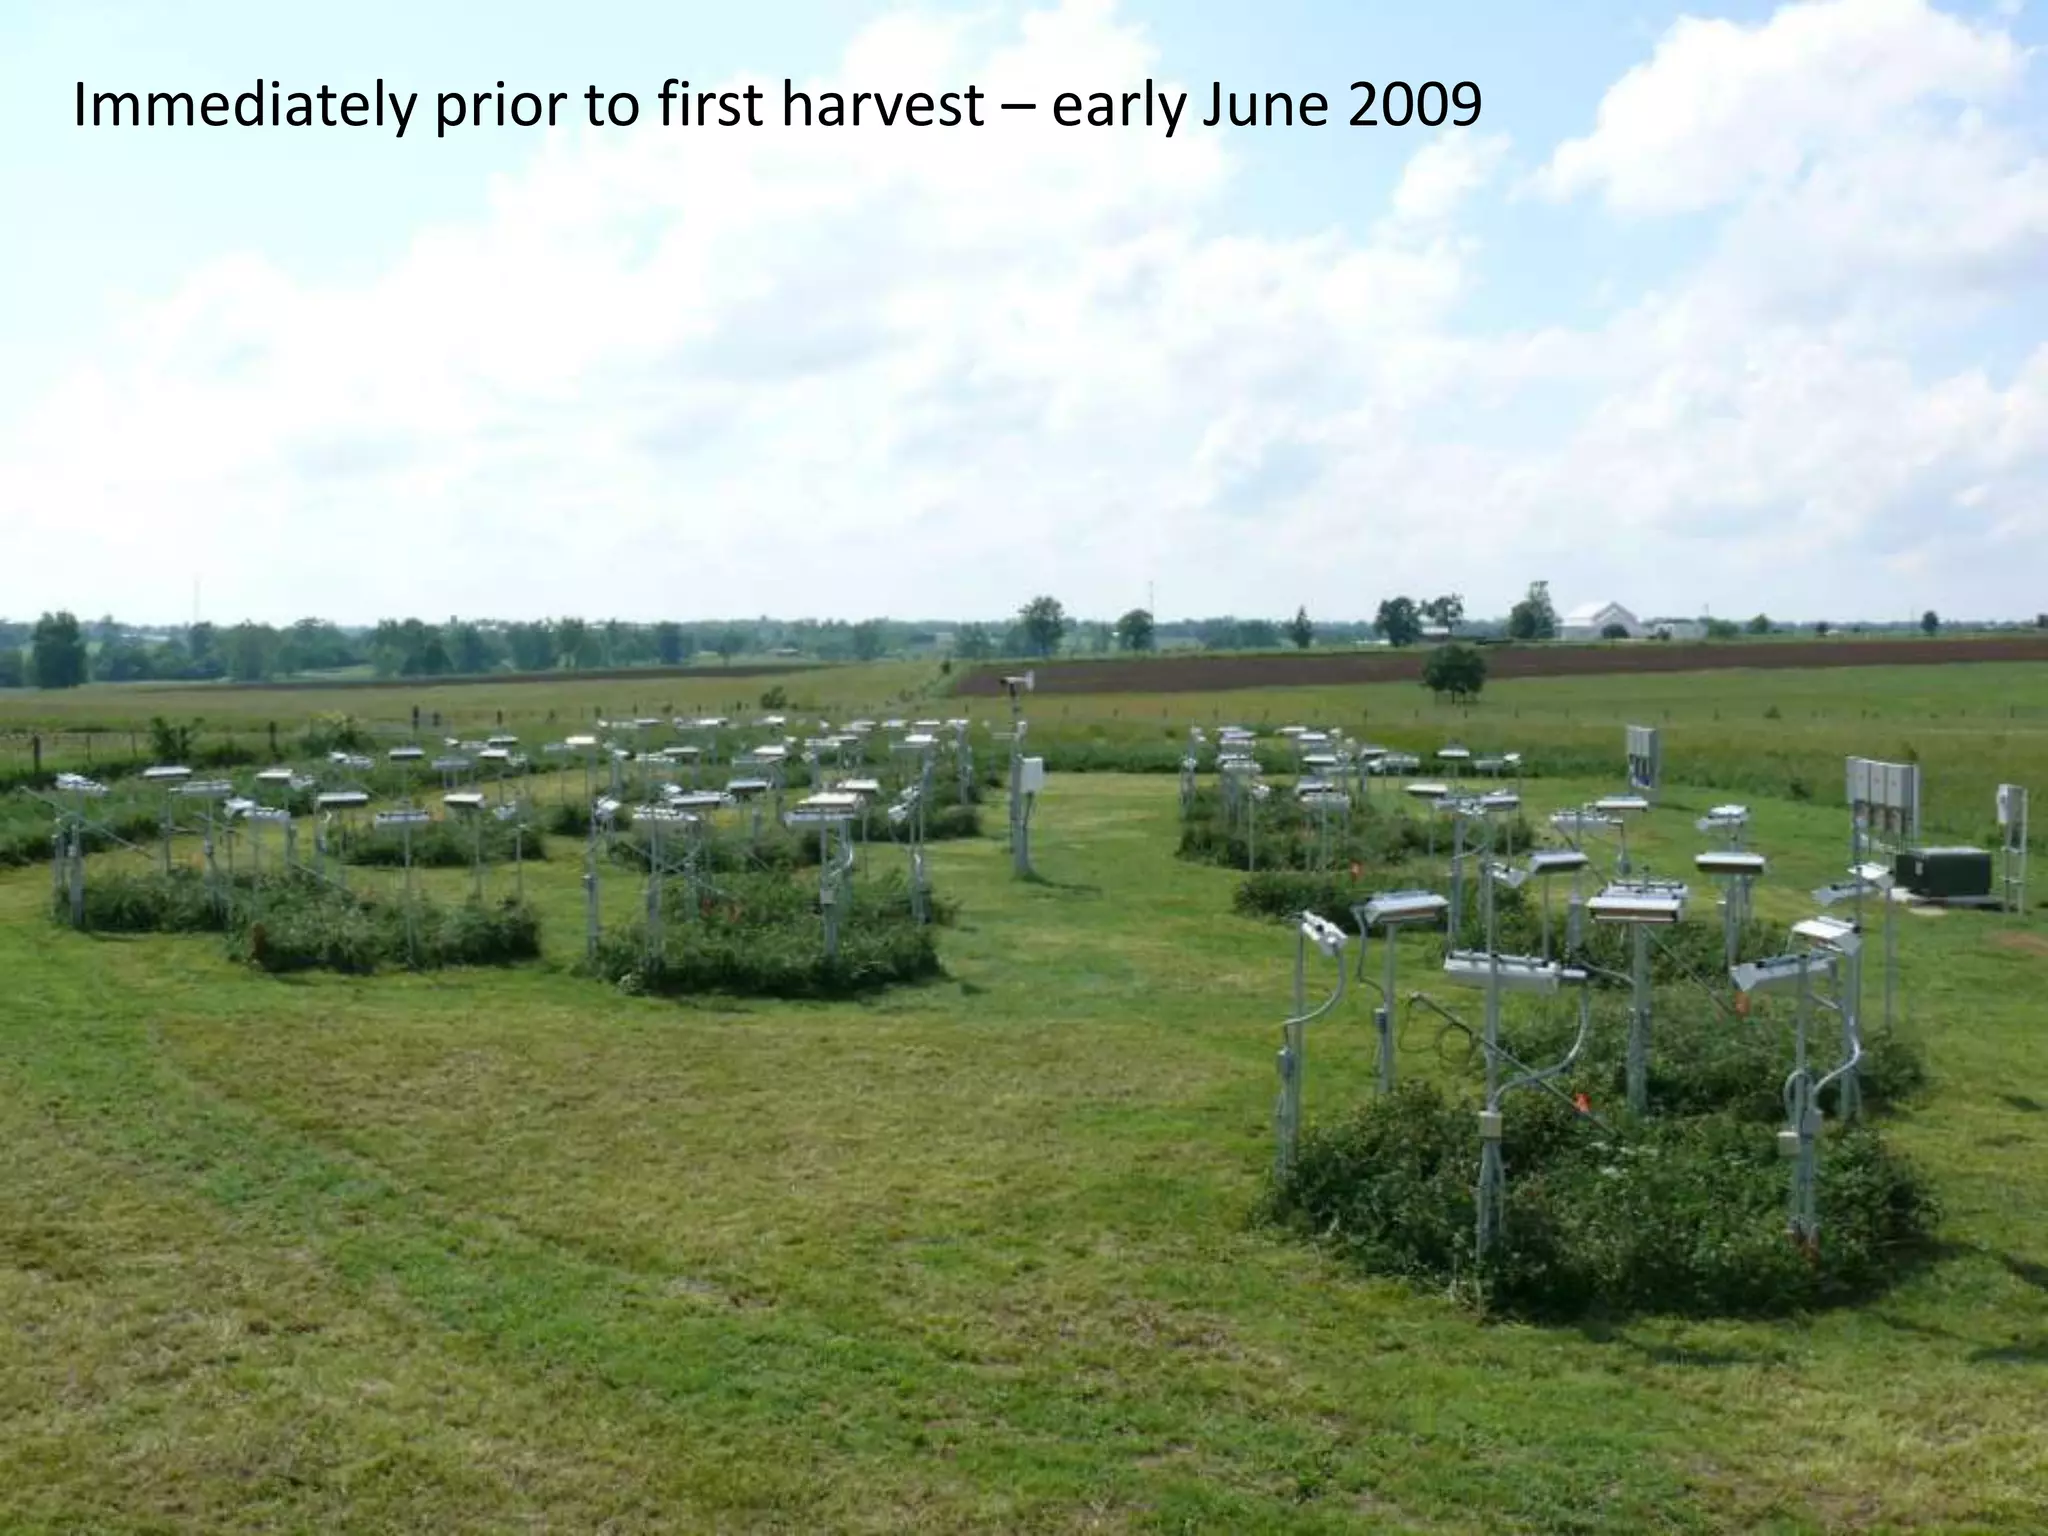
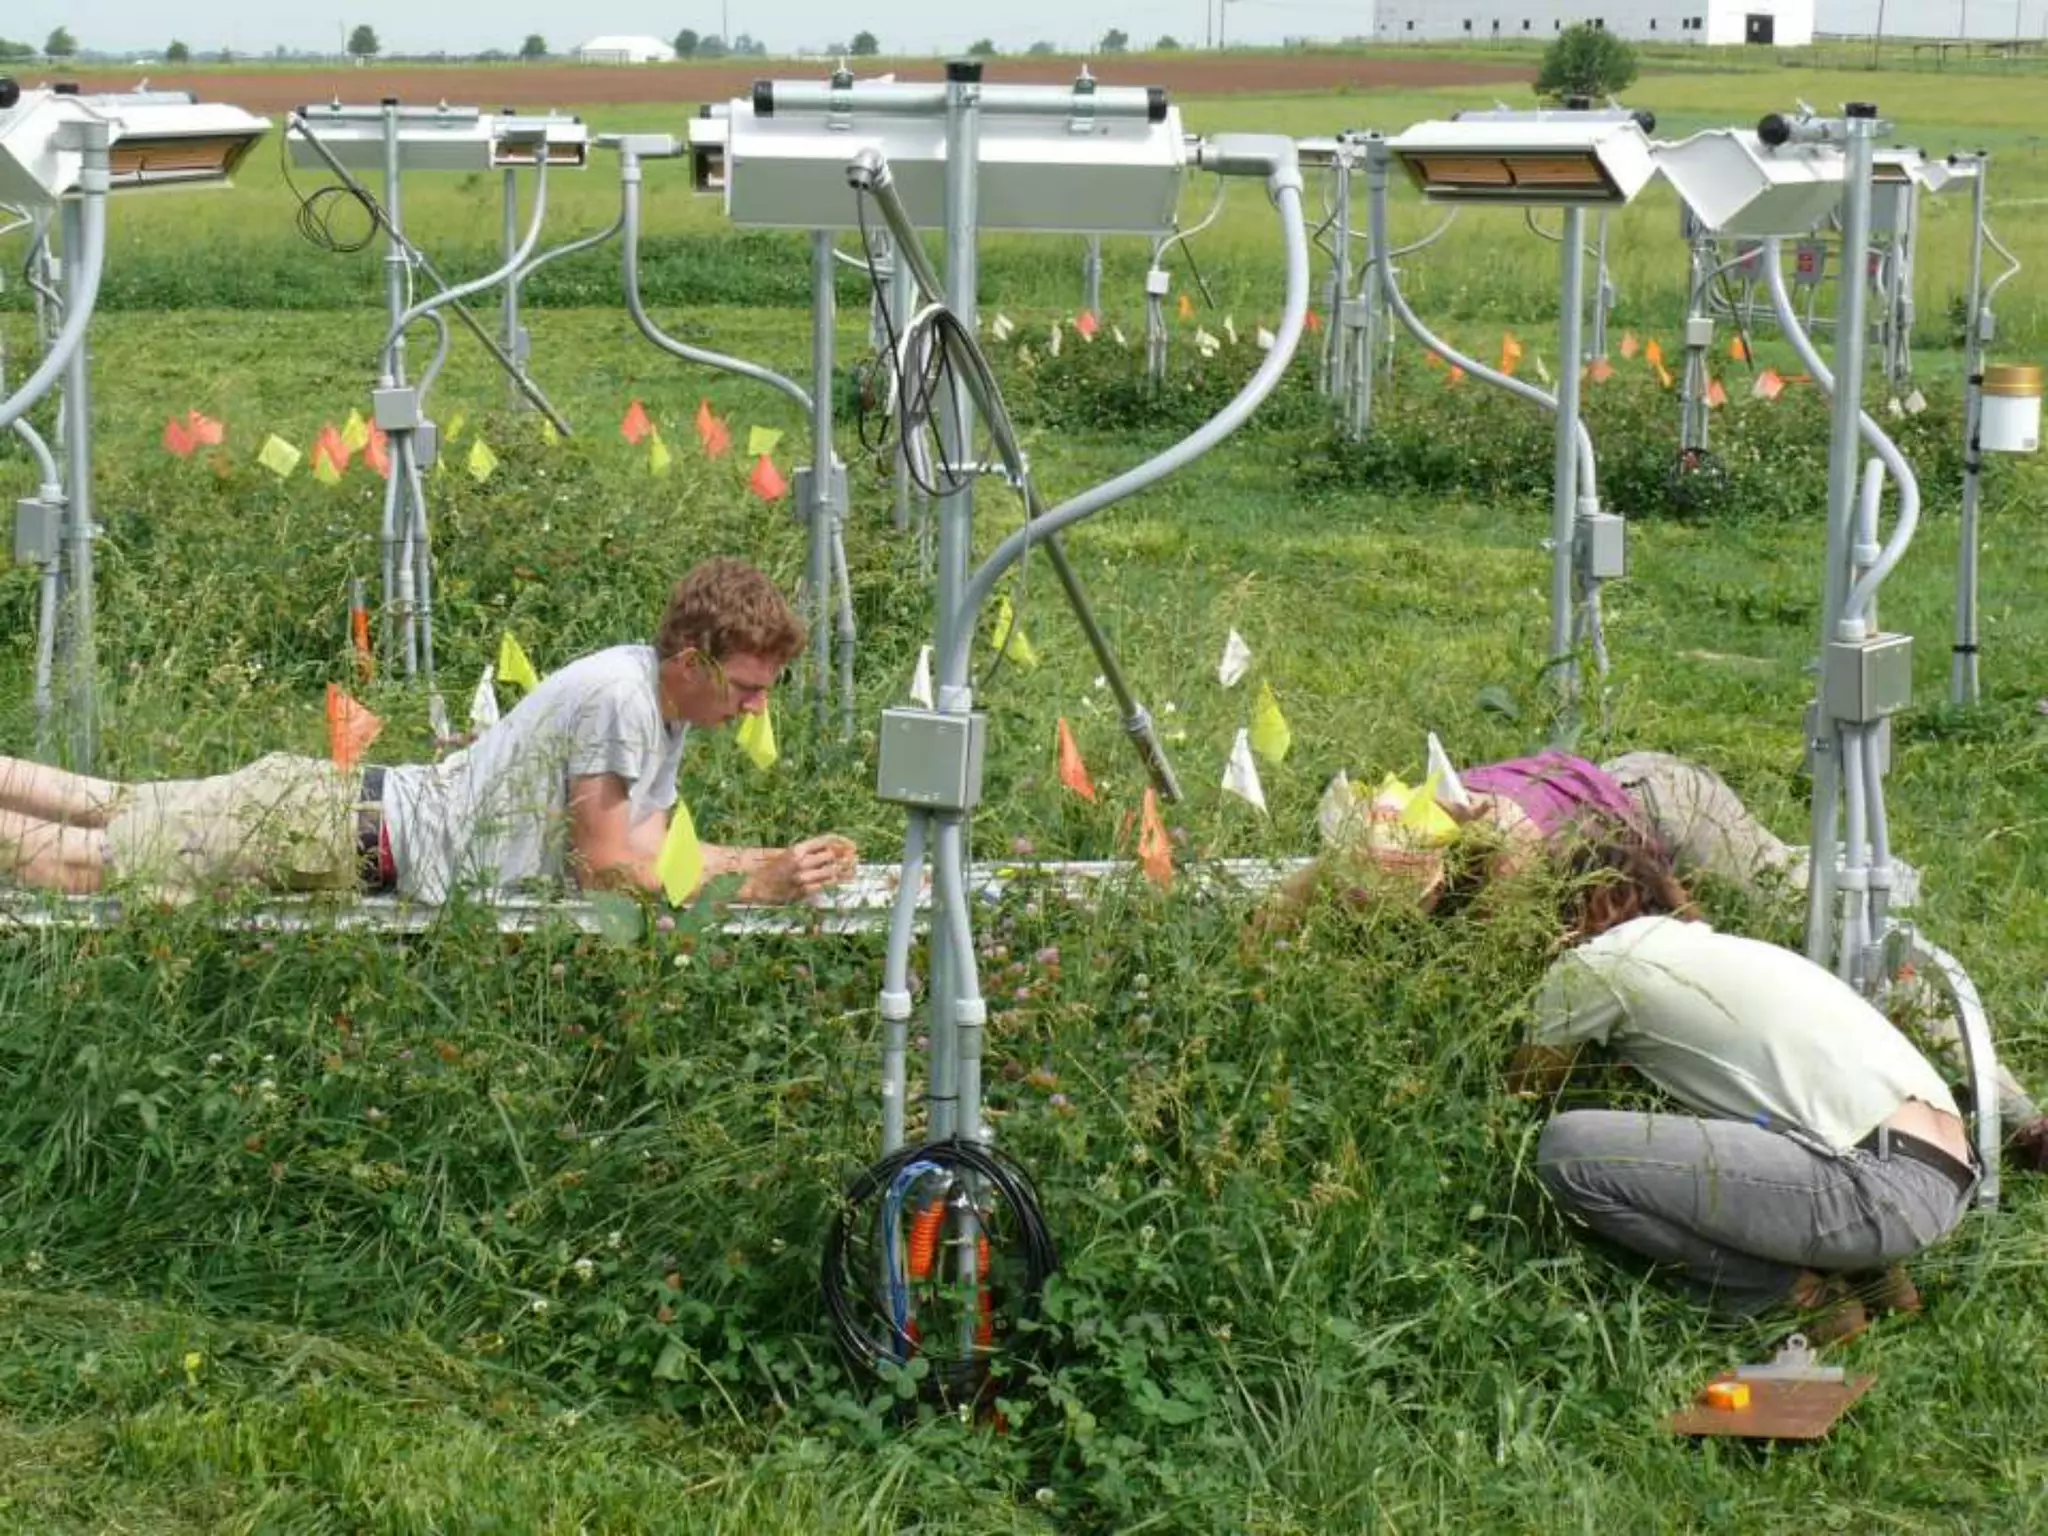
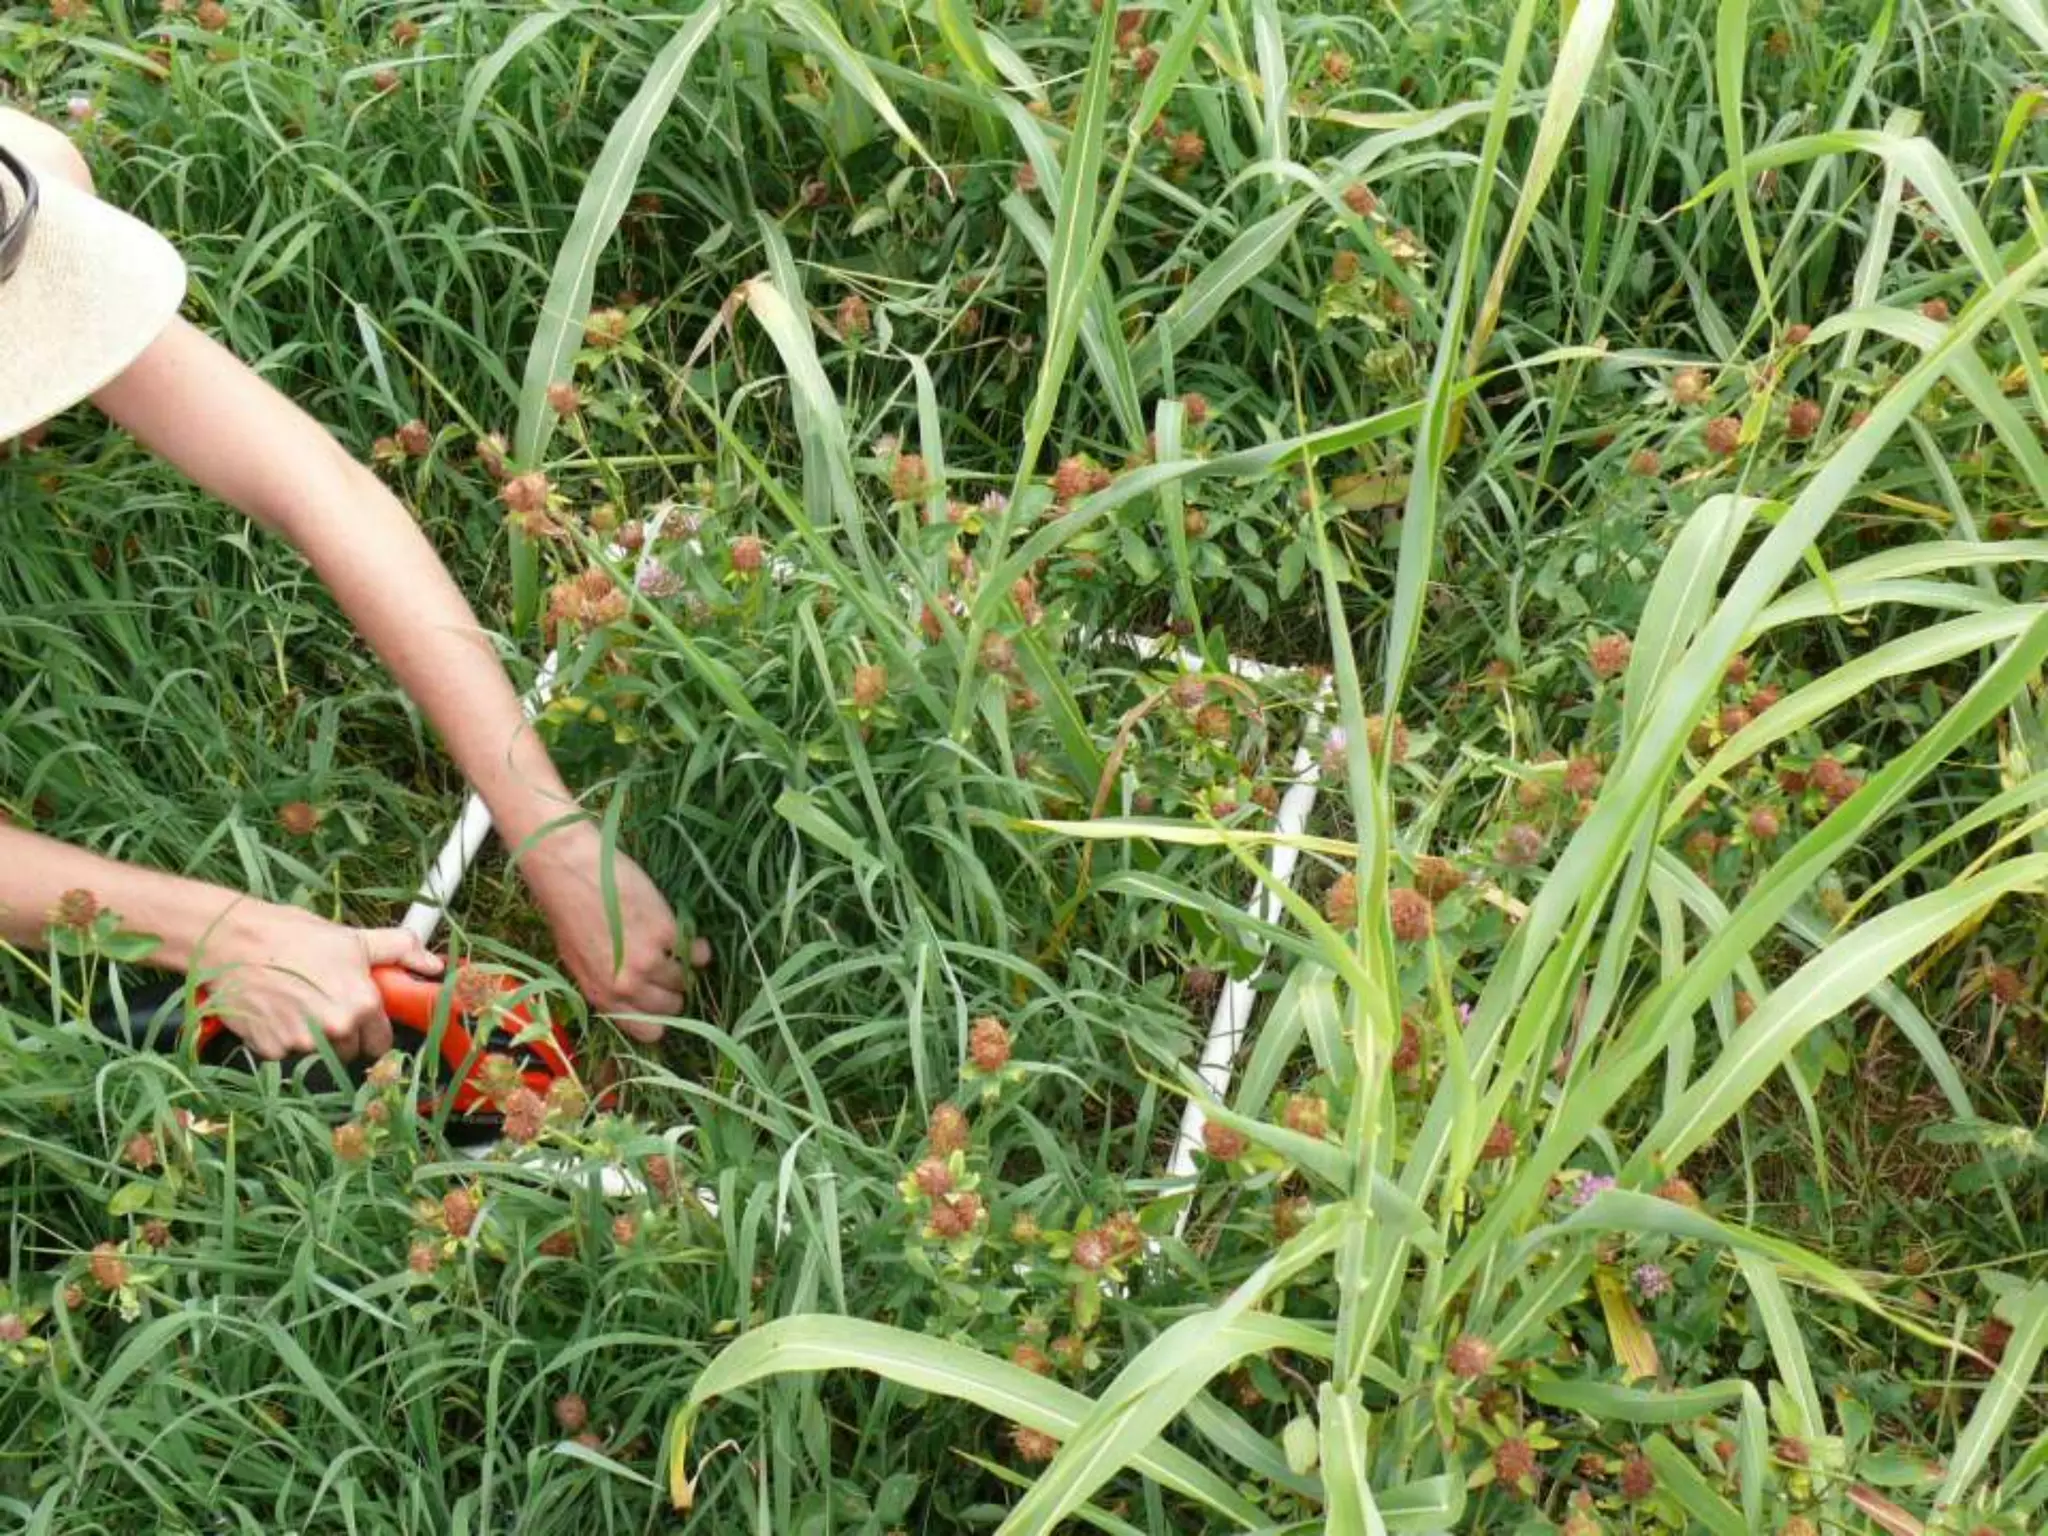
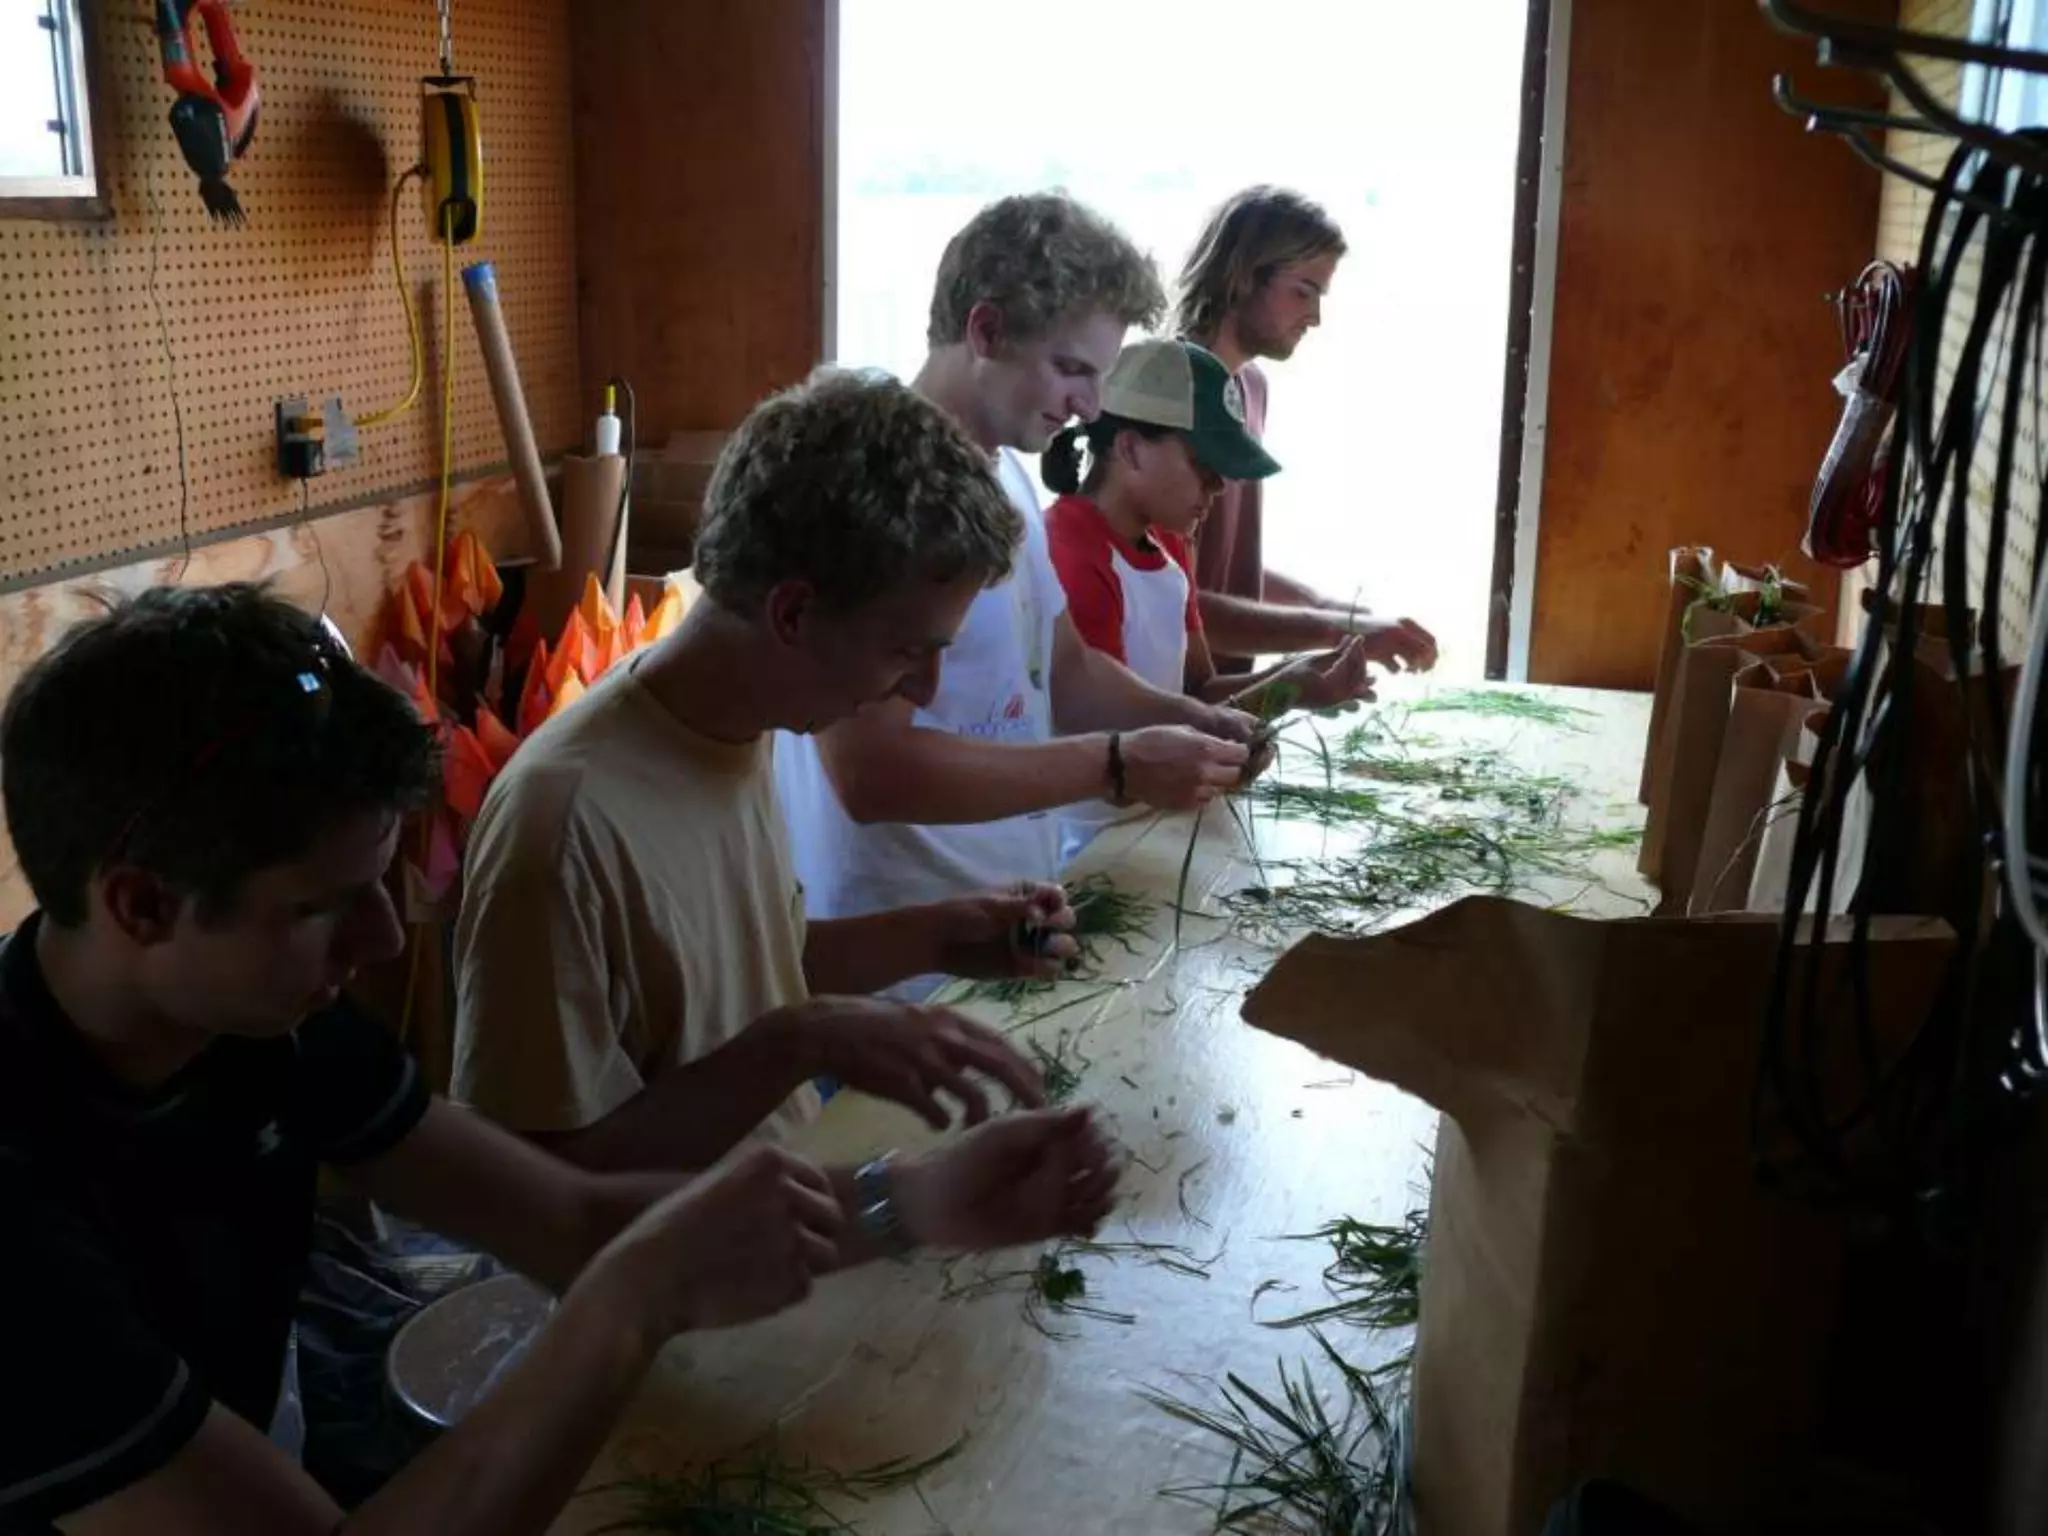
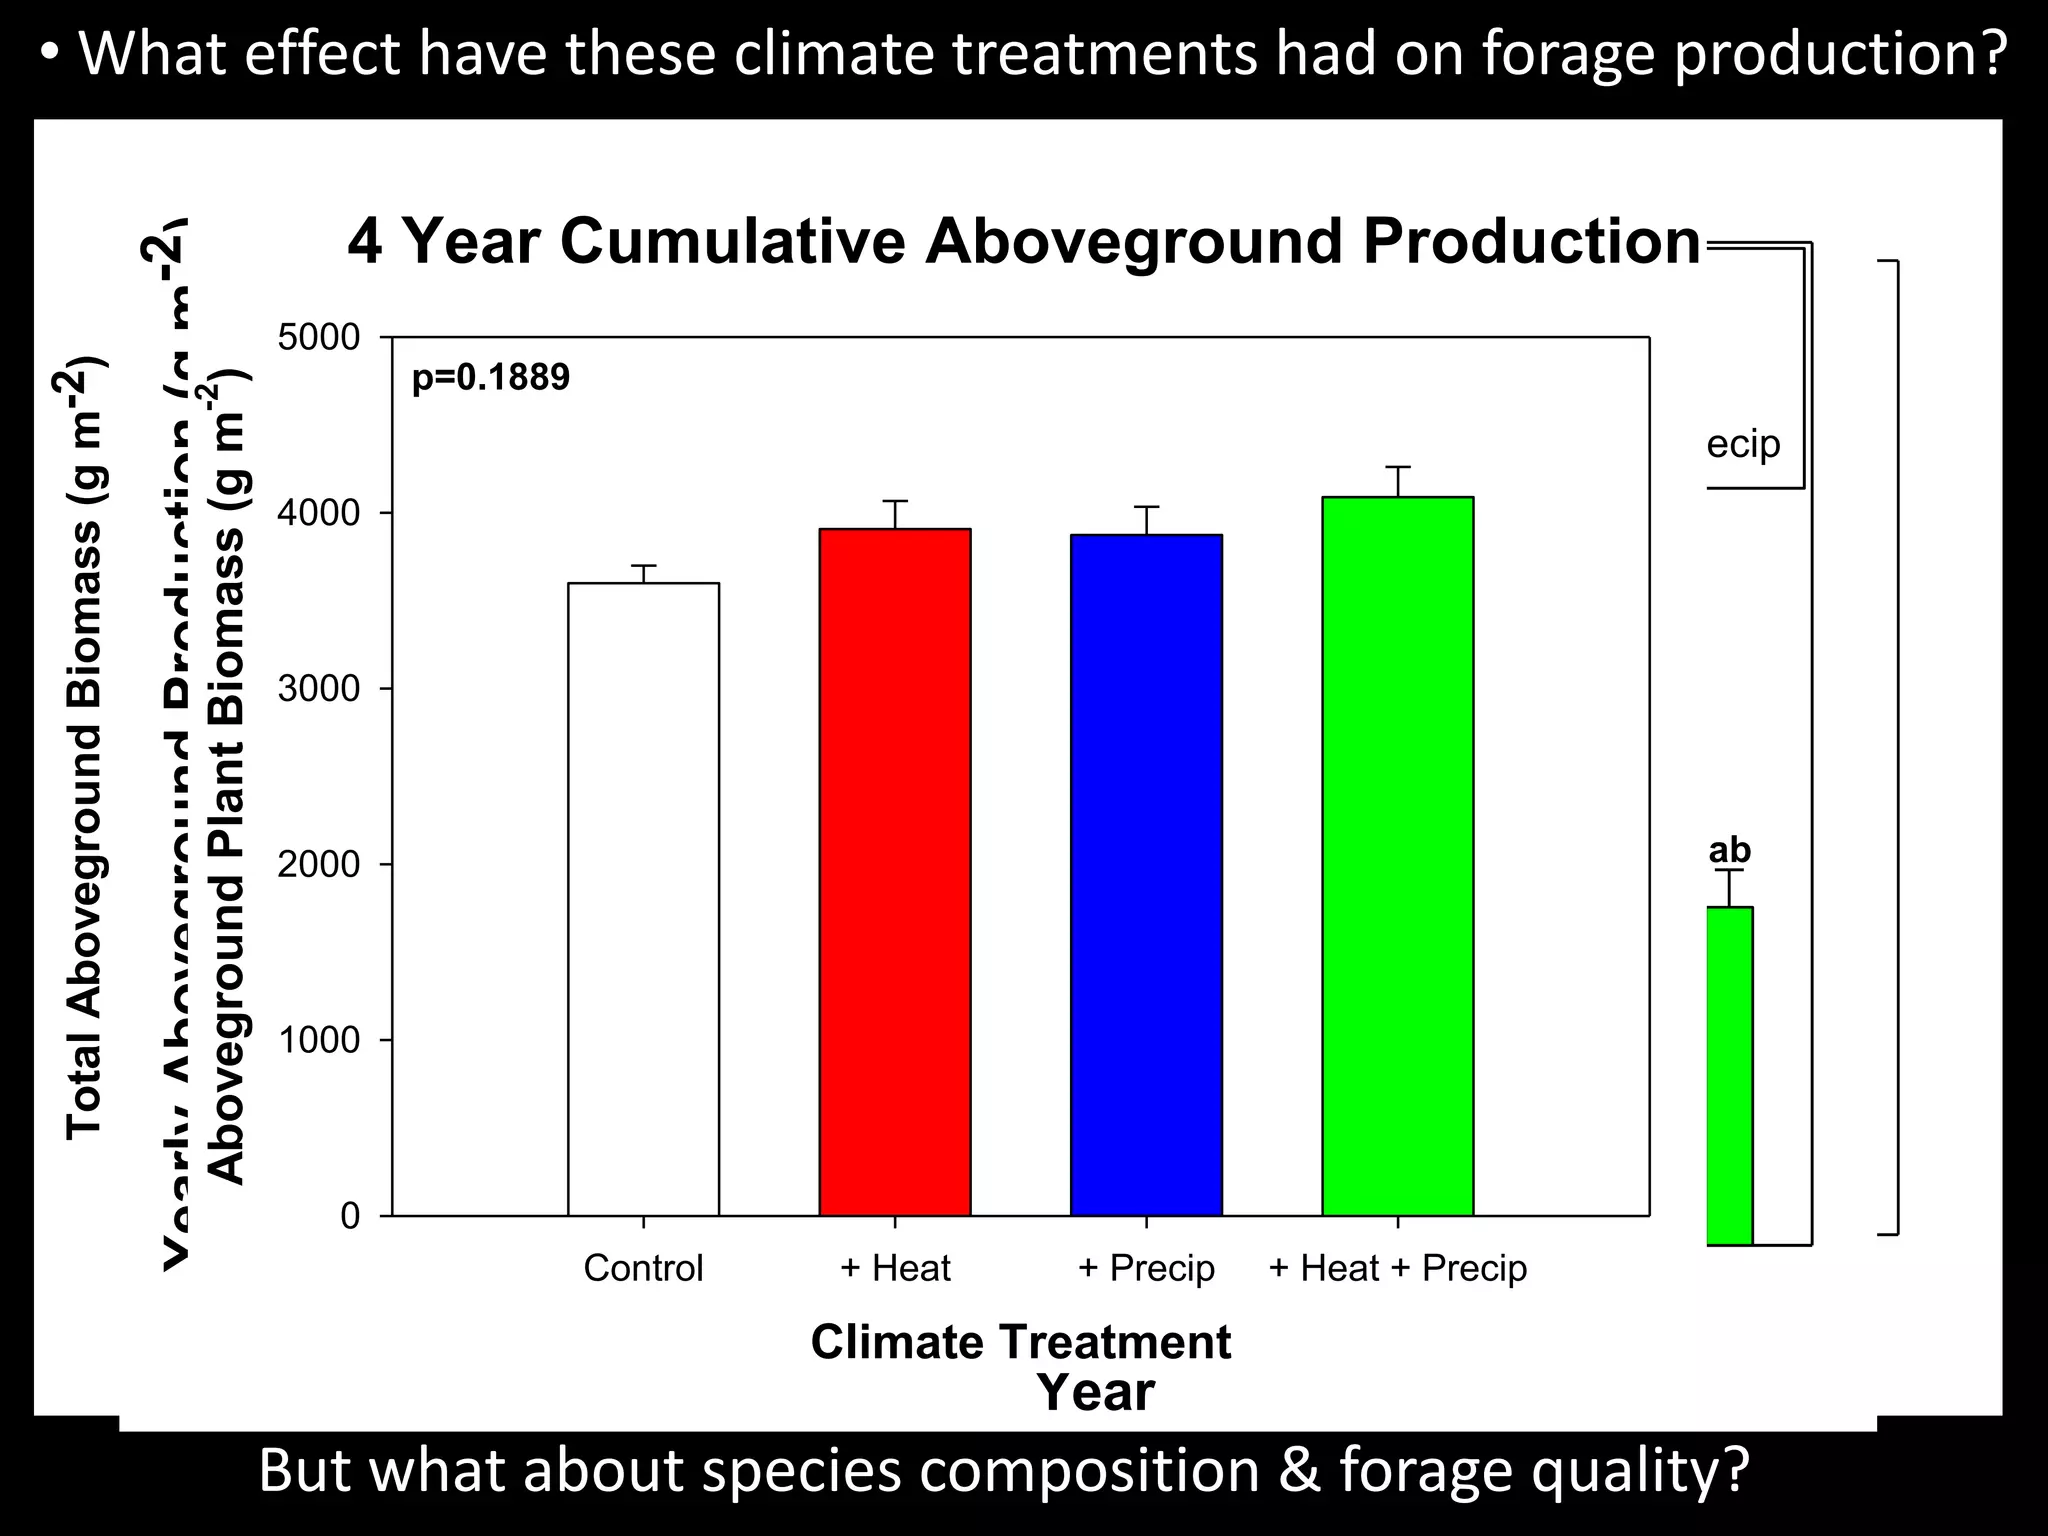
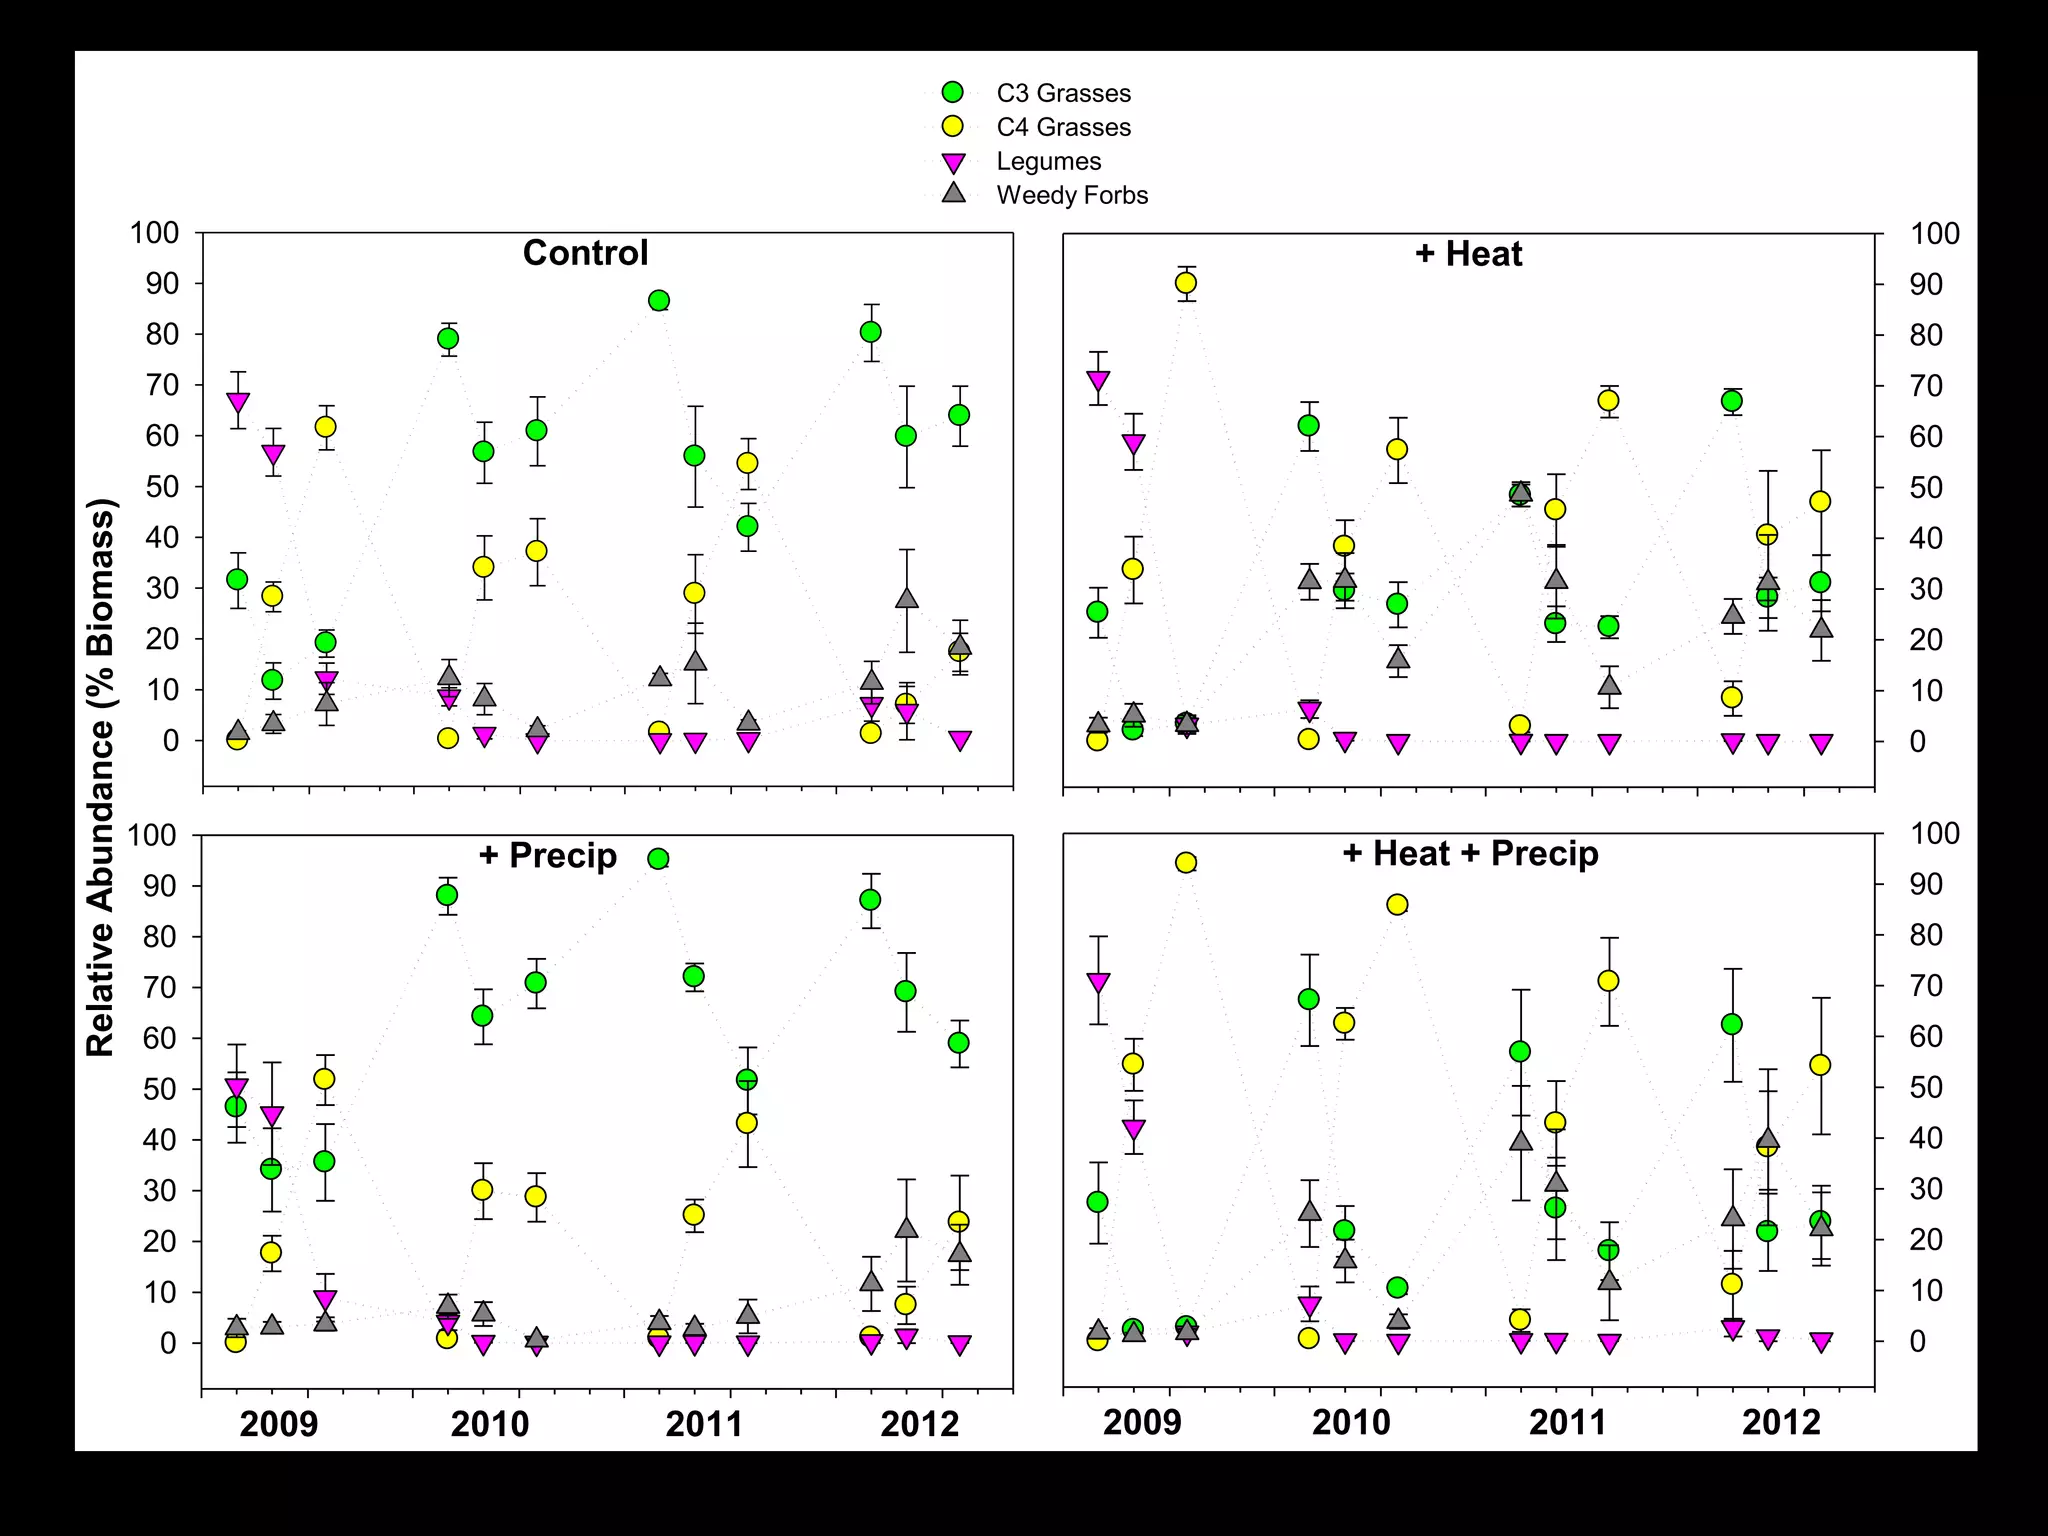
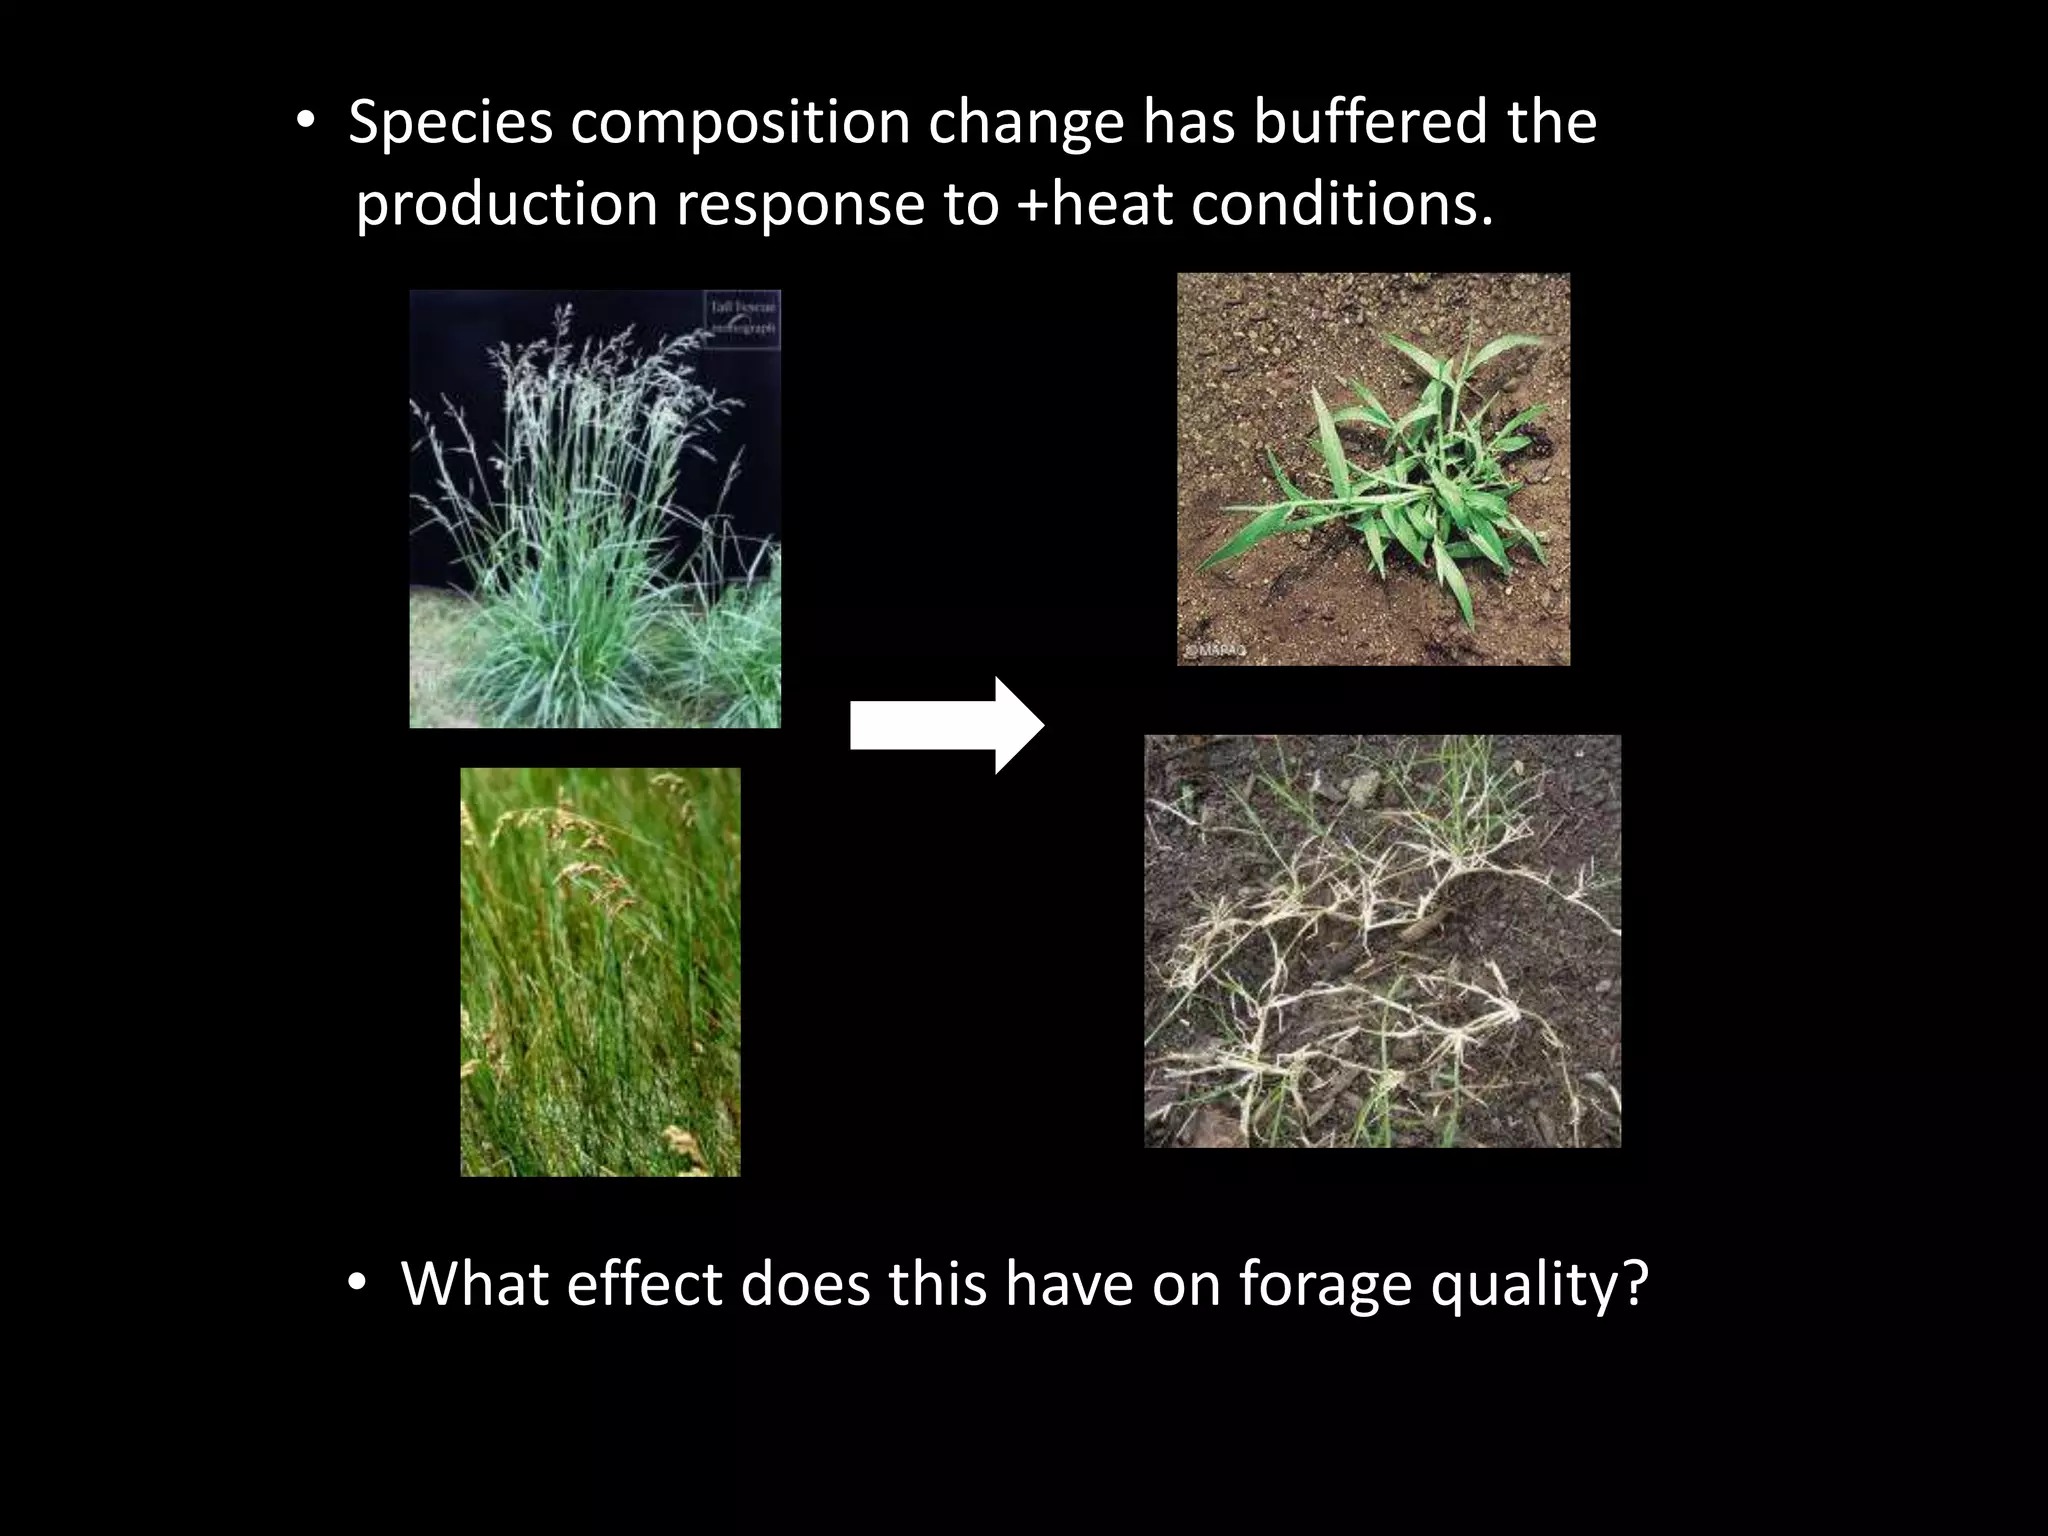
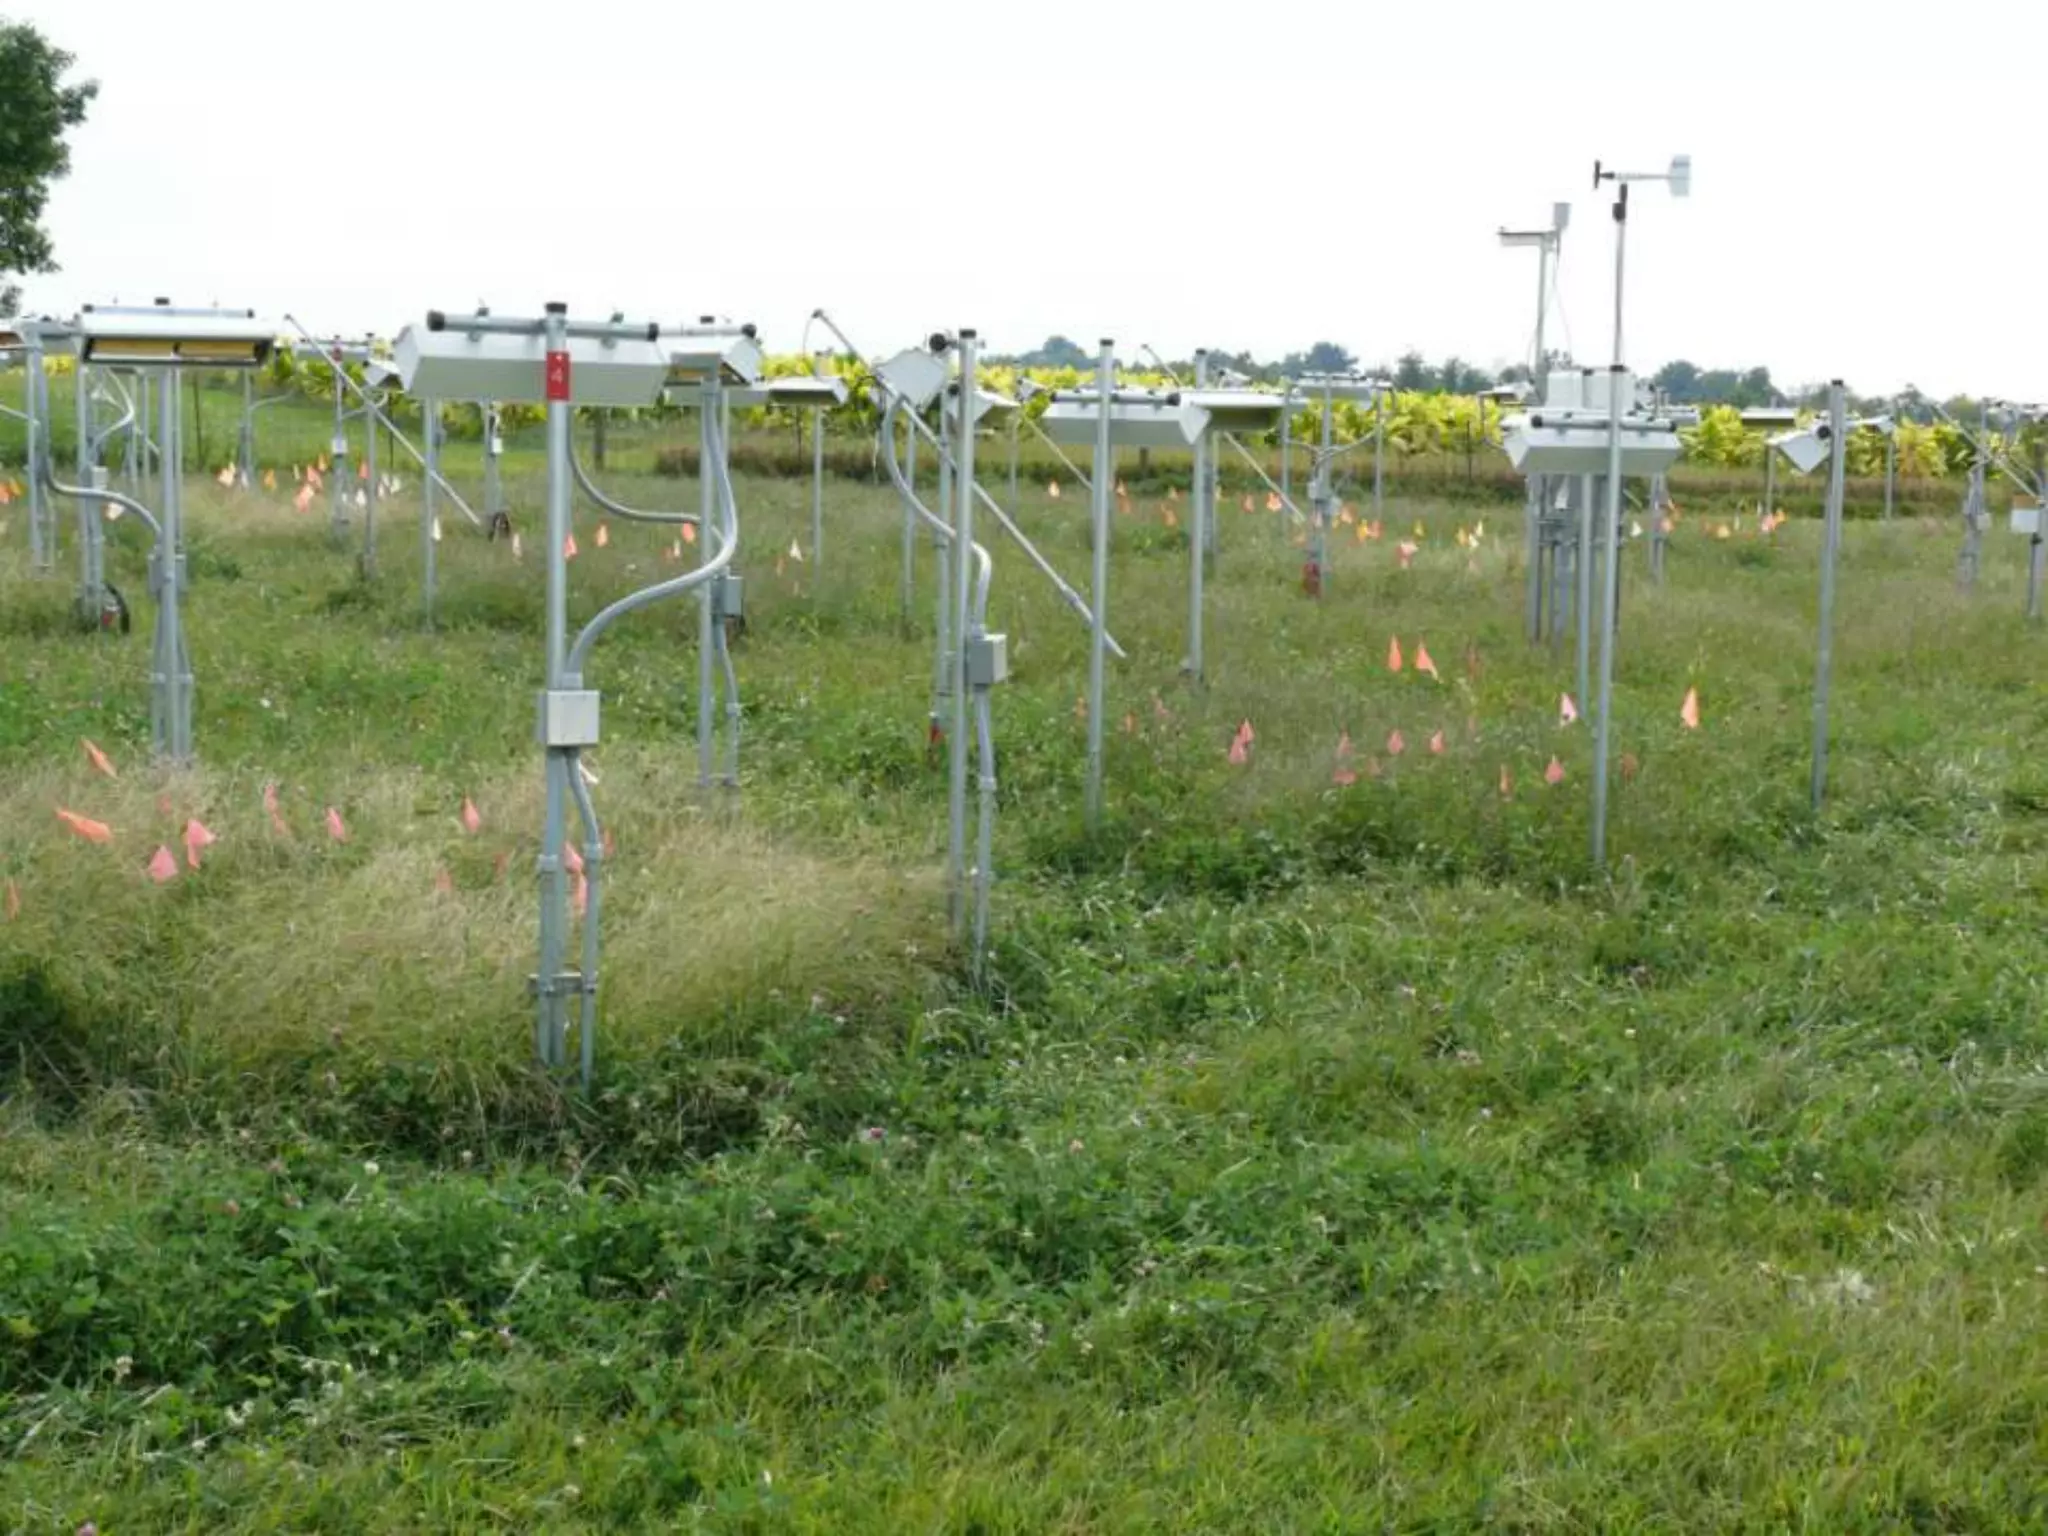
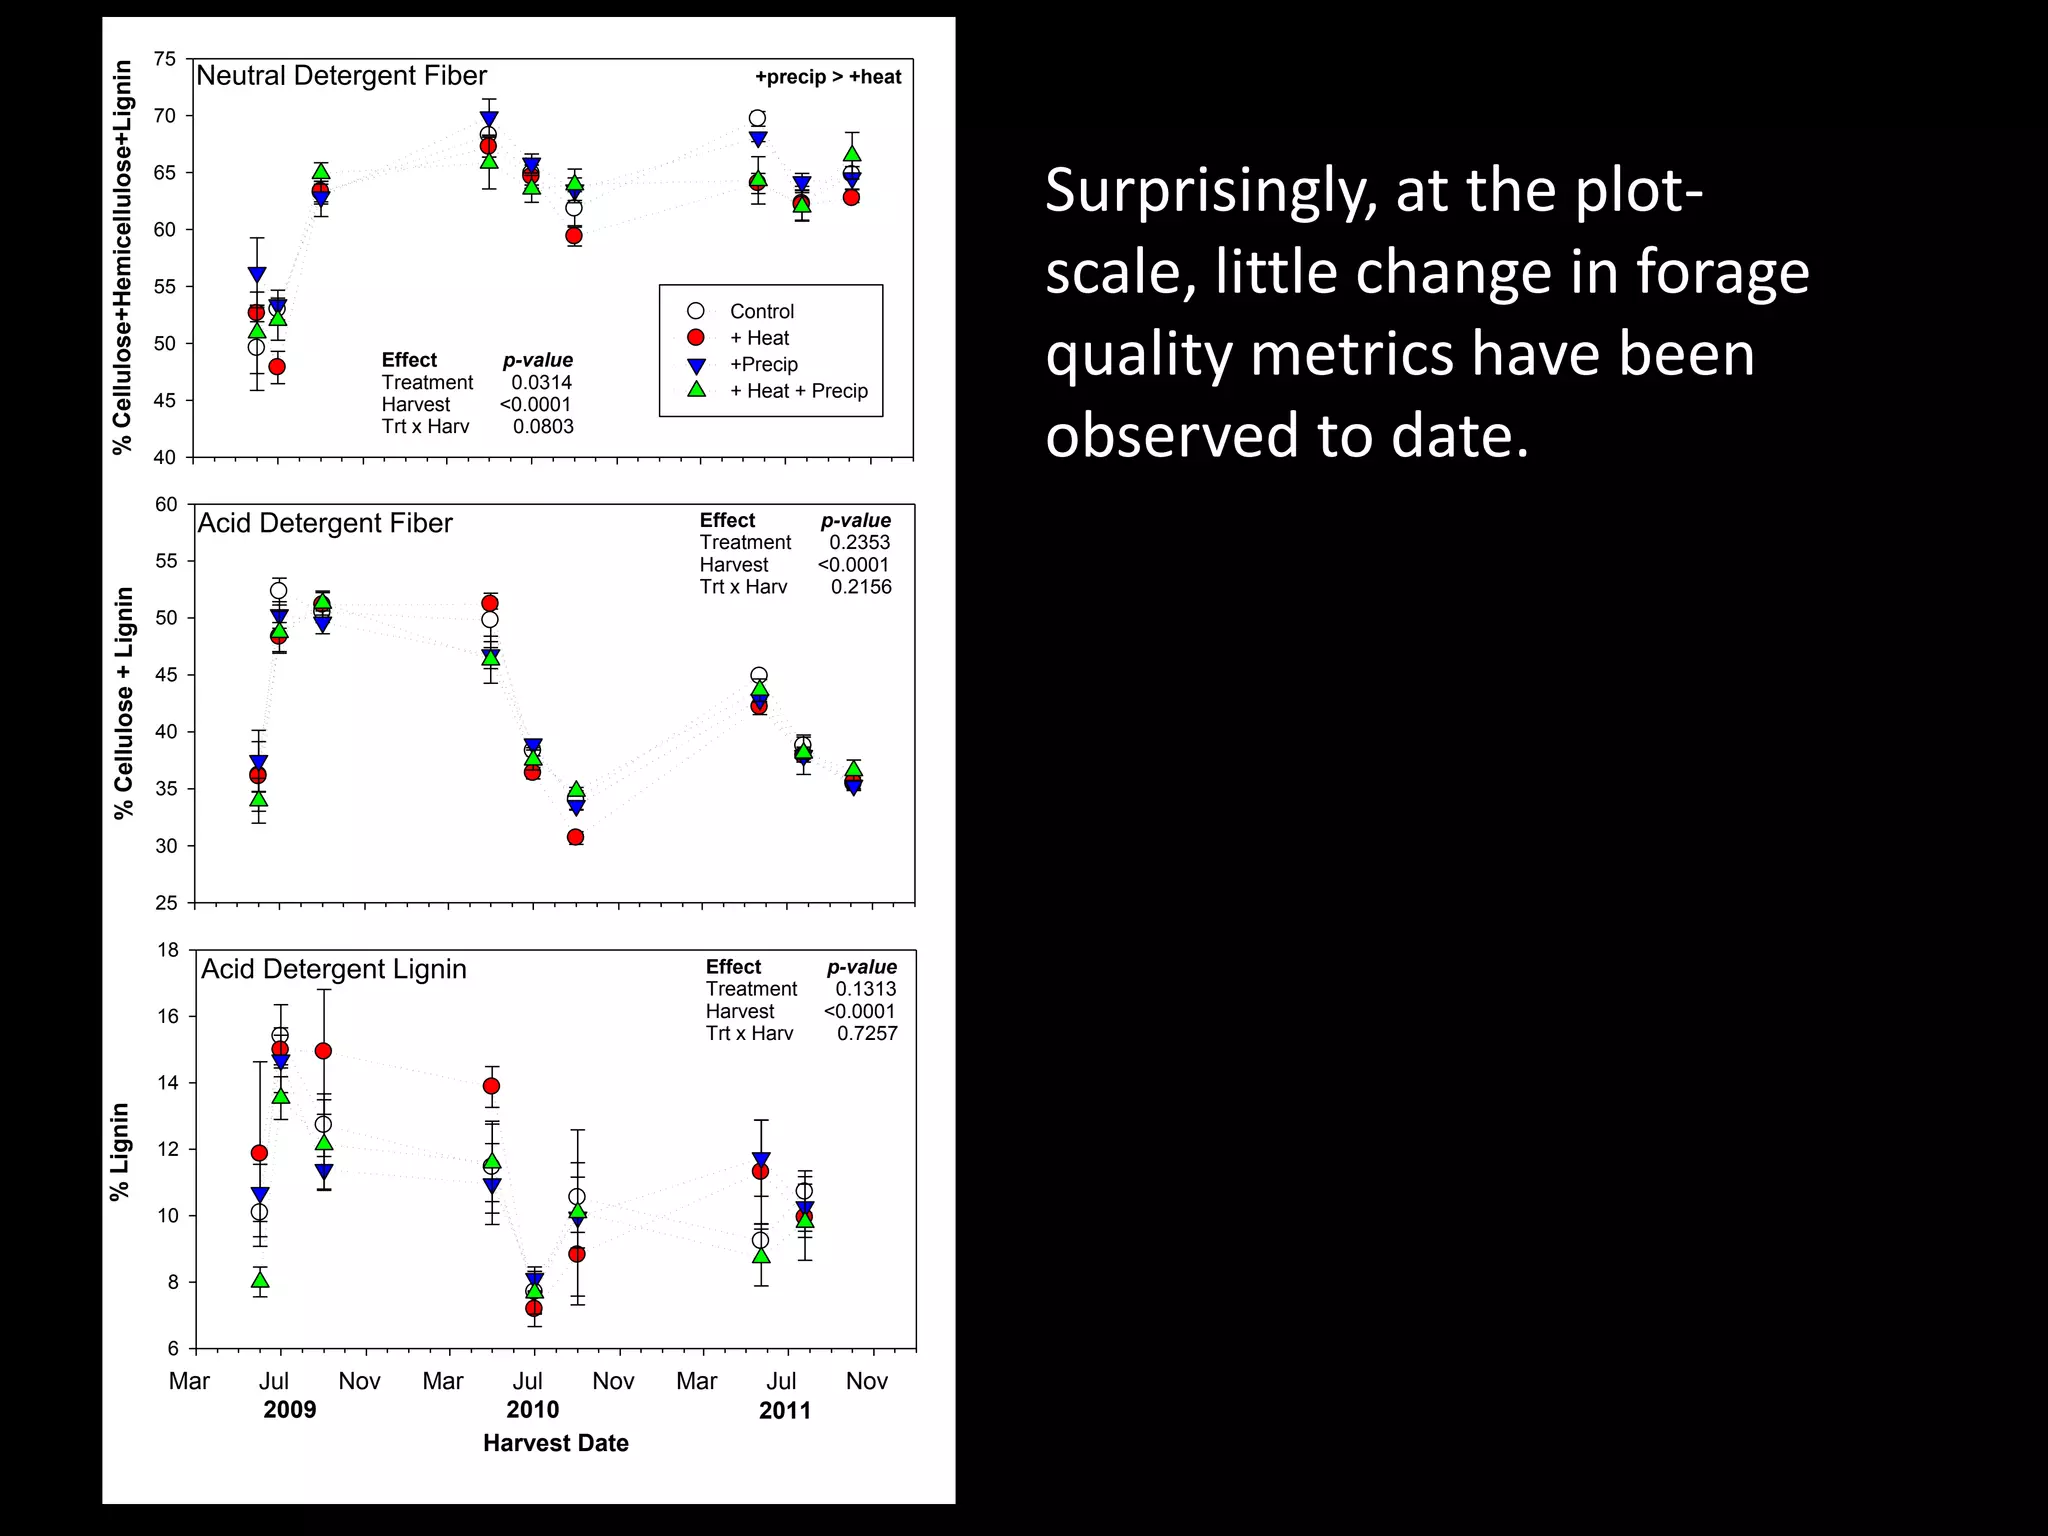
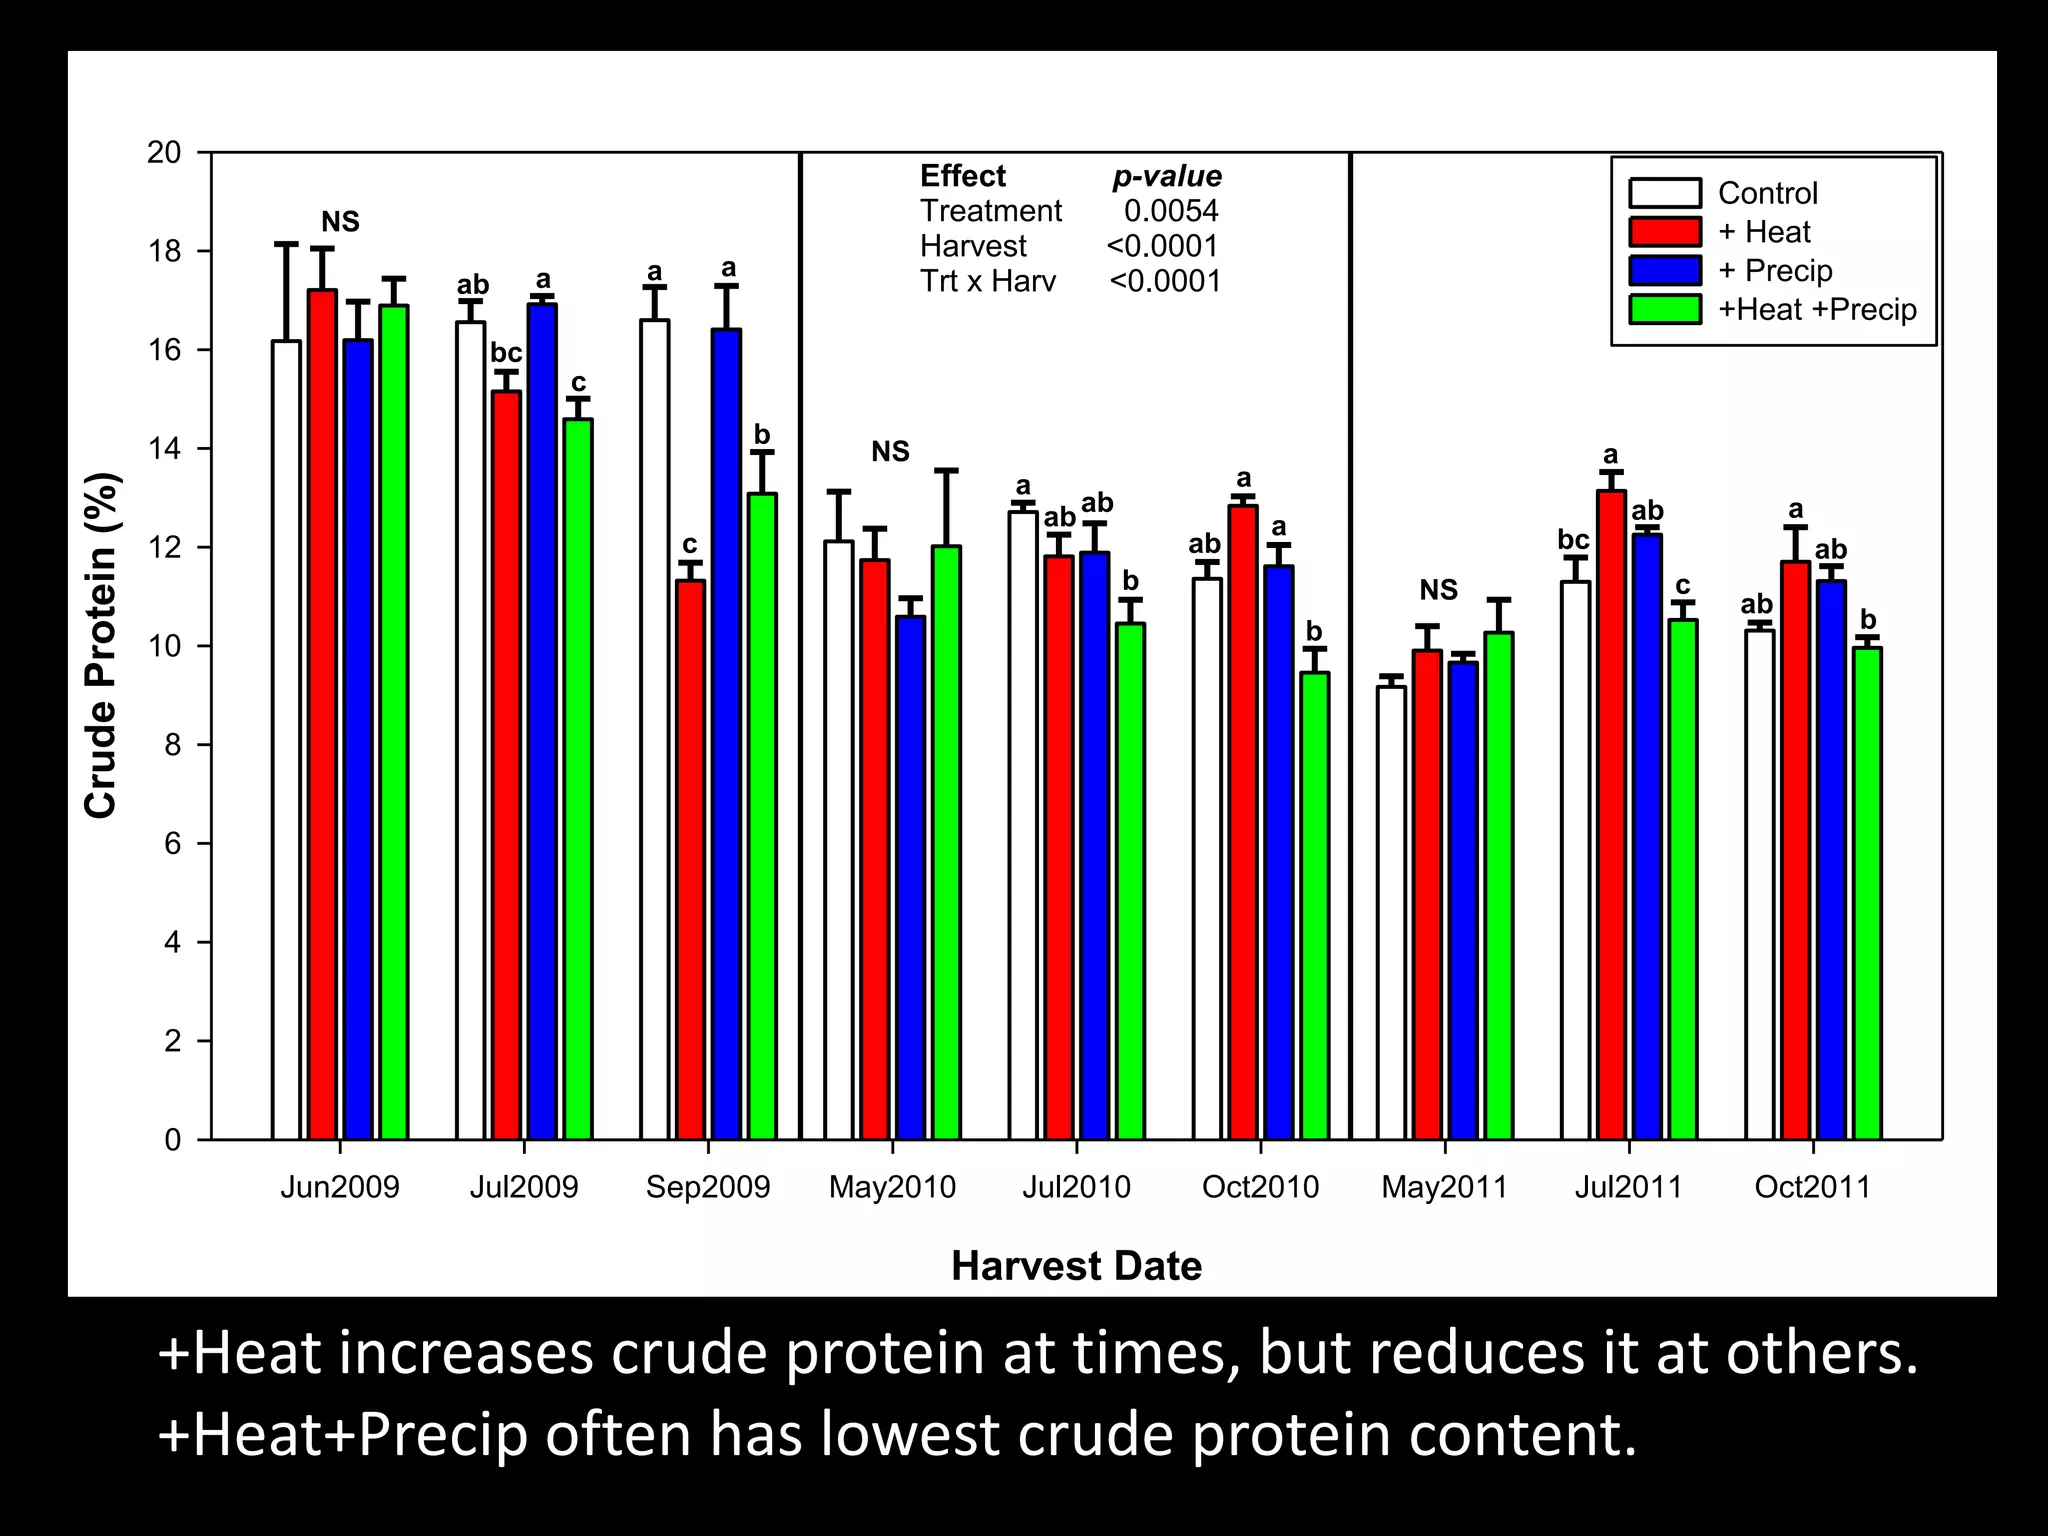
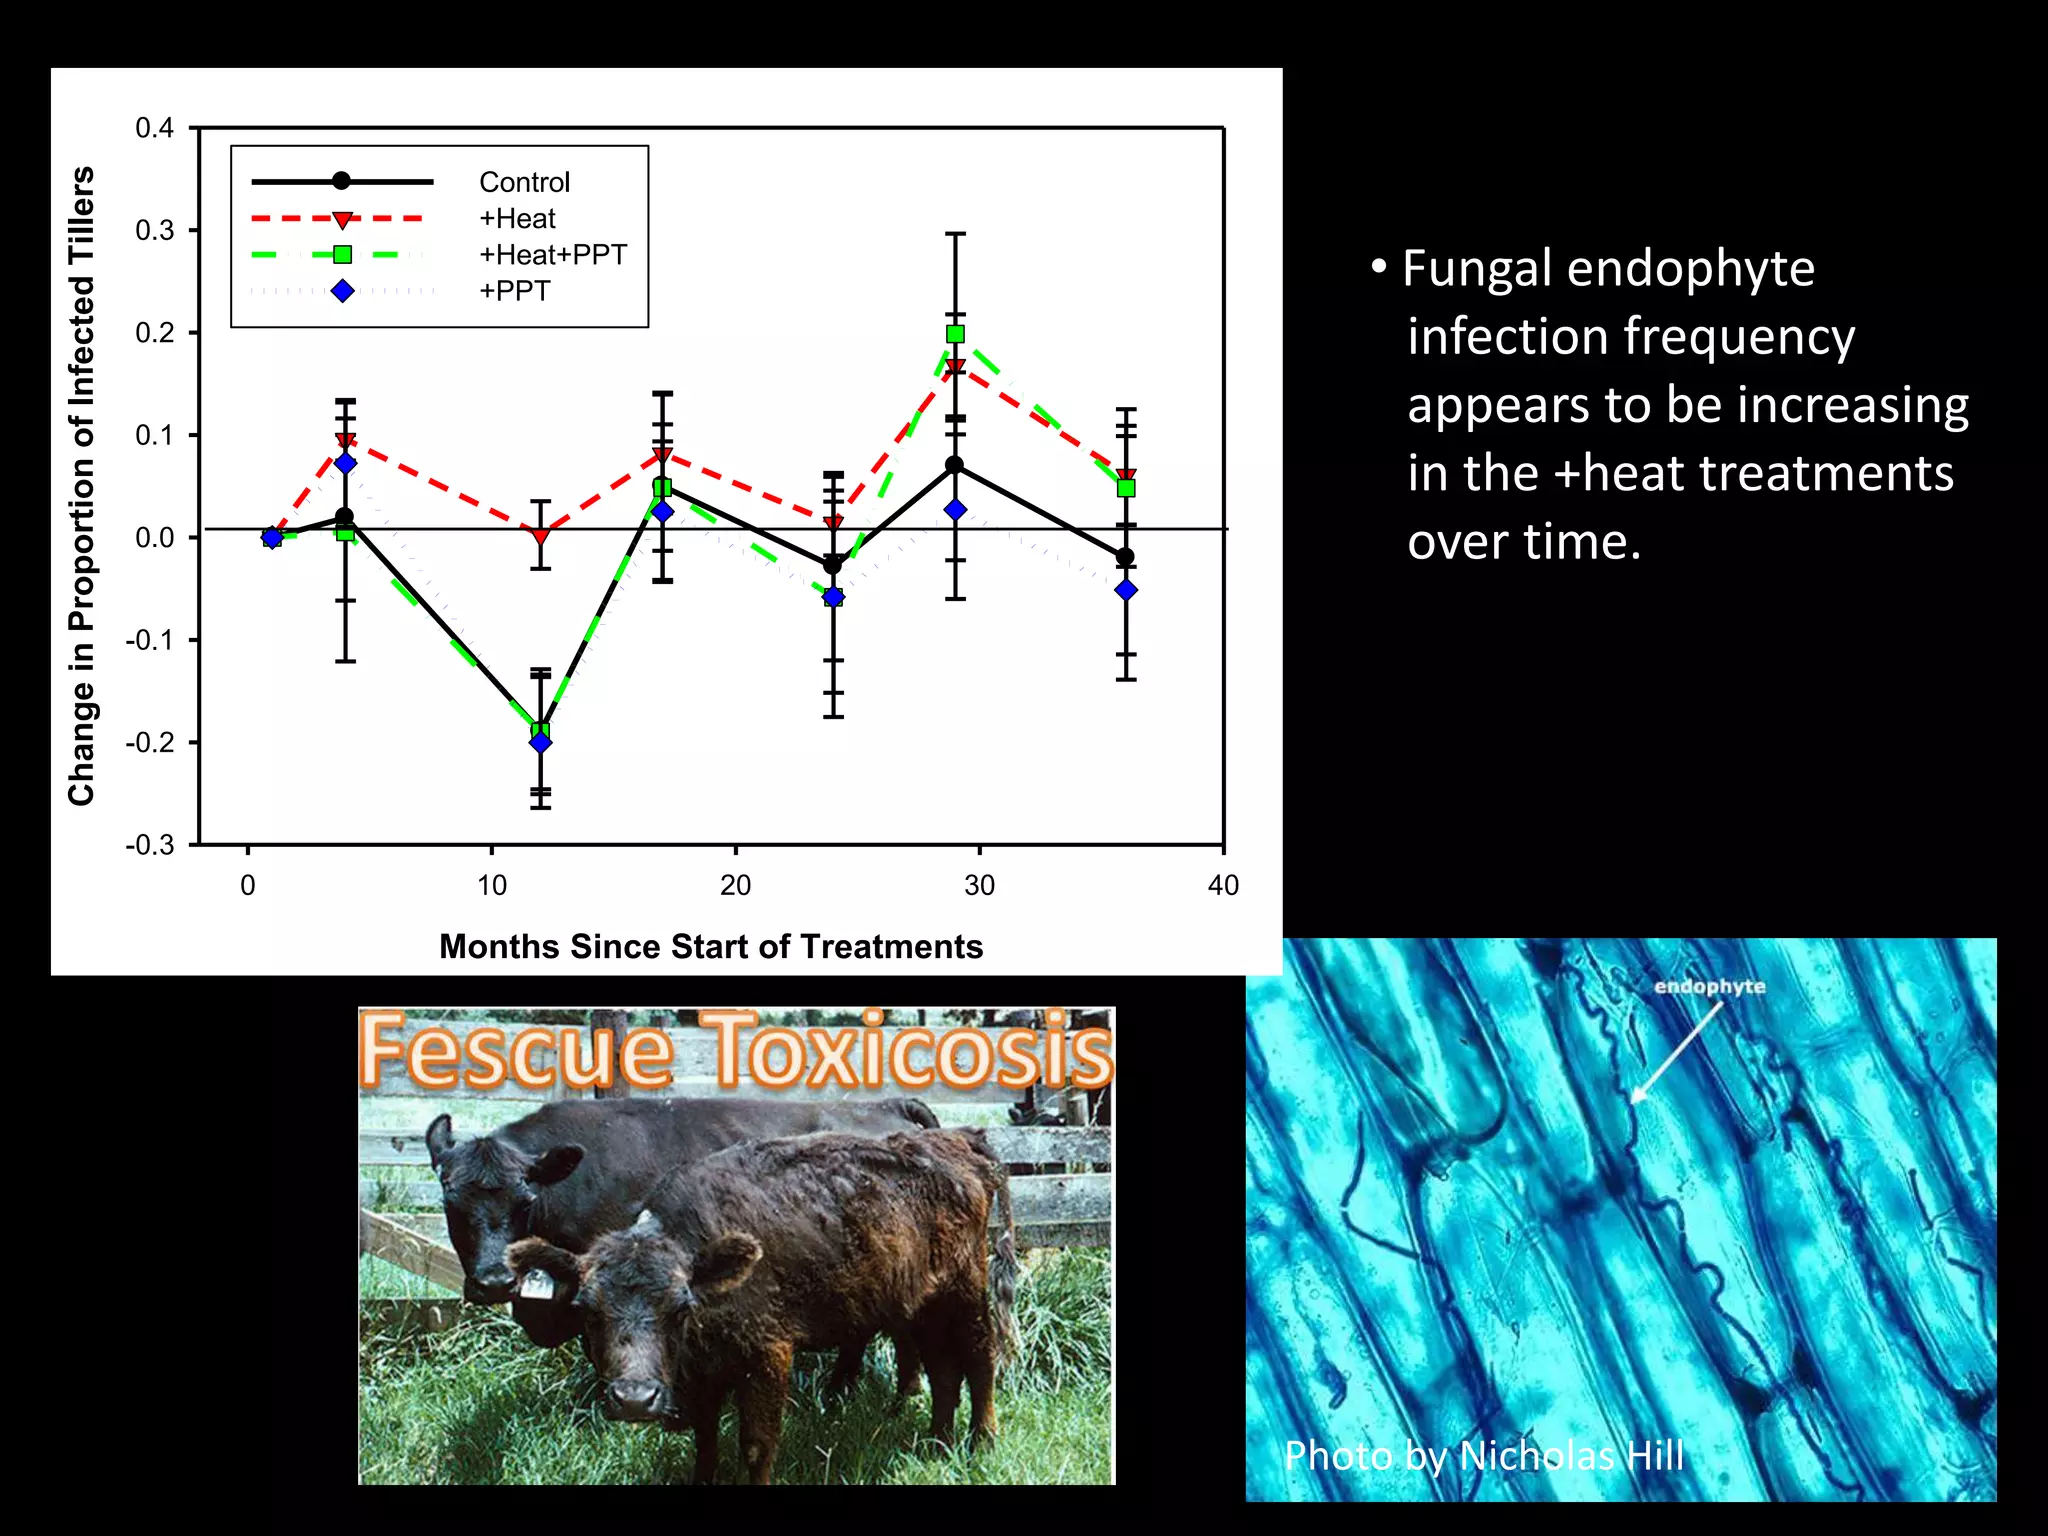
Effects of Climate Change on Pasture Production and
Forage Quality
Rebecca McCulley, Jim Nelson, Elizabeth Carlisle
Dept. of Plant & Soil Sciences, Univ. of Kentucky
Photo by Danny Walls.
http://www4.agr.gc.ca/AAFC-AAC/display-afficher.do?id=1294669298001&lang=eng
Climate Change
The number of days per year with peak temperature over
90ºF is expected to rise significantly, especially under a
higher emissions scenario as shown in the map above.
From: Kentucky Dept.
of Fish and Wildlife
Resources, “Action
Plan to Respond to
Climate Change in
Kentucky: A Strategy
of Resilience”
• What effect will changing climate have on
forage production? On forage quality? How
will plant species respond?
Photo by Nicholas Hill
Data Logger Control
Trailer
P1
Weather
Station
C1
P3 C3
HP3 H3
HP2 C2
H2 P2
HP1H1
H5
C5
C4
HP4
P4
P5
HP5
H4
SPPS
SP
PSPS
SP PS
PS
SP
PS
SP PS
PS SP
SP
PS
SP
PS
SP
SP
N
UK Forage Climate Change Study
+ 3 OC Day and Night + 30% Long-term Normal Precipitation
4 Treatments:
C- Ambient Control
H - Elevated Temperature (+3oC)
P - Increased Precipitation (+30% long-term ppt)
HP - Elevated Temp & Increased Ppt.
Jan Feb Mar Apr May Jun Jul Aug Sept Oct Nov Dec
MeanAnnualAirTemperature(
o
C)
-8
-4
0
4
8
12
16
20
24
28
32
MeanMonthlyPrecipitation(mm)
0
50
100
150
200
250
300
350
400
-30% precip
avg monthly precip
+30% precip
Monthly Mean Air Temp
+3o
C Warming Treatment
Planted with red & white clover, kentucky bluegrass, and tall fescue in Spring 2008.
Plugged bermuda grass in Fall 2008.
Experiment built Winter/Spring 2009. Experiment began May 1, 2009.
Veg Soil
North
Data Collection
Species Cover
Species Biomass
Light Interception
Forage Quality
Endophyte Infection Freq.
Secondary Compounds
Leaf Water Potential
Insect Herbivory
Magnaporthe grisea Damage
Barley Yellow Dwarf Virus
Species: E+/E- Tall Fescue; Bluegrass; Red/White Clover; Bermudagrass
Vegetation treated as a ‘haying operation’
1-m Soil Moist. (capacitance)
15-cm Soil Moist. (TDR)
Air / Soil Temp.
Soil Microbial Community
Nutrient Storage
N-mineralization
Root Ingrowth
Trace Gas Flux
Litter Decomposition
Immediately prior to first harvest – early June 2009
Harvest Date
TotalAbovegroundBiomass(gm-2)
0
100
200
300
400
500
600
700
800
Control
Heat
Precip
Heat+Precip
2009 2010 2011 2012
Spring Spring SpringSummer Summer SummerSummer SpringFall Fall Fall Fall
a
a
a
a
a
b
a
a a ab
c
bc
a
b
ab
a
bb
ab
a
b
b
a
a
a
b
b b
ab
bc
c
a
a
a
a a
b
a
ab
b
a a
b b
a a
a
a
Effect p-value
Treatment 0.017
Harvest <0.0001
Trt x Harv <0.0001
• What effect have these climate treatments had on forage production?
But what about species composition & forage quality?
Year
2009 2010 2011 2012
YearlyAbovegroundProduction(gm-2)
0
200
400
600
800
1000
1200
1400
1600
1800
Control
+ Heat
+ Precip
+ Heat + Precip
b
b
ab ab
a
b
b
a
Effect p-value
treatment 0.1152
year <0.0001
trt X year <0.0001
a
b
b
b
a
c bc
ab
4 Year Cumulative Aboveground Production
Climate Treatment
Control + Heat + Precip + Heat + Precip
AbovegroundPlantBiomass(gm
-2
)
0
1000
2000
3000
4000
5000
p=0.1889
Control
RelativeAbundance(%Biomass)
0
10
20
30
40
50
60
70
80
90
100
+ Heat
0
10
20
30
40
50
60
70
80
90
100
+ Precip
2009
0
10
20
30
40
50
60
70
80
90
100
C3 Grasses
C4 Grasses
Legumes
Weedy Forbs
2010
+ Heat + Precip
2009
0
10
20
30
40
50
60
70
80
90
100
201020122011 2011 2012
• Species composition change has buffered the
production response to +heat conditions.
• What effect does this have on forage quality?
Surprisingly, at the plot-
scale, little change in forage
quality metrics have been
observed to date.
Neutral Detergent Fiber
%Cellulose+Hemicellulose+Lignin
40
45
50
55
60
65
70
75
Control
+ Heat
+Precip
+ Heat + Precip
Acid Detergent Fiber
%Cellulose+Lignin
25
30
35
40
45
50
55
60
Acid Detergent Lignin
Harvest Date
Mar Jul Nov Mar Jul Nov Mar Jul Nov
%Lignin
6
8
10
12
14
16
18
2009 2010 2011
Effect p-value
Treatment 0.0314
Harvest <0.0001
Trt x Harv 0.0803
Effect p-value
Treatment 0.1313
Harvest <0.0001
Trt x Harv 0.7257
Effect p-value
Treatment 0.2353
Harvest <0.0001
Trt x Harv 0.2156
+precip > +heat
Harvest Date
Jun2009 Jul2009 Sep2009 May2010 Jul2010 Oct2010 May2011 Jul2011 Oct2011
CrudeProtein(%)
0
2
4
6
8
10
12
14
16
18
20
Control
+ Heat
+ Precip
+Heat +Precip
Effect p-value
Treatment 0.0054
Harvest <0.0001
Trt x Harv <0.0001
c
bc
ab a
NS
NS
a a
b
c
a
ab
ab
b
ab
a
a
b
NS
ab
bc
a
c
ab
ab
b
a
+Heat increases crude protein at times, but reduces it at others.
+Heat+Precip often has lowest crude protein content.
• Fungal endophyte
infection frequency
appears to be increasing
in the +heat treatments
over time.
Photo by Nicholas Hill
Months Since Start of Treatments
0 10 20 30 40
ChangeinProportionofInfectedTillers
-0.3
-0.2
-0.1
0.0
0.1
0.2
0.3
0.4
Control
+Heat
+Heat+PPT
+PPT
• In addition, endophyte-infected
tall fescue has higher
concentrations of toxic alkaloids
under the +Heat conditions.
Ergovaline(mgkg
-1
)
0.0
0.1
0.2
0.3
0.4
0.5
0.6
0.7
0.8
Ergovalinine(mgkg
-1
)
0.0
0.1
0.2
0.3
0.4
0.5
0.6
Treatment
Control +Heat +Precip +Heat +Precip
TotalErgots(mgkg
-1
)
0.0
0.2
0.4
0.6
0.8
1.0
1.2
1.4
a
ab
a
c
bc
bc
ab
c
c
bc
ab
a
Total Ergots
Effect p-value
trt 0.0025
harv <0.0001
trt*harv 0.2567
Conclusions:
• Pastures in a warmer Kentucky will be more dominated
by warm season grass species, and are likely to produce
forage similar in quantity and quality to that of today.
• However, increases in endophyte occurrence and
associated toxic compounds suggests fescue toxicosis will
intensify for cattle grazing persisting tall fescue stands.
Acknowledgements:
• Jim Nelson, Elizabeth Carlisle
• Glade Brosi, Jacob
Siegrist, Sarah Hall, Cody
Burton, Lindsay
Slaughter, Ben Leffew, Javed
Iqbal, & Marie Bourguignon
• Rachel, Jarred, Brian, Payton,
Alison, Amael, Alex, Sara, Luk
e, & Dan
• Collaborators
• Funding Sources

Effects of Climate Change on Pasture Production and Forage Quality

  • 1.
    Effects of ClimateChange on Pasture Production and Forage Quality Rebecca McCulley, Jim Nelson, Elizabeth Carlisle Dept. of Plant & Soil Sciences, Univ. of Kentucky Photo by Danny Walls.
  • 2.
  • 3.
    The number ofdays per year with peak temperature over 90ºF is expected to rise significantly, especially under a higher emissions scenario as shown in the map above. From: Kentucky Dept. of Fish and Wildlife Resources, “Action Plan to Respond to Climate Change in Kentucky: A Strategy of Resilience”
  • 4.
    • What effectwill changing climate have on forage production? On forage quality? How will plant species respond? Photo by Nicholas Hill
  • 5.
    Data Logger Control Trailer P1 Weather Station C1 P3C3 HP3 H3 HP2 C2 H2 P2 HP1H1 H5 C5 C4 HP4 P4 P5 HP5 H4 SPPS SP PSPS SP PS PS SP PS SP PS PS SP SP PS SP PS SP SP N UK Forage Climate Change Study + 3 OC Day and Night + 30% Long-term Normal Precipitation 4 Treatments: C- Ambient Control H - Elevated Temperature (+3oC) P - Increased Precipitation (+30% long-term ppt) HP - Elevated Temp & Increased Ppt.
  • 6.
    Jan Feb MarApr May Jun Jul Aug Sept Oct Nov Dec MeanAnnualAirTemperature( o C) -8 -4 0 4 8 12 16 20 24 28 32 MeanMonthlyPrecipitation(mm) 0 50 100 150 200 250 300 350 400 -30% precip avg monthly precip +30% precip Monthly Mean Air Temp +3o C Warming Treatment
  • 7.
    Planted with red& white clover, kentucky bluegrass, and tall fescue in Spring 2008. Plugged bermuda grass in Fall 2008. Experiment built Winter/Spring 2009. Experiment began May 1, 2009.
  • 8.
    Veg Soil North Data Collection SpeciesCover Species Biomass Light Interception Forage Quality Endophyte Infection Freq. Secondary Compounds Leaf Water Potential Insect Herbivory Magnaporthe grisea Damage Barley Yellow Dwarf Virus Species: E+/E- Tall Fescue; Bluegrass; Red/White Clover; Bermudagrass Vegetation treated as a ‘haying operation’ 1-m Soil Moist. (capacitance) 15-cm Soil Moist. (TDR) Air / Soil Temp. Soil Microbial Community Nutrient Storage N-mineralization Root Ingrowth Trace Gas Flux Litter Decomposition
  • 9.
    Immediately prior tofirst harvest – early June 2009
  • 13.
    Harvest Date TotalAbovegroundBiomass(gm-2) 0 100 200 300 400 500 600 700 800 Control Heat Precip Heat+Precip 2009 20102011 2012 Spring Spring SpringSummer Summer SummerSummer SpringFall Fall Fall Fall a a a a a b a a a ab c bc a b ab a bb ab a b b a a a b b b ab bc c a a a a a b a ab b a a b b a a a a Effect p-value Treatment 0.017 Harvest <0.0001 Trt x Harv <0.0001 • What effect have these climate treatments had on forage production? But what about species composition & forage quality? Year 2009 2010 2011 2012 YearlyAbovegroundProduction(gm-2) 0 200 400 600 800 1000 1200 1400 1600 1800 Control + Heat + Precip + Heat + Precip b b ab ab a b b a Effect p-value treatment 0.1152 year <0.0001 trt X year <0.0001 a b b b a c bc ab 4 Year Cumulative Aboveground Production Climate Treatment Control + Heat + Precip + Heat + Precip AbovegroundPlantBiomass(gm -2 ) 0 1000 2000 3000 4000 5000 p=0.1889
  • 14.
    Control RelativeAbundance(%Biomass) 0 10 20 30 40 50 60 70 80 90 100 + Heat 0 10 20 30 40 50 60 70 80 90 100 + Precip 2009 0 10 20 30 40 50 60 70 80 90 100 C3Grasses C4 Grasses Legumes Weedy Forbs 2010 + Heat + Precip 2009 0 10 20 30 40 50 60 70 80 90 100 201020122011 2011 2012
  • 15.
    • Species compositionchange has buffered the production response to +heat conditions. • What effect does this have on forage quality?
  • 17.
    Surprisingly, at theplot- scale, little change in forage quality metrics have been observed to date. Neutral Detergent Fiber %Cellulose+Hemicellulose+Lignin 40 45 50 55 60 65 70 75 Control + Heat +Precip + Heat + Precip Acid Detergent Fiber %Cellulose+Lignin 25 30 35 40 45 50 55 60 Acid Detergent Lignin Harvest Date Mar Jul Nov Mar Jul Nov Mar Jul Nov %Lignin 6 8 10 12 14 16 18 2009 2010 2011 Effect p-value Treatment 0.0314 Harvest <0.0001 Trt x Harv 0.0803 Effect p-value Treatment 0.1313 Harvest <0.0001 Trt x Harv 0.7257 Effect p-value Treatment 0.2353 Harvest <0.0001 Trt x Harv 0.2156 +precip > +heat
  • 18.
    Harvest Date Jun2009 Jul2009Sep2009 May2010 Jul2010 Oct2010 May2011 Jul2011 Oct2011 CrudeProtein(%) 0 2 4 6 8 10 12 14 16 18 20 Control + Heat + Precip +Heat +Precip Effect p-value Treatment 0.0054 Harvest <0.0001 Trt x Harv <0.0001 c bc ab a NS NS a a b c a ab ab b ab a a b NS ab bc a c ab ab b a +Heat increases crude protein at times, but reduces it at others. +Heat+Precip often has lowest crude protein content.
  • 19.
    • Fungal endophyte infectionfrequency appears to be increasing in the +heat treatments over time. Photo by Nicholas Hill Months Since Start of Treatments 0 10 20 30 40 ChangeinProportionofInfectedTillers -0.3 -0.2 -0.1 0.0 0.1 0.2 0.3 0.4 Control +Heat +Heat+PPT +PPT
  • 20.
    • In addition,endophyte-infected tall fescue has higher concentrations of toxic alkaloids under the +Heat conditions. Ergovaline(mgkg -1 ) 0.0 0.1 0.2 0.3 0.4 0.5 0.6 0.7 0.8 Ergovalinine(mgkg -1 ) 0.0 0.1 0.2 0.3 0.4 0.5 0.6 Treatment Control +Heat +Precip +Heat +Precip TotalErgots(mgkg -1 ) 0.0 0.2 0.4 0.6 0.8 1.0 1.2 1.4 a ab a c bc bc ab c c bc ab a Total Ergots Effect p-value trt 0.0025 harv <0.0001 trt*harv 0.2567
  • 21.
    Conclusions: • Pastures ina warmer Kentucky will be more dominated by warm season grass species, and are likely to produce forage similar in quantity and quality to that of today. • However, increases in endophyte occurrence and associated toxic compounds suggests fescue toxicosis will intensify for cattle grazing persisting tall fescue stands.
  • 22.
    Acknowledgements: • Jim Nelson,Elizabeth Carlisle • Glade Brosi, Jacob Siegrist, Sarah Hall, Cody Burton, Lindsay Slaughter, Ben Leffew, Javed Iqbal, & Marie Bourguignon • Rachel, Jarred, Brian, Payton, Alison, Amael, Alex, Sara, Luk e, & Dan • Collaborators • Funding Sources

Editor's Notes

  • #4 Fromhttp://fw.ky.gov/kfwis/stwg/2010Update/Climate_Change_Chapter.pdf
  • #5 Could add some fescue – endophyte stuff here to get that subject introduced.
  • #7 Shows how the temperature and precip treatments are being applied – Drat the line isn’t visible for the warming treatment. May have to add by hand.
  • #15 Weed forbs are – white campion, dock, prickly lettuce, virginiapepperweed, sorrel, veronica. Point here – in control and +Precip treatments – C3 grasses remain dominant (tall fescue, Kentucky bluegrass), but in the +Heat and +Heat+Precip treatments the C4 grasses are much more dominant (although traditional C3 grasses are persisting and still dominant in the spring – so far). – Need to connect the dots with lines to facilitate viewing. Will need SigmaPlot graph.
  • #16 These species are tall fescue and KY bluegrass on left (C3 dominants in control and +precip) and annual crabgrass and perennial bermudagrass (C4’s) on the right.
  • #18 2009 data have been checked. This is what we got. I don’t know how to explain it. The dots should be connected. Will ask JN to send graph so that I can fix in SigmaPlot.
  • #20 Add a picture of toxicosis beef symptoms. Perhaps only include the last graph – make the colors reflect the prior graphs.
  • #21 Average of Sept 2009, May/Oct 2010, May/Oct 2011 – values are always highest in fall sample, but treatment effect is consistent across harvests.Could change color of the bars to reflect prior graphs.
  • #22 Need to work on this.