1. Workshop: Measures of Central Tendency
Central Tendency
SUBJECT: Mathematics 3rd GRADE
TEACHER: Julieth Cadena and Carla Arbini GROUP: A-B-C-D-E
STUDENT’S NAME: AVERAGE:
STANDARD: Find measures of Central Tendency in a data set.
Learn:
MODE
When some values appear the same number of times, there is more than 1 mode. When
all values occur only once, there is no mode.
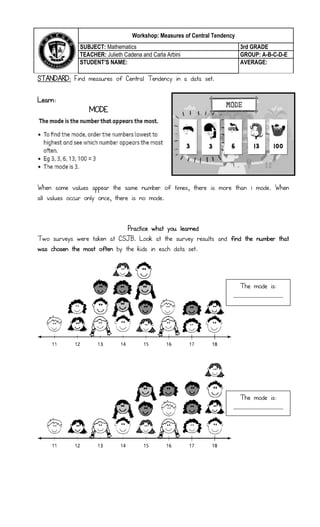
Practice what you learned
Two surveys were taken at CSJB. Look at the survey results and find the number that
was chosen the most often by the kids in each data set.
The mode is:
___________________
The mode is:
___________________
2. Activity #1
Directions: Find the mode for each data set. Follow the model.
Learn:
RANGE
Practice what you learned
Look at the following price list from a fast food restaurant. Which is its range of
prices?
Mode is the most popular item in the set. Remember: Mode=Most
So, mode means the coolest
item, just like me!
3. Step 1: Identify the greatest and smallest number in the data set.
Greatest price: _____________________ Smallest price: _______________________
Step 2: Subtract the two numbers to get the range.
The range of prices of the restaurant is __________________________
Activity #2
Directions: Find the range for each data set. Follow the model.
Test Practice
The chart shows the record lengths
of six venomous snakes found in
Florida. What is the range of the
snake lengths?
Ordered list:
________________________________________
Range: ________-__________=______
5. Quick Review
1. If I want to know what the most popular item in a data set is, I look for the…
a. Mode B. Range
2. If I want to know what the difference between the smallest and greatest number
of a data set is, I look for the…
a. Mode B. Range
3. A litter of puppies is 8 weeks old. Find the mode weight of the puppies.
5. The numbers of followers of some of my friends on Instagram are:
5. 490, 200, 223, 512, 60, 670, 125, 239, 1.000, 5.245
Find the range of followers: _____________________________________________
6. The chart below shows the shirt colors that a class used for the Cultural week at
CSJB.
Observe the chart and organize the information.:
Color Number of each one
Black
Pink
Gray
Blue
Yellow
Orange
Green
Red
Now, answer True or false according to data set in the chart.
a. The mode of the data set is Red _______________
b. There is more than 1 mode in the data set ________________
c. The mode is black and pink _____________
The mode is:
___________________