SlideShare a Scribd company logo
1 of 20
Download to read offline
EARTH SURFACE PROCESSESAND LANDFORMS, VOL. 13, 335-354 (1988)
ACID RAIN DAMAGE TO CARBONATE STONE:A
QUANTITATIVE ASSESSMENT BASED ON THE AQUEOUS
GEOCHEMISTRY OF RAINFALL RUNOFF FROM STONE
MICHAEL M.REDDY
United States Geological Survey, Denver Federal Center, Lakewood, Colorado 80225, U.S.A.
Received I5 October 1986
Revised 8 May 1987
ABSTRACT
An onsite experimental procedure was used to identify and quantify acid rain damage to carbonate stone,based on the
change in rain runoff chemical composition.Observed changes in runoff from stone are attributed to the interactionof
acidicspeciespresent in the rain with the stonesurface.Onsitedata obtained during the summer and fall of 1984at three
locations in the northeastern United States indicate that carbonate stone surfacerecession is related to acid deposition.
Although the study is continuing, current data are not adequate to distinguish differences in the acid-stone reaction
between limestoneand marble nor among the three study sites.A single linear relation between carbonate stone surface
recession (the dependent variable)and hydrogen ion loading to the stone surface (theindependent variable)appears to
describe the data set.
KEY WORDS Limestone Marble Acid rain Carbonate stone damage
INTRODUCTION
Enyironmental damage to commercial materials and historical structures has been recognized over the past
century, and has been the focus of recent research. Damage to both metals and building stone has been
documented in several areas of Europeand North America (Environmental Resources, 1983;Del Monte et al.,
1981;Camuffo et al., 1982;Chengand Castillo, 1984).Research on building stone damage by air pollution has
focused on the net long term effect (Sharp et al., 1982)and the specificinfluence of sulphur dioxide (Luckat,
1977).In the United States damage to carbonate stone by sulphur dioxide has been reported by Haynie (1983),
Winkler (1987) and Cheng et al. (1987).
Previous studies of environmental damage to carbonate stone have dealt with the influence of air pollutants
in general and sulphur dioxide in particular. Air pollution levels in the northeastern United States have
decreased during the past decade. For example Husar (1986) states: ‘After about 1970 strong regional
differences in trends of sulphur dioxide emissjons emerged. The most distinctive differences were between the
regions north and south of the Ohio River.. Southeastern Canada (Region A) and the northeastern United
States (Region B) show distinct downward trends.’
Air pollutant damage to building stoneand, in particular, that due to sulphur dioxide, may be less significant
currently than in the past because of lowered urban pollution. In contrast to the decrease in sulphur dioxide
concentration levelsdiscussed by Husar (1986),acidic deposition in the northeastern United States appears to
be at high levels. Stensland et aL (1986)have conducted an exhaustive review of published data and conclude
‘Precipitation is currently more acidic in parts of the eastern United States than it was in the mid-1950s or mid-
1960s; however, the amount of change and its mechanisms are in dispute’.
0197-9337/88/04033 5-20$10.00
01988 by John Wiley & Sons, Ltd.
336 M. M. REDDY
The different components of acid loading may play sjgnjficantly different roles i
n the damage to carbonate
stone. These components include wet and dry deposition. Wet deposition refers to the acidity of rain and is
determined by the hydrogen ion concentration. Acidity is usually expressed in terms of pH which is the
negative logarithm of the hydrogen ion concentration. The term acid precipitation is often used for
precipitation with pH below 5.6, which is the pH of pure water in equilibrium with atmospheric carbon
dioxide.Dry deposition refers to the deposition and accumulation of acidic speciesin the absence of rain. This
includes deposition of acidic particulates and adsorption of acidic gases.A recent United Nations publication
(Air-Borne Sulfur Pollution Report, 1984)states ‘Although the relative importance of each process is still not
fully known, modelling and mass balance studies indicate that wet and dry depositions of sulphur compounds
are of equal importance in northern Europe and North America. While in remote areas distant from sources
dry deposition of sulphur seems to be of lesser importance, it has been concluded that dry deposition is
relatively more important than wet depositions in areas like the Ohio Valley+lose to major emission sources.’
Forms and pathways that are associated with acid atmospheric deposition to exposed surfaces in the
environment have been recently reviewed by Reuss and Johnson (1986).
Previous work
The study of damage to carbonate building stone by air pollutants has focused on the reaction of gaseous
sulphur dioxide forming calcium sulphate minerals on the stone surface. This surface-sulphate formation
process has been a particularly effectivedamage mechanism in areas with high sulphur dioxide concentrations
in air. Sulphate formation damage is influenced by those factors which control transfer of sulphur dioxide to
the liquid film (when present) on the stone surface.
Procedures used to characterize carbonate stone erosion have involved characterization of surface crusts on
carbonate stone (Del Monte et al., 1981;Camuffo et al., 1982;Cheng and Castillo 1984;Camuffo et al., 1984;
and Cheng et al., 1987),weight loss measurements (Haynie, 1983),microerosion measurements (High and
Hanna, 1970;Sharp et al., 1982;and Trudgill et al., 1981),and comparison of current stone dimensions with
historic records (Husar et al., 1985;Sharpet a!., 1982).Results obtained by previous investigations of carbonate
stone damage have emphasized the importance of atmospheric pollutants, contaminants on the stone surface
which facilitate pollutant transformation and the influence of rain.
High and Hanna (1970),in an early stream-bed geomorphology application of micro-erosion techniques,
stress that numerous microerosion measurements must be made over a large area before an average erosion
rate can be considered significant (seealso Trudgill et al., 1981).Sharp et al. (1982)using both a microerosion
technique and a historical-based retrospective approach at St. Paul’s Cathedral, London, England reported
that weathering rates differed depending on the stone surface microhydrology. Weathering rates were greater
in drip zones than in exposed flow zones. Husar et al. (1985) in a retrospective tombstone study in the
northeastern United States,reported a linear relation between weathering rates and estimated sulphur dioxide
concentrations. A value of 0.1micrometres per year per part per billion sulphur dioxide was derived as the best
estimate for weathering of fine grain marble from New York City.
Haynie (1983)related marble erosion in St. Louis, Missouri to stone surface time-of-wetness, wind speed,
temperature and air pollutant concentrations. Stone surface time-of-wetness was the only statistically
significantfactor in stone damage. The influenceofsulphur oxides was found not to be significant.Chengand
Castillo (1984)reported carbonate stone damage in Schenectady, New York attributable to sulphur dioxide
uptake facilitated by soot particles on the stone surface. Luckat (1977)reported onsite damage to carbonate
stone at the Cologne Cathedral, West Germany correlated with the rate of sulphur dioxide uptake.
Del Monte et al. (1981)examining marble deterioration in northern Italian urban areas, reported that
carbonaceous particles, serving as catalysts, are important agents of deterioration. Camuffo et al. (1982)
stressed the importance of rainfall in carbonate stone deterioration: moisture condensation was felt to play
only a minor role. Studies in Venice,Italy by Camuffo et al. (1984)where rain acidity is uncommon, have been
reported to demonstrate only rare instances of acid rain damage to carbonate stone.
Acid deposition damage to carbonate stone may be an important stone damage mechanism, but little
quantitative data is available relating the acid loading to stone deterioration (Sherwood and Doe, 1984).In
addition to onsite studies, laboratory investigations (Reddy et al., 1981)and chemical modelling (see for
ACID RAIN DAMAGE TO CARBONATE STONE 331
example Nordstrom et al., 1979) can be used to estimate the extent of acid dissolution of carbonates.
Laboratory studies and chemical modelling may have direct application in understanding acid rain damage to
carbonates. However, the fact remains that the most relevant demonstration of acid deposition damage to
carbonate stone,onsite measurements of representativecarbonatestone under carefully monitored conditions,
has yet to be performed.
Purpose and scope
Research in the fieldsof geochemistry (Reddy et al.,1981 and references therein)and geomorphology (High
and Hanna, 1970)demonstrates that reaction of calcium carbonate with aqueous solutions in the laboratory
and onsite follows behaviour anticipated from chemical equilibrium and kinetics. However, little fundamental
understanding of the processes involved in environmental damage to stone is available. In particular,
quantitative estimates of carbonate stone-acid precipitation reactions are not reliable. This situation leads to
large uncertainties in projecting acid precipitation impacts on limestone and marble.
The objective of this research programme is to characterize and quantify environmental influences on
carbonate stone damage. The programme focuswill be to address the influenceof acidic precipitation on stone
damage. Where possible the separate contributions of wet and dry deposition on the observed stone
deterioration will be evaluated.
This report presents initial data obtained with an onsite,acid rain-stone damage technique at three locations
in the northeastern United States during the last half of 1984.Work wasdonein conjunction with the National
Acid Precipitation Assessment Program (NAPAP) effort to characterize acid rain damage to carbonate
building stone (Sherwood and Doe, 1984).Onsite measurements of physical and chemical characteristics of
rainfall and runoff from stone, and laboratory analysis of rainfall and runoff from stone samples have been
used to estimate stone dissolution and acid loading to limestone and marble reference stones. Exposure
conditions have been patterned after the American Society for Testing Materials (ASTM) procedures
developed for metal damage studies (Flinn et al., 1986).
A multivariate statistical analysis, using linear regression models, has been conducted to identify
environmental conditions related to carbonate stone damage. This preliminary analysis has been restricted to
those experimental and environmental variables available at the time of sample collection. Detailed
climatology, meteorology, and air pollution data will be available in due course,and can be incorporated into a
more general analysis of the onsite data.
The onsite experimental procedure consisted of exposing carbonate stones and monitoring changes in rain
composition due to rain reaction with the stone surface. Stones, representative of those used in commerce
(Ross and Knab, 1984; Ross, 1985) were boldly (i.e. standing out prominently) exposed at 30" from the
horizontal, facing south and were uncovered at all times. Exposure conditions were selected to be the same as
those used for other materials damage studies sponsored by the National Acid Precipitation Assessment
Program (see for example Flinn et al., 1986). Exposure angle and orientation ensure that the samples will
receive the maximum solar radiation during the annual solar cycle. While the onsite experiment employing a
fixedorientation was not planned to reflect all actual orientations and exposures of stone in the environment,
these conditions were felt to allow direct comparison between several sites. Exposure angle influence on the
measured damage is currently being investigated.
During environmental exposures,processe:bther than acid attack can occur and lead to carbonate damage.
The experimental procedure adopted in this study was planned to minimize extraneous experimental
variability. It was felt that runoff experiments used here would have several advantages in the assessment of
acid rain damage to stone. Equipment, analytical procedures, and quality control techniques are readily
available. Moreover, runoff experiments were anticipated to yield carbonate stone damage rates in a relatively
short time frame. In contrast weight loss experiments, for example, may require time intervals of several years
to yield valid carbonate stone damage rates. These experimental attributes can be contrasted with
disadvantages which deal mainly with separation of the effects of wet and dry acidic deposition on stone
damage.Thesedisadvantages involvethe interaction of severalenvironmental processesincluding: (1)Wet and
dry deposition; (2)Gaseous pollutants and wet deposition; (3) Biological effects and wet deposition; and (4)
Aging of the stone surface and wet deposition.
338 M.M. REDDY
Several descriptions of the installation and operation af materials damage field sites have been recently
published (Sherwood and Doe, 1984; Reddy et al., 1985, a and b; Reddy and Werner, 1985).
PROCEDURES
At the present time, four NAPAP research stone-exposure sites have been established. These sitesare operated
in the eastern United States at Newcomb, New York; Chester, New Jersey; Washington, D.C.; and Research
Triangle Park, North Carolina (Figure 1).
Site design
Four stone-exposure racks, fabricated of polypropylene and capable of holding two stones each are located
at each research site. Stone-exposure racks have been designed to facilitate collection of rain runoff from the
stone surface (Figure 2) for comparison with the composition of incident rainfall. Stones are one foot by two
feet by two inches in size, are sloped (30" to horizontal) and are facing south.
The design of the stone-runoff racks incorporated features to minimize the influence of processes other than
rain interaction with the stone surface. Specific experimental complications that were avoided include: (1)
Development of standing water on the stone surface; (2)Presence of accumulated moisture on the back side of
the stones; (3) Accumulation of particulate material in the runoff sample; and (4) Exposure of an ill-defined
stone surface rainfall-interception area. Reference stones are held slightlyoff the collector base by rails. Slotted
and circular openings (shown in Figure 2 in an unoccupied rack) are intended to reduce the accumulation of
moisture on the lower stone surface. Incident rainfall strikes the inclined (30")stone surface and runs over the
stone. At the base of the rack, this runoff is directed through a plastic tube to a covered plastic collection bottle.
A glass wool filter was placed in the tube to prevent particulate material from entering the sample-collection
bottle.
Details of runoff experiment operation were developed based on actual onsite operation of the equipment;
Del
Figure 1. Map showing stone-exposuresite locations in the eastern United States
ACID RAIN DAMAGE TO CARBONATE STONE 339
A
B
Figure 2. (A) A typical completed research stone-exposure site with research stones in place; (B) An isometric projection of a single
research stone-exposure rack; racks are mounted in pairs with four sets per location
then these details were incorporated into a Site Operators Manual that is supplied to each siteand members of
NAPAP Task Group G. A brief summary of the Site Operators Manual is presented in the Appendix.
Limestoneand marble stonesare located in two of the racks; a third empty rack, (withouta stone)is used asa
control (hereafter referred to as a blank sample). At the end of each rainstorm, after measurement of the total
runoff volume,a one litre subsample,or the total runoff if lessthan one litre, was taken for subsequent analysis.
Runoff volume, specificconductance, and pH measurements were determined at the research-stone exposure
340 M. M. REDDY
sitesas soon as possible after collection, typically within a few hours. Samples then werefiltered through a0.45-
pm pore-size Schleicherand Sdhuellfilter (grade OE67),placed in a clean polyethylene bottle, and sent to the
U.S. Geological Survey National Water Quality Laboratory in Denver, Colorado, for chemical analysis.(Any
use of trade names is for identification purposes only and does not constitute endorsement by the US.
Geological Survey.) Samples from Chester, N. J. were not filtered onsite. Unfiltered samples were mailed
directly to Denver. Details of the onsite and laboratory procedures, as well as a brief summary of results, are
given by Reddy and Werner (1985).Sample preparation, analytical procedures, and laboratory quality control
procedures for the water sample are described by Fishman and Friedman (1985).
Ancillary study-site measurements
Each research-stone exposure site has other materials-damage experiments,in addition to those discussedin
this report. These supplemental data include an array of meteorological, climatological, air pollution, and
rainfall chemistry measurements. The character of the general environment in which the rock samples were
exposed has been given by Flinn et al. (1986).
Analytical techniques and quality control procedures
Chemical analysis of rain and runoff samples were performed by the U.S.Geological Survey National Water
Quality Laboratory located in Arvada, Colorado. Analytical procedures and techniques as well as laboratory
quality control were performed by the laboratory staff. A discussion of the chemical analysis of the runoff
sample has been recently published (Reddy and Werner, 1985).Blank and runoff from stone pH and specific
conductance were measured in the field. Upon receipt of samples in the laboratory in Denver, pHand specific
conductance were remeasured, and sample alkalinity was determined. Each sample was analysed for calcium
and sulphate ion concentrations. On selected samples more extensive chemical analyses were performed as a
quality control procedure. In addition, blank, duplicate, and Standard Reference Water Samples (SRWS)were
processed on site and submitted for analysis at the same time as field samples. In general, results for the blank
samples were below the detection limit of the methods used. Analytical method detection limits and precision
values are given by Fishman and Friedman (1985).
Analytical precision for Standard Reference Water Samples and duplicate samples was typically better than
10per cent (expressed as a per cent relative standard deviation). Recovery values for the SRWS were always
within two standard deviations of the most probable value.
As an additional check on analytical accuracy ionic balances were calculated for the major components
determined in each sample. Theseionic balances show a slight anion excess,that may result from the absence of
ammonium ion determinations. Ammonium ion was not determined, because the samples were not
appropriately preserved for this sample constituent.
RESULTS AND DISCUSSION
A summary of onsite results obtained during the summer and fall of 1984are shown in Table I;rainfall amount
data were not available for the Washington, D.C. site during the period covered here. Tabulated values include
the number of rainfall events for each stone type at each site, the range of rainfall amounts; the ranges of rain
and runoff pH, the calculated hydrogen ion loading, the calculated stone recession per rainfall event, and a
parameter related to sulphate formation on the stone surface. The data set used for this summary is given in
Reddy (1987).
Rainfall-runoff’measurement
Carbonate stone surface loss is calculated from the amount of calcium ion added to rainfall as it reacts and
flows from the surface of the stone. The concept of surface recession due to marble dissolution by acid rain, is
shown in Figure 3. In the case of rainfall-runoff from a marble surface,minimal porosity restricts acid reaction
with the carbonate mineral to the surface zone.
Acid deposition interaction with a porous carbonate stone differs from rainfall interaction with a marble
surface.Additional factors that may influenceacid reaction with a porous carbonate surface (Figure4)include:
ACID RAIN DAMAGE TO CARBONATE STONE 341
Table I. Summary of ranges for stonerainfall-runoff experiments for a selecteddata
set for three stone research sites: Newcomb, New York; Chester, New Jersey; and
Research Triangle Park, North Carolina during the summer and fall of 1984
RTP, NC Chester, NJ Newcomb, NY
Limestone experiment
Rain events
Rain (mm)
Incident pH
Runoff pH
H+ Load (meqm - 2,
CaCO, lost (pm)
Antecedent SO2
(PPb-daY)
Marble experiment
Rain events
Rain (mm)
Incident rain pH
Runoff pH
H + Load (meqm ~ ')
CaCO, lost (pm)
Antecedent SO2
(PPb' day1
13
5-55
4-4.5
7.4-9.1
0.2-2'3
0.02-0.6
&40
18
2-50
3.8-5.5
7.68.8
0.03-2'3
0.02-0.35
4-40
10
6-57
3.9-47
0.3-3.6
5.9-8. i
0.04-0.3
2 6 5 0
9
6-4 1
3.9-4.9
6'5-7.8
0.2-3.7
0.05-0.28
2 6 5 0
16
4-28
4.&4.7
7.7-8.6
0.1-1.7
0-04-0.I7
2-16
I5
4-28
4.0-4.6
7.1-8.3
0.2- 1.7
0.01-0.16
2-16
mm, millimetre; meq, milliequivalent; m2, metres square; pm, micrometre; ppb, parts per
billion of sulphur dioxide gas in air.
Marble a
Input rainfall
Surface
lowering
flow
Figure 3. A schematicillustration of surface recession from rain flowing over a low porosity marble surface (modified fromTrudgill, 1983)
C
?
,
- Limestone
Input rainfall
I , .1 1 ,
Sur.,,,
runoff I 1
I Chem
lowering
,
.
I Solution
Redistribution of
constituents
precipitation
Figure4. A schematic illustration of
4 Infiltration
surface recession from rain flowing over a porous limestone surface (modified from Trudgill, 1983)
342 M. M. REDDY
rain infiltration; dissolution and precipitation reactions within the stone; and leaching and subsequent
movement of solutes from the interior to the stone surface.
In addition to stone characteristics, the amount and intensity of rainfall will influence the runoff
characteristics from a porous limestone. Small rain amounts of light rain intensity falling on a dry porous stone
will cause little or no rainfall runoff. If none of the incident rain runs from the surface of the stone no calcium
ion is removed from the stone surface;no observable net dissolution of the stone surface has occurred. In the
caseofa porous limestone, in addition to loss of surface material through surface runoff, rain may infiltrate the
interior of the stone. This infiltrating solution subsequently may reprecipitate calcium carbonate within the
pore spaces, perhaps reducing the limestone porosity. Surface loss by other processes, such as granular
disaggregation may lead to additional stone surface damage.
Incident rainfall amount (expressedas depth,in millimetres)and the stone rainfall-runoff volume (expressed
in litres)are variables which are used to calculate acid rain loading and damage to stone (Reddy and Werner,
1985).A sample calculation and experimental details are given in the Appendix. The relationship between rain
amount and runoff volume (i.e. the microhydrology of the test stones) can be determined by direct
measurement. In addition, the geometric projection of the stone surfaces can be used to calculate an
intercepted volume of rain.
Samples collected at Research Triangle Park during 1984 (Figure 5)illustrate several features of the sample
microhydrology. Runoff volumes from each of the three sample types (i.e.limestone, marble,and a blank)have
been analysed using a statistical linear regression. In Figure 5 the calculated interception volume for stone is
referred to as ideal runoff from stone (calculated from the geometric rain interceptor area of the collector and
the rain amount).The blank collector (Figure 2B)has a smaller interception area because of the weepholesand
vent openings. The calculated blank interception volume is referred to as ideal blank runoff in Figure 5.
Regression analysis for each of the three test surfaces shows a high degree of correlation. Table I1
summarizesthe statistical parameters which describe the linear regression model for the three test surfaces (i.e.
limestone,marble, and blank). Each of the linear relations exhibitsa high correlation coefficient,supporting the
direct relation of rain amount and rainfall-runoff volume from the test surfaces. The slope and intercept values
among the test surfaces are consistent with the properties of each surface. The intercept obtained from the
regression analysis is related to the rainfall volume collected by the test surface allowing measurable runoff.
Regression analysis slope values of each data set in Figure 5 corresponds to the runoff produced per rainfall
amount when the surface is fullywet. For the marble and the blank surface the volume of rain needed to wet the
surface is approximately 25 ml. Limestone, because of its greater porosity, requires approximately 200 ml of
rain to wet the surface.
The slopes of the regression lines are consistent with the runoff surfaces (Figure 5). Marble has a slope
similar to that for ideal value calculated for that collection surface. This suggests that little rain infiltrates into
Table 11. Least-square regression relationship for blank, limestone, and marble
surface runoff from rainfall,in litres per event, as a function of rainfallamount,in
millimetres, at three stone-researchsites in the eastern United States. (A) Linear
least-square regression; (B) Log transformed data
A B Standard
(1 m1-l) (1) r error
A. Volume (1) = A* Rainfall (mm)+B
Combined Sites
Blank 0.066 0.0725 0.8966 0.3859
Limestone 0.084 0.010 0.7962 0.612
Marble 0.144 0120 0.9361 0447
B. Log [Volume (l)] = A* Log [Rainfall (mm)] +B
Blank 1.0025 -1.163 0.9564 03795
Limestone 1.5906 - 1.813 0.9190 0.3795
Marble 1.0532 -0.8722 0959 0.1772
ACID RAIN DAMAGE TO CARBONATE STONE
0
343
u-
.
c
0
C
a
a
l o E
0.1
Rainfall, mm
Limestone
m
A
NC
A NJ
/ r * NY
0.00 1
0.1 1 10 100
Rain, mm
a i
5
5 0.1
>
0
C
.
c
*
2 0.01
Marble
:
/
*
NC
A NJ
NY
0.00 1
0.1 1 10 100
Rain, mm
Figure Sa, b, c
344 M. M. REDDY
Blank
NY
0.001 1 I 1 I I IIII I I I I 1 1 1 1 1 1 I I IIIILI
0
.
1 1 10 100
Rain, mm
Figure5. Runoffvolume (in litres)versusrainfallamount (in millimetres)forsamplescollected at Research Triangle Park, North Carolina
during the summer and fall of 1984
the marble surface. Limestone regression lies well below that for marble indicating that the porous stone
apparently takes up additional water after that needed for surface wetting. The blank sample regression lies
well above the ideal value calculated for that collection surface. This suggests that rain may be more efficiently
collected than that anticipated based on the apparent interception area. Incident rain may flow or splash over
the weep holes giving a higher collection efficiency than that calculated from the geometric interception area.
For rainfall greater than 20 mm the rain amount needed to wet the limestone is only a fraction of the total
incident rainfall. Under these circumstances the runoff amount for limestone increases. Rainfall-runoff data
for the other sites studied are similar to rainfall-runoff data for Research Triangle Park.
Several approaches have been examined for comparing rainfall-runoff amount to rainfall. Linear least-
squares regressions of log-transformed rainfall amount to log-transformed runoff volume appear to give a
useful representation of the statistical relation between rainfall and runoff. A summary of the statistical
parameters for the log-transformed data for the combined data set is given in Table 11. Correlation coefficient
values shown in Table 11are higher for all three collection surfaces when log-transformed data is used in the
statistical evaluation. Plots of the log-transformed rainfall amount-runoff volume data (Figure 5) also
demonstrate that the log-transformed data exhibit a better linear relationship than the untransformed data.
As a test of the goodness-of-fit of the rain runoff-rain amount regressions, runoff amounts were calculated
and compared with observed values. For limestone and for marble there is scatter in the values of
actual-minus-calculated volume. Reasons for this scatter are not known at this time, but may arise because
rain collection efficiency is strongly dependent on local meteorological conditions and volume loss due to
evaporation.
During some onsite runoff measurements rainfall-rwnoff volume from one or both stones was unavailable
and was calculated from the log-transformed linear regression equation (Table I1 and Figure 5).
Factors influencing stone surface recession
Rainfall amount. Loss of carbonate stone under a fixed set of conditions, if there is not a kinetic limitation, is
regulated by mineral solubility, expressed in units of mass per volume of solution. If,at equilibrium, the volume
of aqueous solution reacting with a carbonate stone surface doubles then the carbonate stone loss would also
double. If the dissolution reaction approaches equilibrium then the stone loss would be directly proportional
to the amount of rain. Surface recession of carbonate stone is thus expected to be related to the amount of rain
falling on the stone surface. (A detailed discussion of the calculation of surface recession from measured rain
runoff composition has been presented by Reddy and Werner (1985)and is summarized in the Appendix.)
Surface recession, for both carbonate building stones (expressed as calcium carbonate recession in
ACID RAIN DAMAGE TO CARBONATE STONE 345
0.6
E
a
C
0
0,
0
.-
3 0.4
2
d
% 0.2
0
0.0
micrometres per rain event)is plotted asa function of rainfall (inmillimetres)in Figure 6.Thedata points show
a trend ofincreasing surface recession with increasing rain amount.Thesedata indicate that calciumcarbonate
loss from both stone types is directly proportional to rainfall amount.
Data shown in Figure 6 illustrate that there are not pronounced systematic differences between recession
data for limestone and marble. Calcium carbonate dissolved and removed from the stone surface appears to be
most influenced by the chemical nature of the surface. Both stone surfaces are composed of crystalline calcite
and itsdissolution causes the observedcalcium ion in the rainfall runoff from the stone (seefor example, Reddy
et al., 1985a and b).Physical differencesin the stone surfaces (i.e.stone porosity, grain size,and SO on)appear to
be of secondary importance in regulating the calcium ion removal from the stone surface.
Calcite dissolution kinetics (see for example Reddy et al., 1981)may limit removal of calcium ion from the
stone surface under some conditions. Calcite dis'solution and subsequent calcium ion removal from the stone
surfacemay reach a limitingvalue at high rainfall intensities. Thismay be thereason that there issomewhat less
calcium ion removal for high rainfall amounts (Figure 6).If this is the case,then the rate of calcitedissolution at
high rain amounts may become a transport controlled situation (Bermer, 1978). Additional planned rainfall-
runoff measurements as a function of differing rainfall intensities should resolve this question. Lowest
recession values are associated with low rainfall amounts on the limestone samples. These very low limestone
recession values may be due to the low runoff volume because of water uptake by limestone.
Incident rain p H . Since carbonate stone surface recession appears to be directly proportional to rainfall
amount (Figure6),the recession valuescan be normalized to the rainfall amount (that is expressing the surface
recession in micrometres of recession per millimetre of rain depth). This normalized surface recessionhas been
found to correlate with incident rain pH (Reddy and Werner, 1985). Thus, both rainfall amount and rain pH
appear to contribute in a significant way to loss of carbonate stone.
Air pollutants. The influence of air pollutants on carbonate building stone damage has been described by
Luckat (1977) and others. Typically such research has been conducted at locations with high pollutant
concentrations and identifiable stone damage. In contrast to the elevated sulphur dioxide concentrations at
European research sites sulphur dioxide concentrations at the NAAPA, Task Group G stone research sites
shown in Figure 1 (Table 111) are low.
Sulphur dioxideatmospheric concentrations and the presence of moisture on the stone surface between rain
events are important characteristics influencing the transfer of sulphur dioxide to the stone surface. Thus, a
record of sulphur dioxide air concentrations, the presence of stone surface moisture and the meteorological
parameters that influence gaseous and particulate deposition to the stone surface at each research site are
necessary to give a complete description of stone damage. In the stone damage study being conducted at the
Limestone, 39 cases a
- A Marble, 42 cases
-
i r
-
A
- a A
A
a a
- + a ' A
-
L * S y ' '
A a*+ A a A
* r 8
a
346 M. M. REDDY
four Task Group G research sites air pollution information is obtained simultaneously with damage
measurements. Onsite meteorology, climatology, and air pollution data are being quality assured and verified
and will be available for use in conjunction with stone damage in 1987.
Sinceatmospheric sulphur dioxide is a recognized source of carbonate stone damage, an attempt was made
to estimate sulphur dioxide influence on the carbonate stones exposed at the Task Group G sites. An index of
carbonate stone-sulphur dioxide exposure was incorporated into the analysis of surface recession. This index
is termed the antecedent sulphur dioxide exposure. It is calculated by multiplying the estimated site average
sulphur dioxide concentration (Table 111) by the number of days between precipitation events.
The rationale for use of a surrogate sulphur dioxide exposure variable is that sulphur dioxide transport to
the stone surface will be related to atmospheric sulphur dioxide concentration and the length of exposure.
Sulphur dioxide uptake by stone is a complex process mediated in large measure by stone surface moisture.
Speeding (1969),for example, has found that sulphur dioxide uptake by limestone was dependent on the
humidity. A better estimate of sulphur dioxideeffectoncarbonatestonedamage would includeaccurate6hour
or 1 hour concentrations as well as peak values and durations. This information coupled with stone surface
time-of-wetness information might allow future accurate calculation of sulphur dioxide flux to the stone
surface.
Hydrogen ion loading. Since carbonate stone surface recession depends on both rainfall amount and rain
hydrogen ion concentration, surface recession will be correlated strongly to the product of these two terms.
This product, hydrogen ion loading, is conveniently expressed in units of milliequivalents of hydrogen ion
deposited per square metre of stone surface.
In assessing acid rain effects, acid loading values often are used as independent variables in part because
many environmental data bases have been developed using hydrogen ion loading as an estimate of acid
deposition. Carbonatestone surface recession values,plotted as a function of hydrogen ion loading (Figure 7)
exhibit a direct relation that is similar to that for loss due to rain amount.This similarity arises because,in part,
rain ammnt is used in the calculation of hydrogen ion loading. Runoff amount, which is correlated to rainfall,
is used in the calculation of recession. Data points lie along a line having a positive slope; suggesting that
surface recession is directly proportional to hydrogen ion loading. Linear least-squares regressions were done
relating the surface recession to hydrogen ion loading (Table IV)and to hydrogen ion loading with antecedent
sulphur dioxide (Table V).
The hypothesis of a linear relation between carbonate stone surface recession and hydrogen ion loading was
evaluated using onsite data obtained during the summer and fall of 1984.In this statistical analysis, the known
chemical solubility behaviour of calcium carbonate in the presence of acids allows us to assign stone surface
recessionasa dependent variable and hydrogen ion load asan independent variable. Both variables are subject
to random error.
Coefficientsof correlation for the regression on hydrogen ion loading (Tables IV and V) exhibit a range of
Table 111. Average sulphurdioxide concentrationvalues
at each stone research site in the study area
Site
Average sulphur dioxide
concentration
(PPb)
1984* 1983t
Research Triangle Park, 4-0 2
Chester, New Jersey 7.0 7
Newcornb, New York 1.8 3
North Carolina
* Oral communication S.1. Sherwood, National Park Service,
Washington, D.C., 1985.
t Written communication, David Flinn, Bureau of Mines,
Avondale, Maryland, 1985.
ACID RAIN DAMAGE TO CARBONATE STONE 341
0.6
E
a
0
"
% 0.2
0
0.0
Limestone,
- 39 cases
- A Marble,
42 cases
-
A
- m~
1 -
0 1 2 3 4
Hydrogen ion loading, m e q h *
Figure 7. Stone surface recession (in micrometres per rain event) for limestone and marble versus hydrogen ion loading (in units of
milliequivalentsper square metre)at Newcomb, New York; Chester, New Jersey;and ResearchTriangle Park, North Carolina; during the
summer and fall of 1984
Table IV. Linear least-square regression relation for limestone and marble surface
recession, in micrometres per event, at three stone research sites in the eastern
United States
Y Research Triangle
(Pm) Newcomb, NY Chester, NJ Park NC
(A) Limestone
m (micrometres per mil- 0.038 0.046 0.23
liequivalent of hydrogen
ion per metre square)
n 16 11 13
r 0.36 0-54 0.81
b (Pm) 0.060 0.068 -0.033
P 0.1 < 0.1 < 0.001
m (micrometres per (pm) 0.051 0.042 0.12
(B) Marble
of hydrogen ion m2
b (Pm) 0.062 0.091 0.03
n 15 9 18
r 0.52 0.56 0-83
P < 0.05 0.1 < 0.001
y. dependent variable:calculated lim&tone or marble surface recession at each of three stone
research sites, in micrometres (pm);
m, slope of regression line, in micrometres per
milliequivalentof hydrogen ion per metre square (pm mq- of hydrogen m- '); b, intercept of
regression line with the y axisin micrometres (pm);
n,number of data pairs for each stone type
at each stone research site;r,coefficientof correlation; and p, probability that r will be equalled
or exceeded in n pairs of randomly selected data pairs.
significancevalues. Regression equations for both stone types at Research Triangle Park, North Carolina are
significant with a high degree of confidence. The regression equations are significantat a lower confidencelevel
for the New York and New Jersey sites. Coefficientsof regression for the two stone types at each of the three
research sites are similar.A detailed statistical analysis of the differencesbetween these coefficientsis limited by
the small number of cases. The regression coefficient for hydrogen ion appears to be higher at Research
348 M. M. REDDY
Table V. Multiple least-squares regression relations for limestone and marble
surface recession, in micrometres per event, at three stone research sites in the
eastern United States
Newcomb,
New York
Chester, Research Triangle Park
New Jersey North Carolina
A. Limestone
m ( p n m e q - '
of hydrogen ion m-')
1 (pmpg-'l-')
sulphur dioxide days
b (pm)
n
r
P
B. Marble
m (pnmeq-')
of hydrogen ion m-'
1 ( p n p g - ' - ' )
sulphur dioxide days
b (Pm)
n
r
P
0.046
- 0.003
0.076
0.45
16
> 0.1
0.002
0.051
15
0 5 5
> 0.05
0.045
0.001
0.025
0.56
1 1
> 0.1
0.039
0.003
-0.019
9
0.71
> 0.05
0.23
-0.01
-0.03
13
0.81
> 0~001
0.12
0.0
0.027
in
0.83
> 0.001
y, dependent variable,calculated limestone or marble surface recession at each of three stone
research sites; m, partial regression coemcient for hydrogen ion load, in micrometres per
milliequivalent of hydrogen ion per metre square (pmmeq ~ ' of hydrogen ion me'); I, partial
regression coefficient for antecedent sulphur dioxide, in micrometres per microgram per litre
sulphur dioxide days (pmpg- 'I - I); b, intercept of regression line with y axis in micrometres
(pn);m, number of data triplets for each stone type at each stone research site; r, multiple
correlation coefficient; and p, probability that r will be equalled or exceeded in n triplets of
randomly selected data triplets for unrelated variables.
Triangle Park than at the other two sites for reasons that remain unclear. In addition, the influence of dry
deposition on the measured surface recession may lead to dineerencesin the regression coefficientsamong the
sites.
Surface recession measurements for each stone type and site yielded data sets containing relatively small
numbers of cases: these data sets were combined to examine the complete data set more fully. Statistical
analysis included antecedent sulphur dioxide loading, as an independent variable, in addition to hydrogen ion
loading. A summary of these results of the statistical analyses is given in Table VI.
The statistical analysis of the combined data set, incorporating surface recession values for limestone,
marble, and for combined limestone and marble for all three sites,gave results similar to results for the smaller
data sets. The most statistically significant partial correlation coefficientreflects the influence of hydrogen ion
loading, as was the case in the analysis by research site and stone type. Other potential stone damage factors
associated with sulphur dioxide, site, and stone type are small and not significant. The hydrogen ion load
coefficientonly is affected slightly by incorporation of other terms in the regression. Statistical analysis of the
combined site and stone data supports strongly the relation between surface recession and hydrogen ion load
(Table VI). Multiple correlation coefficient values and the significancelevel for the linear relation improve as
the larger data set is used. Each of the combined site regressions is significant at the < 0.1 confidence level.
Regression coefficientschange slightly for the two independent variables, going from marble, to limestone, to
the marble-plus-limestone data set. Intercept values are uniform for the individual stones and the combined
data; moreover, intercept values are similar to the values obtained by regression of the individual site data.
Occasionally negative values are probably within the experimental error.
ACID RAIN DAMAGE TO CARBONATE STONE 349
Table V1. Multiple linear least-squaresregression relations for limestoneand
marble surface recession, in micrometres per event, using hydrogen ion
loading and antecedent sulphur dioxide as independent variables
Y
(Pm) Limestone Marble Combined
m (pmmeq-' 0.11 0.071 0.091
of hydrogen ion m
sulphur dioxide days
b (pm) 0.052 0051 0.053
n 39 42 81
r 0.60 070 0.61
-~
1 (pmpg-'l-l) -0.001 0.0004 - 00005
y, dependent variable,calculated limestone,marble, or combined limestoneand marble
surface recession at three stone research sites; m, partial regression coefficient for
hydrogen ion load (micrometres per milliequivalentof hydrogen ion per metre squared
( pm meq; of hydrogen ion m- '); 1, partial regression coefficient for antecedent
sulphur dioxide (pmpg- I I- '); b, intercept of regression line with y axis ( pm); n,
number of data triplets for eachstone type or for both stone typescombined; r, multiple
correlation coefficient;p. probability that r will be equalled or exceeded in n triplets of
randomly selected data triplets for unrelated variables.
Although the regression coefficients relating hydrogen ion loading to surface recession are significant, the
regression coefficients for antecedent sulphur dioxide are not. This result suggests that sulphur dioxide levels
may be too low at the stone research sites to yield a useful regression relation between surface recession and
sulphur dioxide exposure. Additional studies are being conducted to incorporate actual sulphur dioxide
concentrations and time-of-wetness information into the data analyses.
The95per cent confidence levelsfor the slopeand intercept coefficientsfor the least squaresanalysis of stone
surface recession as a function of hydrogen ion loading have been calculated using a procedure discussed in
Dunn (1964).This analysis suggeststhat the uncertainty in the least-squares coefficientsis somewhat greater for
the limestone data than for the marble data. For example, for limestone the slope and intercept coefficients
have uncertainties of 50 per cent and 150per cent, respectively. Marble error ranges are a factor two smaller
than those for limestone. A combined data set, using both limestone and marble data from all sites and
elimination of some outlying data pairs exhibits regression coefficient error ranges similar to those observed
for themarble dataset. It would seem that meteorological variables which influencethe moisturecontent of the
stone surface may be most important, in addition to hydrogen ion loading, in predicting stone damage.
Supportfor this assessment is that the limestone surface recession-hydrogen ion loading relationship, which is
more influenced by surface moisture than the marble relationship because of limestones greater porosity,
exhibits much higher uncertainty than the marble regression data.
The surrogate variable used to identify stone type, also was not significant in the regression equation, which
suggests that,with the current data,the two stcdaetypes respond in a similar fashion to hydrogen ion loading in
spite of great differences in permeability.
Differencesin the hydrogen ion loading term between sites may be significant. Elaboration of the reason for
these site differences must await additional experimental data for each site. At the present time, the combined
data set and the associated regression parameters appear to be the most useful quantitative expression that is
available, which relates environmental hydrogen ion loading (that is acid rain) to carbonate stone damage, but
more data are needed.
Application of surface recession relation to composite materials
The chemical reaction between aqueous hydrogen ion and solid calcium carbonate surfaces,quantified from
the onsite exposure data, also may apply to composite construction or geological materials that have calcium
carbonate as the bonding agent.Common examples of such materialsarelime mortar and carbonate-cemented
350 M. M. REDDY
sandstone. These materials often consist of unreactive mineral grains (e.g. quartz grains in the case of calcite-
cemented sandstone)held in place by a crystallinecalcium carbonate matrix. In mortar, carbonation proceeds
from the surface asa slowlymoving front.Thus, although mortar contains hydroxides,the portion exposed to
acid and sulphur dioxideattack can be regarded as being predominantly crystalline or microcrystalline calcium
carbonate.
In view of the unique structural role of calcium carbonate in these materials the experimental results for
limestoneand marble dissolution also may describe the lossof the calcium carbonate matrix. Quartz grains in a
lime mortar or sandstone may behave as an inert material that will be removed from the surface by granular
disaggregation as the carbonate bonding matrix is lost. If this hypothesis is correct, the mortar linear recession
rate would increase as the amount of quartz increases in the composite material.
SUMMARY AND CONCLUSIONS
A goal of this research programme is to develop reliable methods to identify and quantify environmental
damage to carbonate stone. The onsite experimental programme used in the investigation reported here
satisfiesthis goal. Rainfall runoff from the research stonesexhibitsmicrohydrologicalcharacteristicswhich are
compatible with measuring stone damage due to acid rain reacting with the carbonate stone surface.
Dissolution of the stone surface increases calcium concentration in the rainfall runoff. This increase in calcium
concentration can be converted into a surface loss of calcium carbonate or a uniform carbonate surface
recession. Stone surface recession was found to be directly proportional to rainfall amount. There were not
pronounced differences in surface recession exhibited between limestone and marble.
Identification and quantification of the influence of acid precipitation on carbonate stone damage is an
additional goal of this programme. Results presented here have shown that surface recession is directly
proportional to rainfall hydrogen ion loading to the stone surface. A preliminary estimate of the influence of
sulphur dioxide deposition on stone damage suggests that damage to the stone by sulphur dioxide is not
significant. Multivariant statistical analysis, using linear regression models, demonstrates that neither stone
type nor location are statistically related to stone surface recession.
The multivariant statistical linear regression model relating carbonate stone surface recession to hydrogen
ion loading may also have application to composite materials which have calcium carbonate as a binding
matrix.
ACKNOWLEDGEMENT
This work has been funded, in part by the National Park Service and the National Acid Precipitation
Assessment Program. Results and conclusion presented in this publication do not necessarilyreflect the views
of the National Park Service nor the National Acid Precipitation Assessment Program.
REFERENCES
Air-Borne Sulfur Pollution Report prepared within the framework-pf the Convention on Long-Range Transboundary Air Pollution,
Bermer, R. A. 1978. ‘Ratecontrol of mineral dissolution under earth surface conditions’, American Journal o
f Science, 278, 1235-1252.
Camuffo, D., Del Monte, M., Sabbioni, C.,and Vittori, 0.1982. ‘Wetting,deterioration and visual featuresof stone surfacesin an urban
Camuffo, D.,Del Monte, M.,and Sabbioni, C. 1983.‘Originand growth mechanismsof the sulfatedcrustson urban limestone’,Water,Air,
Camuffo, D., Del Monte, M., Ongaro, A. 1984. ‘The pH of the atmospheric precipitation in Venice, related to both the dynamics of
Cheng, R. J. and Castillo, R. 1984. ‘A study of marble deterioration at city hall, Schenectady, New York’, J . ofthe Air Pollution Control
Cheng, R. J., Hwu, J. R., Kim, J. T. and Leu, S-M. 1987. ‘Deterioration of marble structures’, Analytical Chemistry, 59(2), 104A-106A.
Del Monte, M.,Sabbioni,C.,and Vittori,0.1981. ‘Airbornecarbon particlesand marbledeterioration’,Atmos. Enuironment, 15,645-652.
Dunn, 0.J. 1964. Basic Statistics: A Primerfor the Biomedical Sciences, John Wiley and Sons, Inc., New York,184 pp.
Environmental Resources Limited, 1983. Acid rain, a reoiew of the phenomenon in the EEC and Europe, New York, Unipub for the
United Nations, New York, 1984.
area’, Atmospheric Environment, 16 (9),2253-2259.
und Soil Pollution, 351-359.
precipitation events and the weathering of monuments’, The Science o
f the Total Encironment, 40, 125-139.
ASSOC.,
34(1), 15-19.
Commission of European Communities, 159 pp.
ACID RAIN DAMAGE TO CARBONATE STONE 351
Fishman, M. J. and Friedman, L. C. (Eds) 1985.‘Method for determination of inorganic substances in water and fluvial sediments’,
Techniques of Water-Resources Investigations of the United States Geological Survey, Book 5, Chapter Al, Open-File Report, 85495,
709 pp.
Flinn, D. R., Cramer, C. D., Carter, J. P., Hurwitz, D. M. and Linstrom, P. J. 1986.‘Environmental effects on metalliccorrosion products
formed in short-term atmospheric exposures’,in Babioan, R. (Ed.),Materials Degradation Caused by Acid Rain,ACSSymposiumSeries,
No. 318, American Chemical Society, Washington, D. C., 119-151.
Haynie, F. H. 1983.‘Deterioration of marble’, Durability of Building Materials, 1(3), 241-254.
High, C. J. and Hanna, F. K. 1970. ‘A method for the direct measurement of erosion on rock surfaces: Norwich, Eng.’, British
Geomorphological Research Group, Technicul Bulletin, 5, 24 pp.
Husar, Rudolph B. 1986.‘Emissionsof sulfur dioxideand nitrogen oxidesand trends for eastern North America’,in Acid Deposition:Long-
Term Trends,Committee on Monitoring and Assessment of Trends in Acid Deposition National Research Council, National Academy
Press, Washington, D.C., 48-92.
Husar, R. B., Patterson, D. E., and Baer, N. S.1985.‘Deterioration of marble: a retrospective analysis of tombstone measurements’,US‘.
Environmental Protection Agency, Atmospheric Sciences Research Laboratory, Research Triangle Park, N.C.,DX 14930338-01-1,23pp.
Little, T. M. and Hills, F. J. 1978. Agricultural Experimentation: Design and Analysis, New York, John Wiley and Sons, 350 pp.
Luckat, Siegbert 1977.‘Stonedeterioration at the Cologne Cathedral and other monuments due to action of air pollutants’,in Proceedings
of the 4th International Clean Air Conference, Tokyo, Japan, 1977, 128-120.
Nordstrom, D. K. and others, 1979.‘A comparison of computerized chemicalmodels for equilibrium calculations in aqueous systems’,in
Jenne, E. A. (Ed.),Chemical Modeling in Aqueous Systems, Washington, D.C. American Chemical Society, Syniposium Series No. 93,
857-892.
Reddy, M. M. 1987.‘Acid-raindamage to carbonate stone: A preliminary quantitative assessment based on the aqueous geochemistryof
rainfall runoff’, U S . Geological Survey Water Resources Investigation, 87.
Reddy, M. M. in press.‘Acid-raindamage to carbonate stone:a preliminary quantitative assessment based on the aqueous geochemistryof
rainfall runoff ’
, U.S. Geological Survey Open-File Report.
Reddy, M. M., Plummer, L. N., and Busenberg, E. 1981.‘Crystal growth of calcite from calcium bicarbonate solutions at constant PCO,
and 25°C: a test of a calcite dissolution model’, Geochimica et Costnochimica Acta, 45(8), 1281-1289.
Reddy, M. M.,Sherwood, S. I.,and Doe, B. R. IY85a.‘Modelinglimestonedissolution by acid rain’,in Proceedings of the American Institute
of Architects, Los Angeles, California, March, 1985, 383-388.
Reddy, M. M., Sherwood, S. I., and Doe, B. R. 1985b. ‘Limestone and marble dissolution by acid rain’, in Proceedings of the 5th
International Congress on Deterioration and Conseruarion of Stone, Lausanne, Switzerland, September 1985, 517-526.
Reddy, M. M. and Werner, M. 1985. ‘Composition of rainfall-runoff from limestone and marble at Research Triangle Park, North
Carolina’, U S . Geological Survey Open-File Report, 85630, 6 pp.
Reuss, J. 0.and Johnson, D. W. 1986. Acid deposition and the acid$cation of soils and waters, Springer-Verlag, New York, 119pp.
Ross, M. 1985.‘Description,selection,and procurement of Shelbourne Marble samples used to study effectsof acid rain’, U.S.Geological
Survey Open-File Report, 85594, 15 pp.
Ross, M. and Knab, L. 1984. Selection, procurement, and description of Salem Limestone samples used to study effects of acid rain,
Gaithersburg, Md., National Bureau of Standards, NBSIR 84-29050, 17 pp.
Sharp,A. D., Trudgill, S.T.,Cooke, R. U., Price,C. A., Crabtree, R. W., Pickles,A. M.,and Smith, D. I. 1982.‘Weatheringof the balustrade
on St. Paul’s Cathedral, London’, Earth Surface Processes and Landforms, 7(4),387-389.
Sherwood, S. 1. and Doe, B. R. 1984. ‘Acid rain stone test sites’, EOS, Transactions 65 (50),1210pp.
Speeding, D. J. 1969. ‘Sulphur dioxide uptake by limestone’, Atmospheric Environment, 3, 683.
Stensland, G.J., Whelpdale, D. M.,and Oehlert, G. 1986.‘Aciddeposition: long-term trends committee on monitoring and assessmentof
Trudgill, S.T. 1983. Weathering and Erosion, Butterworths, Boston, 192 pp.
Trudgill, S. T., High,C.J.,and Hanna, K. K. 1981.‘Improvements to the micro-erosion meter (MEM)’,British Geomorphological Research
Winkler, Erhard M. 1987.‘Weathering and weathering rates of natural stones’,Enoironmental Geology and Water Science, 9(2),85-92.
trends’, in Acid Deposition National Research Council, National Academy Press, Washington, D.C., 128-199.
Group, Technical Bulletin, 29, 3-17.
APPENDIX. EXPERIMENTAL PROCEDURE
Site characteristics
Each monitoring site has four racks placed CBB three plywood boxes or bases. Sample bottles, supplies, and
other equipment are located inside the bases. Each rack has two, 12by 24inch slotsfor glasssheets,stone slabs,
or blanks providing a maximum of eight slots per site. Four slots are available for precipitation-runoff sample
collection, and four slots are used for measurements replication when appropriate. Racks are number 1
through 4. Slots used for collecting samples are numbered A1 through A4; the other slots are numbered B1
through B4. Racks are side by side, in sequential order. Slots may be arranged in any workable order. Each set
of racks, A and B, contains at least one glass sheet, one limestone slab, one marble slab, and one blank slot.
Pexiglass splash guards are placed between the slots to avoid contamination between slots.
Site maintenance
Visualinspection of the racks is made immediately after arrival at the site. If maintenance is required, it needs
to be doneafter the water sampleis removed and before the replacement bottle is installed. Debris deposited by
352 M. M. REDDY
natural causes on a rack is left as is. Other debris (for example, leavesjamming the drain outlet of the rack) is
gently removed and such removal is noted on the Inspection Log.
Sample collection
procedure is as follows:
1. Check apparatus for normal operation.
2. If a collection bottle contains any water, remove, cap,and label the bottle with a unique sample number and
the date and time of removal.
3. Perform and make a note of maintenance.
4. Replace original collection bottle with a clean, pre-labelled collection bottle. (Collection bottles need to be
rinsed well with distilled water three times and air dried.)
5. Check the in-line, fibre-glass filter and replace the filter if debris has accumulated.
6. Insert the sample-collection line into the replaced collection bottle.
Sample processing
Samples are to be processed immediately after collection, preferably indoors under controlled conditions,
using reliable equipment. All glassware is to be scrupulously clean. If possible, perform all measurements at a
room temperature of 25" (degree Celsius).
Cleaning glassware. Collection bottles and glassware (bothnew and used)need to be rinsed three times with
distilled water, then rinsed with dilute nitric acid,then rinsed three times with distilled water, and then allowed
to air dry. Dilute nitric acid is prepared by mixing 1 part of acid with 20 parts of water.
The procedure for sample collection is designed for the collection of a sample after every storm. The
Filtration procedure.
1. Wear rubber gloves. Do not touch the inside of the filtration equipment.
2. Use of 0.45 pm sealed filterattached to 50 ml syringe to provide pressure. Use of a pump filtration assembly
with 50 mm diameter, 0.45 pm filter is an acceptable alternative to the filtration syringe.
3. Rinse the filter by passing 25 ml of distilled water through filter, followed by 10ml of sample. Discard this
filtrate.
4. Rinse a clean shipping bottle with 25 ml of distilled water. Filter one half (asmuch as 250 ml)of the sample
through the filter and into the shipping bottle. If the filter clogscompletely before 250 ml have been filtered,
rinse the syringe and use a new rinsed filter.
5. Cap and label the shipping bottle; specify 'FILTERED.
6. Discard filters. The syringe can be reused if it is still operating well. Use separate syringes and filters for
filtering the limestone, marble, and blank samples, or rinse well with distilled water between samples.
Volume Measurement and Processing Options.
1. Pour sample into a clean graduated cylinder with a volume of 1OOOml (millilitres); record volume to
nearest 10ml.
2. If volume is less than 200 ml:
(a) Measure pH and specific conductance of unjiltered sample.
(b) Pour any remaining sample, without Jiltering,into a clean shipping bottle with a volume of 250 ml.
3. If the volume is more than 200 ml:
(a) Measure pH and specific conductance of unfiltered sample.
(b) Filter one half of remaining sample into a clean shipping bottle with a volume of 250 ml.
(c) Pour remaining one half of sample, withoutfilrering,into anotherclean shipping bottle with a volume of
250 ml.
pH measurements. About 20 ml of sampleare needed for these measurements. General procedures applying
@ #
to all measurements during calibration of the instrument and measuring of the sample pH are:
ACID RAIN DAMAGE TO CARBONATE STONE 353
1. Before first measurement and between measurements, rinse the glass pH electrode three times with distilled
2. Carefully adjust the temperature compensation for every measurement.
3. Allow all measurements to stabilize before recording them; this may take as much as 15 minutes for dilute
water, then rinse with the next solution to be measured.
solutions.
Before sample pH is measured, the instrument is to be calibrated as follows:
1. Measure pH of distilled water and standard dilute acid.
2. Calibrate the zero adjustment using the pH 7.00 buffer.
3. Adjust the slope control using the pH 4.00 buffer.
4. Repeat steps 2 and 3 until measurements for each buffer are within 0.01 pH unit of known value.
5. Measure the pH of distilled water and standard dilute acid as checks of instrument calibration record sheet.
Measure sample pH as follows:
1. If sample volume is less than 200 ml, make 1 measurement.
2. If sample volume is more than 200 ml, make 2 measurements.
3. Record measurements on Attachment 11.
4. After all samples are measured, or after every 10 samples are measured, check for calibration drift by
measuring pH 7.00 and 4.00 buffers. If calibration has drifted more than 005 pH units, recalibrate the pH
meter.
Specijic Conductance Measurements. About 20 ml of sample are needed for these measurements. General
procedures applying to all measurements during calibration of the instrument and measuring of sample
specific conductance are:
1. Between measurements, rinse the measuring cell three times with distilled water, then rinse with the next
2. If possible, adjust the meter, to the appropriate cell constant. Also temperatures, and the cell constant.
3. Allow readings to stabilize. Record all specific conductances, temperatures, and the cell constant.
4. Measure the specific conductance of low and high standard solutions and of distilled water.
5. If your meter does not have adjustments for temperature or cell constant, you may use the following
solution to be measured.
formulae to compute the specific conductance of your standard solutions at 25°C:
CmK
c2=
1+0.02 (T- 25)
where C, = actual specific conductance (ps/cm); C, = measured specific conductance (ps/cm); K = cell
constant; and T = temperature ("C)
6. Measure specific conductance of distilled water and standard dilute acid solutions and KCl solutions as
checks.
7. Measure specific conductance of sample and repeat if sample volume exceeds 200 ml.
8. After all samples are processed, measure sR+fic conductance of distilled water and standard solutions.
Quality Control. To determine if any loss or contamination is occurring in the sample processing, a filtered
standard reference sample and filtered distilled water blank sample are to be submitted each month. These
samples are prepared exactly as the precipitation sample.
As a check on analytical variation, the operator is to submit a set of duplicate samples each month for the
first storm that has volume larger than 1,000ml. Duplicate samples are to be processed in the same manner as
all other precipitation samples. A filtered and unfiltered sample are to be provided for each duplicate sample.
Calculation of surface recession for limestone and marble
Analytical results for calcium and sulphate ions are for the net change in rainfall composition after the
rainfall flows over the surface of the exposed stone. The net concentration, assumed to result from the
interaction of rain with the stone surface, is calculated by subtracting the blank sampleconcentration from the
354 M. M. REDDY
concentration measured for the stone runoff. Granulardisintegration of the test stones,a process which may be
important in determining the total erosion rate, is not evaluated in these measurements. Sulphate ion net
concentration has been calculated to identify the presence of soluble mineralscontaining sulphate on the stone
surface. Surface recession is calculated from the measured solution concentrations, rainfall runoff volume,
stone density, and stone surface area by multiplication by the appropriate conversion factors. A sample
calculation is given in Table AI.
Table AI. Sample calculation for determining calcium carbonate reference stone surface recession from measured data
Net calcium ion concentration in stone runoff:
Measured calcium ion concentration in runoff = 12.08 milligrams per litre. Measured calcium ion concentration of
blank = 0.53 milligrams per litre. Calcium ion concentration from reference stone dissolution (12.08-0.53) = 11.55
milligrams per litre.
Total weight o
f calcium lost from stone surface:
(Net calcium concentration in runoff) x (runoff volume) = milligrams calcium.
1155 milligrams per litre x 1.91 litres = 22.11 milligrams calcium.
22.1 milligrams calcium x 2.50 ~ = 55.2 milligrams calcium carbonate.
55.2 milligrams calcium carbonate x (0001)= 0.055 gram calcium carbonate.
Volume of calcium carbonate lost from stone surface:
0.055 gram calcium carbonate + 2.7 grams per cubic centimetre = 0.02 cubic centimetre calcium carbonate.
Surface recession of reference stone:
0.02 cubic centimetre calcium carbonate t 1858 square centimetres = 1.1 x lo-’ centimetre.
0.11 x
CaCO,
Ca
= 0.11 micrometre of calcium carbonate lost.

More Related Content

Similar to Acid rain damage to carbonate stone A quantitative assessment based on the aqueous geochemistry of rainfall runoff from stone.pdf

ACID RAIN, THEIR IMPACTS AND BIOTECHNOLOGICAL APPROACHES FOR MANAGEMENT
ACID RAIN, THEIR IMPACTS AND BIOTECHNOLOGICAL APPROACHES FOR MANAGEMENTACID RAIN, THEIR IMPACTS AND BIOTECHNOLOGICAL APPROACHES FOR MANAGEMENT
ACID RAIN, THEIR IMPACTS AND BIOTECHNOLOGICAL APPROACHES FOR MANAGEMENTAmbika Prajapati
 
Final paper
Final paperFinal paper
Final paperBui Dung
 
Distribution and mobility of lead and zinc atmospheric depositions in industr...
Distribution and mobility of lead and zinc atmospheric depositions in industr...Distribution and mobility of lead and zinc atmospheric depositions in industr...
Distribution and mobility of lead and zinc atmospheric depositions in industr...INFOGAIN PUBLICATION
 
remediation and bioremediation of U
remediation and bioremediation of Uremediation and bioremediation of U
remediation and bioremediation of UMamdouh Abdel-Sabour
 
Acid Rain Effects Research A Status Report
Acid Rain Effects Research A Status ReportAcid Rain Effects Research A Status Report
Acid Rain Effects Research A Status ReportNat Rice
 
Groundwater methane in relation to oil and gas development and shallow coal s...
Groundwater methane in relation to oil and gas development and shallow coal s...Groundwater methane in relation to oil and gas development and shallow coal s...
Groundwater methane in relation to oil and gas development and shallow coal s...Marcellus Drilling News
 
Burton et al Geospatial Contam w Drilling Params
Burton et al Geospatial Contam w Drilling ParamsBurton et al Geospatial Contam w Drilling Params
Burton et al Geospatial Contam w Drilling ParamsZacariah Hildenbrand Ph.D.
 
Zn distribution in soils amended with different kinds of sewage sludge
Zn distribution in soils amended with different kinds of sewage sludgeZn distribution in soils amended with different kinds of sewage sludge
Zn distribution in soils amended with different kinds of sewage sludgeSilvana Torri
 
Acid Rain Powerpoint presentation
Acid Rain Powerpoint presentationAcid Rain Powerpoint presentation
Acid Rain Powerpoint presentationguest6d3ed48
 
The International Journal of Engineering and Science (The IJES)
The International Journal of Engineering and Science (The IJES)The International Journal of Engineering and Science (The IJES)
The International Journal of Engineering and Science (The IJES)theijes
 
HHMI April 2015 Poster
HHMI April 2015 PosterHHMI April 2015 Poster
HHMI April 2015 PosterConnor Daniel
 
Takawira, Gwenzi & Nyamugafata 2014 geoderma hydrocarbons (1)
Takawira, Gwenzi & Nyamugafata 2014 geoderma hydrocarbons (1)Takawira, Gwenzi & Nyamugafata 2014 geoderma hydrocarbons (1)
Takawira, Gwenzi & Nyamugafata 2014 geoderma hydrocarbons (1)ammishaddai takawira
 
Spatial distribution and environmental geochemistry of zinc metal in water an...
Spatial distribution and environmental geochemistry of zinc metal in water an...Spatial distribution and environmental geochemistry of zinc metal in water an...
Spatial distribution and environmental geochemistry of zinc metal in water an...Javier Quesada Duque
 
Hydrochemistry and groundwater quality assessment of dantewada district, chha...
Hydrochemistry and groundwater quality assessment of dantewada district, chha...Hydrochemistry and groundwater quality assessment of dantewada district, chha...
Hydrochemistry and groundwater quality assessment of dantewada district, chha...Alexander Decker
 
Tales of volcanoes-ENSO-PNAS-2013-Shaheen-1213149110-with cover
Tales of volcanoes-ENSO-PNAS-2013-Shaheen-1213149110-with coverTales of volcanoes-ENSO-PNAS-2013-Shaheen-1213149110-with cover
Tales of volcanoes-ENSO-PNAS-2013-Shaheen-1213149110-with coverRobina Shaheen
 
CunninghamFinal Term Paper .docx
CunninghamFinal Term Paper .docxCunninghamFinal Term Paper .docx
CunninghamFinal Term Paper .docxEd Cunningham
 

Similar to Acid rain damage to carbonate stone A quantitative assessment based on the aqueous geochemistry of rainfall runoff from stone.pdf (20)

ACID RAIN, THEIR IMPACTS AND BIOTECHNOLOGICAL APPROACHES FOR MANAGEMENT
ACID RAIN, THEIR IMPACTS AND BIOTECHNOLOGICAL APPROACHES FOR MANAGEMENTACID RAIN, THEIR IMPACTS AND BIOTECHNOLOGICAL APPROACHES FOR MANAGEMENT
ACID RAIN, THEIR IMPACTS AND BIOTECHNOLOGICAL APPROACHES FOR MANAGEMENT
 
Final paper
Final paperFinal paper
Final paper
 
Distribution and mobility of lead and zinc atmospheric depositions in industr...
Distribution and mobility of lead and zinc atmospheric depositions in industr...Distribution and mobility of lead and zinc atmospheric depositions in industr...
Distribution and mobility of lead and zinc atmospheric depositions in industr...
 
remediation and bioremediation of U
remediation and bioremediation of Uremediation and bioremediation of U
remediation and bioremediation of U
 
D0411315
D0411315D0411315
D0411315
 
Acid Rain Effects Research A Status Report
Acid Rain Effects Research A Status ReportAcid Rain Effects Research A Status Report
Acid Rain Effects Research A Status Report
 
Groundwater methane in relation to oil and gas development and shallow coal s...
Groundwater methane in relation to oil and gas development and shallow coal s...Groundwater methane in relation to oil and gas development and shallow coal s...
Groundwater methane in relation to oil and gas development and shallow coal s...
 
Burton et al Geospatial Contam w Drilling Params
Burton et al Geospatial Contam w Drilling ParamsBurton et al Geospatial Contam w Drilling Params
Burton et al Geospatial Contam w Drilling Params
 
Zn distribution in soils amended with different kinds of sewage sludge
Zn distribution in soils amended with different kinds of sewage sludgeZn distribution in soils amended with different kinds of sewage sludge
Zn distribution in soils amended with different kinds of sewage sludge
 
Healy 2012.pdf
Healy 2012.pdfHealy 2012.pdf
Healy 2012.pdf
 
Acid Mine Drainage In Pennsylvania Streams
Acid Mine Drainage In Pennsylvania StreamsAcid Mine Drainage In Pennsylvania Streams
Acid Mine Drainage In Pennsylvania Streams
 
Acid Rain Powerpoint presentation
Acid Rain Powerpoint presentationAcid Rain Powerpoint presentation
Acid Rain Powerpoint presentation
 
The International Journal of Engineering and Science (The IJES)
The International Journal of Engineering and Science (The IJES)The International Journal of Engineering and Science (The IJES)
The International Journal of Engineering and Science (The IJES)
 
HHMI April 2015 Poster
HHMI April 2015 PosterHHMI April 2015 Poster
HHMI April 2015 Poster
 
Takawira, Gwenzi & Nyamugafata 2014 geoderma hydrocarbons (1)
Takawira, Gwenzi & Nyamugafata 2014 geoderma hydrocarbons (1)Takawira, Gwenzi & Nyamugafata 2014 geoderma hydrocarbons (1)
Takawira, Gwenzi & Nyamugafata 2014 geoderma hydrocarbons (1)
 
Spatial distribution and environmental geochemistry of zinc metal in water an...
Spatial distribution and environmental geochemistry of zinc metal in water an...Spatial distribution and environmental geochemistry of zinc metal in water an...
Spatial distribution and environmental geochemistry of zinc metal in water an...
 
Hydrochemistry and groundwater quality assessment of dantewada district, chha...
Hydrochemistry and groundwater quality assessment of dantewada district, chha...Hydrochemistry and groundwater quality assessment of dantewada district, chha...
Hydrochemistry and groundwater quality assessment of dantewada district, chha...
 
Tales of volcanoes-ENSO-PNAS-2013-Shaheen-1213149110-with cover
Tales of volcanoes-ENSO-PNAS-2013-Shaheen-1213149110-with coverTales of volcanoes-ENSO-PNAS-2013-Shaheen-1213149110-with cover
Tales of volcanoes-ENSO-PNAS-2013-Shaheen-1213149110-with cover
 
2019-09-19 - Richard Greene - The effect of dust borne salt and sodium on lan...
2019-09-19 - Richard Greene - The effect of dust borne salt and sodium on lan...2019-09-19 - Richard Greene - The effect of dust borne salt and sodium on lan...
2019-09-19 - Richard Greene - The effect of dust borne salt and sodium on lan...
 
CunninghamFinal Term Paper .docx
CunninghamFinal Term Paper .docxCunninghamFinal Term Paper .docx
CunninghamFinal Term Paper .docx
 

More from Jessica Navarro

Example Discussion Essay
Example Discussion EssayExample Discussion Essay
Example Discussion EssayJessica Navarro
 
Example Essay Argumentative
Example Essay ArgumentativeExample Essay Argumentative
Example Essay ArgumentativeJessica Navarro
 
Argumentative Essay Prompts
Argumentative Essay PromptsArgumentative Essay Prompts
Argumentative Essay PromptsJessica Navarro
 
Essay Websites How To Start A College Admission Essay 12
Essay Websites How To Start A College Admission Essay 12Essay Websites How To Start A College Admission Essay 12
Essay Websites How To Start A College Admission Essay 12Jessica Navarro
 
Printable Pig Stationery PaperCute PigWriting Pape
Printable Pig Stationery PaperCute PigWriting PapePrintable Pig Stationery PaperCute PigWriting Pape
Printable Pig Stationery PaperCute PigWriting PapeJessica Navarro
 
Website That Writes Essays For You Love You - There Is A Website That
Website That Writes Essays For You Love You - There Is A Website ThatWebsite That Writes Essays For You Love You - There Is A Website That
Website That Writes Essays For You Love You - There Is A Website ThatJessica Navarro
 
Critical Analysis Of An Article - Critical Analysis Essay -
Critical Analysis Of An Article - Critical Analysis Essay -Critical Analysis Of An Article - Critical Analysis Essay -
Critical Analysis Of An Article - Critical Analysis Essay -Jessica Navarro
 
How To Write An Effective Narrative Essay
How To Write An Effective Narrative EssayHow To Write An Effective Narrative Essay
How To Write An Effective Narrative EssayJessica Navarro
 
Use Custom Essay Writing Services And Know The Di
Use Custom Essay Writing Services And Know The DiUse Custom Essay Writing Services And Know The Di
Use Custom Essay Writing Services And Know The DiJessica Navarro
 
IB Extended Essay Topics For The Highest Grades
IB Extended Essay Topics For The Highest GradesIB Extended Essay Topics For The Highest Grades
IB Extended Essay Topics For The Highest GradesJessica Navarro
 
Home - Research - LibGuides At Uni
Home - Research - LibGuides At UniHome - Research - LibGuides At Uni
Home - Research - LibGuides At UniJessica Navarro
 
10 Tips For Writing Effective Essay LiveWebTutors
10 Tips For Writing Effective Essay LiveWebTutors10 Tips For Writing Effective Essay LiveWebTutors
10 Tips For Writing Effective Essay LiveWebTutorsJessica Navarro
 
Printable Sentence Strips - Printable Word Searches
Printable Sentence Strips - Printable Word SearchesPrintable Sentence Strips - Printable Word Searches
Printable Sentence Strips - Printable Word SearchesJessica Navarro
 
Website That Does Essays For You
Website That Does Essays For YouWebsite That Does Essays For You
Website That Does Essays For YouJessica Navarro
 

More from Jessica Navarro (20)

Essay About Ecotourism
Essay About EcotourismEssay About Ecotourism
Essay About Ecotourism
 
Example Discussion Essay
Example Discussion EssayExample Discussion Essay
Example Discussion Essay
 
Bonnie And Clyde Essay
Bonnie And Clyde EssayBonnie And Clyde Essay
Bonnie And Clyde Essay
 
Example Essay Argumentative
Example Essay ArgumentativeExample Essay Argumentative
Example Essay Argumentative
 
Racism Today Essay
Racism Today EssayRacism Today Essay
Racism Today Essay
 
Argumentative Essay Prompts
Argumentative Essay PromptsArgumentative Essay Prompts
Argumentative Essay Prompts
 
Writing Border
Writing BorderWriting Border
Writing Border
 
Essay Websites How To Start A College Admission Essay 12
Essay Websites How To Start A College Admission Essay 12Essay Websites How To Start A College Admission Essay 12
Essay Websites How To Start A College Admission Essay 12
 
Printable Pig Stationery PaperCute PigWriting Pape
Printable Pig Stationery PaperCute PigWriting PapePrintable Pig Stationery PaperCute PigWriting Pape
Printable Pig Stationery PaperCute PigWriting Pape
 
Terrorism Essay. Long A
Terrorism Essay. Long ATerrorism Essay. Long A
Terrorism Essay. Long A
 
Website That Writes Essays For You Love You - There Is A Website That
Website That Writes Essays For You Love You - There Is A Website ThatWebsite That Writes Essays For You Love You - There Is A Website That
Website That Writes Essays For You Love You - There Is A Website That
 
Pin On For The Boys
Pin On For The BoysPin On For The Boys
Pin On For The Boys
 
Critical Analysis Of An Article - Critical Analysis Essay -
Critical Analysis Of An Article - Critical Analysis Essay -Critical Analysis Of An Article - Critical Analysis Essay -
Critical Analysis Of An Article - Critical Analysis Essay -
 
How To Write An Effective Narrative Essay
How To Write An Effective Narrative EssayHow To Write An Effective Narrative Essay
How To Write An Effective Narrative Essay
 
Use Custom Essay Writing Services And Know The Di
Use Custom Essay Writing Services And Know The DiUse Custom Essay Writing Services And Know The Di
Use Custom Essay Writing Services And Know The Di
 
IB Extended Essay Topics For The Highest Grades
IB Extended Essay Topics For The Highest GradesIB Extended Essay Topics For The Highest Grades
IB Extended Essay Topics For The Highest Grades
 
Home - Research - LibGuides At Uni
Home - Research - LibGuides At UniHome - Research - LibGuides At Uni
Home - Research - LibGuides At Uni
 
10 Tips For Writing Effective Essay LiveWebTutors
10 Tips For Writing Effective Essay LiveWebTutors10 Tips For Writing Effective Essay LiveWebTutors
10 Tips For Writing Effective Essay LiveWebTutors
 
Printable Sentence Strips - Printable Word Searches
Printable Sentence Strips - Printable Word SearchesPrintable Sentence Strips - Printable Word Searches
Printable Sentence Strips - Printable Word Searches
 
Website That Does Essays For You
Website That Does Essays For YouWebsite That Does Essays For You
Website That Does Essays For You
 

Recently uploaded

Presentation by Andreas Schleicher Tackling the School Absenteeism Crisis 30 ...
Presentation by Andreas Schleicher Tackling the School Absenteeism Crisis 30 ...Presentation by Andreas Schleicher Tackling the School Absenteeism Crisis 30 ...
Presentation by Andreas Schleicher Tackling the School Absenteeism Crisis 30 ...EduSkills OECD
 
URLs and Routing in the Odoo 17 Website App
URLs and Routing in the Odoo 17 Website AppURLs and Routing in the Odoo 17 Website App
URLs and Routing in the Odoo 17 Website AppCeline George
 
Student login on Anyboli platform.helpin
Student login on Anyboli platform.helpinStudent login on Anyboli platform.helpin
Student login on Anyboli platform.helpinRaunakKeshri1
 
Measures of Central Tendency: Mean, Median and Mode
Measures of Central Tendency: Mean, Median and ModeMeasures of Central Tendency: Mean, Median and Mode
Measures of Central Tendency: Mean, Median and ModeThiyagu K
 
How to Make a Pirate ship Primary Education.pptx
How to Make a Pirate ship Primary Education.pptxHow to Make a Pirate ship Primary Education.pptx
How to Make a Pirate ship Primary Education.pptxmanuelaromero2013
 
POINT- BIOCHEMISTRY SEM 2 ENZYMES UNIT 5.pptx
POINT- BIOCHEMISTRY SEM 2 ENZYMES UNIT 5.pptxPOINT- BIOCHEMISTRY SEM 2 ENZYMES UNIT 5.pptx
POINT- BIOCHEMISTRY SEM 2 ENZYMES UNIT 5.pptxSayali Powar
 
Contemporary philippine arts from the regions_PPT_Module_12 [Autosaved] (1).pptx
Contemporary philippine arts from the regions_PPT_Module_12 [Autosaved] (1).pptxContemporary philippine arts from the regions_PPT_Module_12 [Autosaved] (1).pptx
Contemporary philippine arts from the regions_PPT_Module_12 [Autosaved] (1).pptxRoyAbrique
 
Organic Name Reactions for the students and aspirants of Chemistry12th.pptx
Organic Name Reactions  for the students and aspirants of Chemistry12th.pptxOrganic Name Reactions  for the students and aspirants of Chemistry12th.pptx
Organic Name Reactions for the students and aspirants of Chemistry12th.pptxVS Mahajan Coaching Centre
 
Hybridoma Technology ( Production , Purification , and Application )
Hybridoma Technology  ( Production , Purification , and Application  ) Hybridoma Technology  ( Production , Purification , and Application  )
Hybridoma Technology ( Production , Purification , and Application ) Sakshi Ghasle
 
1029-Danh muc Sach Giao Khoa khoi 6.pdf
1029-Danh muc Sach Giao Khoa khoi  6.pdf1029-Danh muc Sach Giao Khoa khoi  6.pdf
1029-Danh muc Sach Giao Khoa khoi 6.pdfQucHHunhnh
 
Paris 2024 Olympic Geographies - an activity
Paris 2024 Olympic Geographies - an activityParis 2024 Olympic Geographies - an activity
Paris 2024 Olympic Geographies - an activityGeoBlogs
 
Beyond the EU: DORA and NIS 2 Directive's Global Impact
Beyond the EU: DORA and NIS 2 Directive's Global ImpactBeyond the EU: DORA and NIS 2 Directive's Global Impact
Beyond the EU: DORA and NIS 2 Directive's Global ImpactPECB
 
microwave assisted reaction. General introduction
microwave assisted reaction. General introductionmicrowave assisted reaction. General introduction
microwave assisted reaction. General introductionMaksud Ahmed
 
Arihant handbook biology for class 11 .pdf
Arihant handbook biology for class 11 .pdfArihant handbook biology for class 11 .pdf
Arihant handbook biology for class 11 .pdfchloefrazer622
 
Web & Social Media Analytics Previous Year Question Paper.pdf
Web & Social Media Analytics Previous Year Question Paper.pdfWeb & Social Media Analytics Previous Year Question Paper.pdf
Web & Social Media Analytics Previous Year Question Paper.pdfJayanti Pande
 
The basics of sentences session 2pptx copy.pptx
The basics of sentences session 2pptx copy.pptxThe basics of sentences session 2pptx copy.pptx
The basics of sentences session 2pptx copy.pptxheathfieldcps1
 

Recently uploaded (20)

Presentation by Andreas Schleicher Tackling the School Absenteeism Crisis 30 ...
Presentation by Andreas Schleicher Tackling the School Absenteeism Crisis 30 ...Presentation by Andreas Schleicher Tackling the School Absenteeism Crisis 30 ...
Presentation by Andreas Schleicher Tackling the School Absenteeism Crisis 30 ...
 
URLs and Routing in the Odoo 17 Website App
URLs and Routing in the Odoo 17 Website AppURLs and Routing in the Odoo 17 Website App
URLs and Routing in the Odoo 17 Website App
 
Student login on Anyboli platform.helpin
Student login on Anyboli platform.helpinStudent login on Anyboli platform.helpin
Student login on Anyboli platform.helpin
 
Measures of Central Tendency: Mean, Median and Mode
Measures of Central Tendency: Mean, Median and ModeMeasures of Central Tendency: Mean, Median and Mode
Measures of Central Tendency: Mean, Median and Mode
 
Código Creativo y Arte de Software | Unidad 1
Código Creativo y Arte de Software | Unidad 1Código Creativo y Arte de Software | Unidad 1
Código Creativo y Arte de Software | Unidad 1
 
How to Make a Pirate ship Primary Education.pptx
How to Make a Pirate ship Primary Education.pptxHow to Make a Pirate ship Primary Education.pptx
How to Make a Pirate ship Primary Education.pptx
 
POINT- BIOCHEMISTRY SEM 2 ENZYMES UNIT 5.pptx
POINT- BIOCHEMISTRY SEM 2 ENZYMES UNIT 5.pptxPOINT- BIOCHEMISTRY SEM 2 ENZYMES UNIT 5.pptx
POINT- BIOCHEMISTRY SEM 2 ENZYMES UNIT 5.pptx
 
Contemporary philippine arts from the regions_PPT_Module_12 [Autosaved] (1).pptx
Contemporary philippine arts from the regions_PPT_Module_12 [Autosaved] (1).pptxContemporary philippine arts from the regions_PPT_Module_12 [Autosaved] (1).pptx
Contemporary philippine arts from the regions_PPT_Module_12 [Autosaved] (1).pptx
 
Organic Name Reactions for the students and aspirants of Chemistry12th.pptx
Organic Name Reactions  for the students and aspirants of Chemistry12th.pptxOrganic Name Reactions  for the students and aspirants of Chemistry12th.pptx
Organic Name Reactions for the students and aspirants of Chemistry12th.pptx
 
Hybridoma Technology ( Production , Purification , and Application )
Hybridoma Technology  ( Production , Purification , and Application  ) Hybridoma Technology  ( Production , Purification , and Application  )
Hybridoma Technology ( Production , Purification , and Application )
 
1029-Danh muc Sach Giao Khoa khoi 6.pdf
1029-Danh muc Sach Giao Khoa khoi  6.pdf1029-Danh muc Sach Giao Khoa khoi  6.pdf
1029-Danh muc Sach Giao Khoa khoi 6.pdf
 
Paris 2024 Olympic Geographies - an activity
Paris 2024 Olympic Geographies - an activityParis 2024 Olympic Geographies - an activity
Paris 2024 Olympic Geographies - an activity
 
TataKelola dan KamSiber Kecerdasan Buatan v022.pdf
TataKelola dan KamSiber Kecerdasan Buatan v022.pdfTataKelola dan KamSiber Kecerdasan Buatan v022.pdf
TataKelola dan KamSiber Kecerdasan Buatan v022.pdf
 
Beyond the EU: DORA and NIS 2 Directive's Global Impact
Beyond the EU: DORA and NIS 2 Directive's Global ImpactBeyond the EU: DORA and NIS 2 Directive's Global Impact
Beyond the EU: DORA and NIS 2 Directive's Global Impact
 
microwave assisted reaction. General introduction
microwave assisted reaction. General introductionmicrowave assisted reaction. General introduction
microwave assisted reaction. General introduction
 
Arihant handbook biology for class 11 .pdf
Arihant handbook biology for class 11 .pdfArihant handbook biology for class 11 .pdf
Arihant handbook biology for class 11 .pdf
 
Web & Social Media Analytics Previous Year Question Paper.pdf
Web & Social Media Analytics Previous Year Question Paper.pdfWeb & Social Media Analytics Previous Year Question Paper.pdf
Web & Social Media Analytics Previous Year Question Paper.pdf
 
Mattingly "AI & Prompt Design: Structured Data, Assistants, & RAG"
Mattingly "AI & Prompt Design: Structured Data, Assistants, & RAG"Mattingly "AI & Prompt Design: Structured Data, Assistants, & RAG"
Mattingly "AI & Prompt Design: Structured Data, Assistants, & RAG"
 
Mattingly "AI & Prompt Design: The Basics of Prompt Design"
Mattingly "AI & Prompt Design: The Basics of Prompt Design"Mattingly "AI & Prompt Design: The Basics of Prompt Design"
Mattingly "AI & Prompt Design: The Basics of Prompt Design"
 
The basics of sentences session 2pptx copy.pptx
The basics of sentences session 2pptx copy.pptxThe basics of sentences session 2pptx copy.pptx
The basics of sentences session 2pptx copy.pptx
 

Acid rain damage to carbonate stone A quantitative assessment based on the aqueous geochemistry of rainfall runoff from stone.pdf

  • 1. EARTH SURFACE PROCESSESAND LANDFORMS, VOL. 13, 335-354 (1988) ACID RAIN DAMAGE TO CARBONATE STONE:A QUANTITATIVE ASSESSMENT BASED ON THE AQUEOUS GEOCHEMISTRY OF RAINFALL RUNOFF FROM STONE MICHAEL M.REDDY United States Geological Survey, Denver Federal Center, Lakewood, Colorado 80225, U.S.A. Received I5 October 1986 Revised 8 May 1987 ABSTRACT An onsite experimental procedure was used to identify and quantify acid rain damage to carbonate stone,based on the change in rain runoff chemical composition.Observed changes in runoff from stone are attributed to the interactionof acidicspeciespresent in the rain with the stonesurface.Onsitedata obtained during the summer and fall of 1984at three locations in the northeastern United States indicate that carbonate stone surfacerecession is related to acid deposition. Although the study is continuing, current data are not adequate to distinguish differences in the acid-stone reaction between limestoneand marble nor among the three study sites.A single linear relation between carbonate stone surface recession (the dependent variable)and hydrogen ion loading to the stone surface (theindependent variable)appears to describe the data set. KEY WORDS Limestone Marble Acid rain Carbonate stone damage INTRODUCTION Enyironmental damage to commercial materials and historical structures has been recognized over the past century, and has been the focus of recent research. Damage to both metals and building stone has been documented in several areas of Europeand North America (Environmental Resources, 1983;Del Monte et al., 1981;Camuffo et al., 1982;Chengand Castillo, 1984).Research on building stone damage by air pollution has focused on the net long term effect (Sharp et al., 1982)and the specificinfluence of sulphur dioxide (Luckat, 1977).In the United States damage to carbonate stone by sulphur dioxide has been reported by Haynie (1983), Winkler (1987) and Cheng et al. (1987). Previous studies of environmental damage to carbonate stone have dealt with the influence of air pollutants in general and sulphur dioxide in particular. Air pollution levels in the northeastern United States have decreased during the past decade. For example Husar (1986) states: ‘After about 1970 strong regional differences in trends of sulphur dioxide emissjons emerged. The most distinctive differences were between the regions north and south of the Ohio River.. Southeastern Canada (Region A) and the northeastern United States (Region B) show distinct downward trends.’ Air pollutant damage to building stoneand, in particular, that due to sulphur dioxide, may be less significant currently than in the past because of lowered urban pollution. In contrast to the decrease in sulphur dioxide concentration levelsdiscussed by Husar (1986),acidic deposition in the northeastern United States appears to be at high levels. Stensland et aL (1986)have conducted an exhaustive review of published data and conclude ‘Precipitation is currently more acidic in parts of the eastern United States than it was in the mid-1950s or mid- 1960s; however, the amount of change and its mechanisms are in dispute’. 0197-9337/88/04033 5-20$10.00 01988 by John Wiley & Sons, Ltd.
  • 2. 336 M. M. REDDY The different components of acid loading may play sjgnjficantly different roles i n the damage to carbonate stone. These components include wet and dry deposition. Wet deposition refers to the acidity of rain and is determined by the hydrogen ion concentration. Acidity is usually expressed in terms of pH which is the negative logarithm of the hydrogen ion concentration. The term acid precipitation is often used for precipitation with pH below 5.6, which is the pH of pure water in equilibrium with atmospheric carbon dioxide.Dry deposition refers to the deposition and accumulation of acidic speciesin the absence of rain. This includes deposition of acidic particulates and adsorption of acidic gases.A recent United Nations publication (Air-Borne Sulfur Pollution Report, 1984)states ‘Although the relative importance of each process is still not fully known, modelling and mass balance studies indicate that wet and dry depositions of sulphur compounds are of equal importance in northern Europe and North America. While in remote areas distant from sources dry deposition of sulphur seems to be of lesser importance, it has been concluded that dry deposition is relatively more important than wet depositions in areas like the Ohio Valley+lose to major emission sources.’ Forms and pathways that are associated with acid atmospheric deposition to exposed surfaces in the environment have been recently reviewed by Reuss and Johnson (1986). Previous work The study of damage to carbonate building stone by air pollutants has focused on the reaction of gaseous sulphur dioxide forming calcium sulphate minerals on the stone surface. This surface-sulphate formation process has been a particularly effectivedamage mechanism in areas with high sulphur dioxide concentrations in air. Sulphate formation damage is influenced by those factors which control transfer of sulphur dioxide to the liquid film (when present) on the stone surface. Procedures used to characterize carbonate stone erosion have involved characterization of surface crusts on carbonate stone (Del Monte et al., 1981;Camuffo et al., 1982;Cheng and Castillo 1984;Camuffo et al., 1984; and Cheng et al., 1987),weight loss measurements (Haynie, 1983),microerosion measurements (High and Hanna, 1970;Sharp et al., 1982;and Trudgill et al., 1981),and comparison of current stone dimensions with historic records (Husar et al., 1985;Sharpet a!., 1982).Results obtained by previous investigations of carbonate stone damage have emphasized the importance of atmospheric pollutants, contaminants on the stone surface which facilitate pollutant transformation and the influence of rain. High and Hanna (1970),in an early stream-bed geomorphology application of micro-erosion techniques, stress that numerous microerosion measurements must be made over a large area before an average erosion rate can be considered significant (seealso Trudgill et al., 1981).Sharp et al. (1982)using both a microerosion technique and a historical-based retrospective approach at St. Paul’s Cathedral, London, England reported that weathering rates differed depending on the stone surface microhydrology. Weathering rates were greater in drip zones than in exposed flow zones. Husar et al. (1985) in a retrospective tombstone study in the northeastern United States,reported a linear relation between weathering rates and estimated sulphur dioxide concentrations. A value of 0.1micrometres per year per part per billion sulphur dioxide was derived as the best estimate for weathering of fine grain marble from New York City. Haynie (1983)related marble erosion in St. Louis, Missouri to stone surface time-of-wetness, wind speed, temperature and air pollutant concentrations. Stone surface time-of-wetness was the only statistically significantfactor in stone damage. The influenceofsulphur oxides was found not to be significant.Chengand Castillo (1984)reported carbonate stone damage in Schenectady, New York attributable to sulphur dioxide uptake facilitated by soot particles on the stone surface. Luckat (1977)reported onsite damage to carbonate stone at the Cologne Cathedral, West Germany correlated with the rate of sulphur dioxide uptake. Del Monte et al. (1981)examining marble deterioration in northern Italian urban areas, reported that carbonaceous particles, serving as catalysts, are important agents of deterioration. Camuffo et al. (1982) stressed the importance of rainfall in carbonate stone deterioration: moisture condensation was felt to play only a minor role. Studies in Venice,Italy by Camuffo et al. (1984)where rain acidity is uncommon, have been reported to demonstrate only rare instances of acid rain damage to carbonate stone. Acid deposition damage to carbonate stone may be an important stone damage mechanism, but little quantitative data is available relating the acid loading to stone deterioration (Sherwood and Doe, 1984).In addition to onsite studies, laboratory investigations (Reddy et al., 1981)and chemical modelling (see for
  • 3. ACID RAIN DAMAGE TO CARBONATE STONE 331 example Nordstrom et al., 1979) can be used to estimate the extent of acid dissolution of carbonates. Laboratory studies and chemical modelling may have direct application in understanding acid rain damage to carbonates. However, the fact remains that the most relevant demonstration of acid deposition damage to carbonate stone,onsite measurements of representativecarbonatestone under carefully monitored conditions, has yet to be performed. Purpose and scope Research in the fieldsof geochemistry (Reddy et al.,1981 and references therein)and geomorphology (High and Hanna, 1970)demonstrates that reaction of calcium carbonate with aqueous solutions in the laboratory and onsite follows behaviour anticipated from chemical equilibrium and kinetics. However, little fundamental understanding of the processes involved in environmental damage to stone is available. In particular, quantitative estimates of carbonate stone-acid precipitation reactions are not reliable. This situation leads to large uncertainties in projecting acid precipitation impacts on limestone and marble. The objective of this research programme is to characterize and quantify environmental influences on carbonate stone damage. The programme focuswill be to address the influenceof acidic precipitation on stone damage. Where possible the separate contributions of wet and dry deposition on the observed stone deterioration will be evaluated. This report presents initial data obtained with an onsite,acid rain-stone damage technique at three locations in the northeastern United States during the last half of 1984.Work wasdonein conjunction with the National Acid Precipitation Assessment Program (NAPAP) effort to characterize acid rain damage to carbonate building stone (Sherwood and Doe, 1984).Onsite measurements of physical and chemical characteristics of rainfall and runoff from stone, and laboratory analysis of rainfall and runoff from stone samples have been used to estimate stone dissolution and acid loading to limestone and marble reference stones. Exposure conditions have been patterned after the American Society for Testing Materials (ASTM) procedures developed for metal damage studies (Flinn et al., 1986). A multivariate statistical analysis, using linear regression models, has been conducted to identify environmental conditions related to carbonate stone damage. This preliminary analysis has been restricted to those experimental and environmental variables available at the time of sample collection. Detailed climatology, meteorology, and air pollution data will be available in due course,and can be incorporated into a more general analysis of the onsite data. The onsite experimental procedure consisted of exposing carbonate stones and monitoring changes in rain composition due to rain reaction with the stone surface. Stones, representative of those used in commerce (Ross and Knab, 1984; Ross, 1985) were boldly (i.e. standing out prominently) exposed at 30" from the horizontal, facing south and were uncovered at all times. Exposure conditions were selected to be the same as those used for other materials damage studies sponsored by the National Acid Precipitation Assessment Program (see for example Flinn et al., 1986). Exposure angle and orientation ensure that the samples will receive the maximum solar radiation during the annual solar cycle. While the onsite experiment employing a fixedorientation was not planned to reflect all actual orientations and exposures of stone in the environment, these conditions were felt to allow direct comparison between several sites. Exposure angle influence on the measured damage is currently being investigated. During environmental exposures,processe:bther than acid attack can occur and lead to carbonate damage. The experimental procedure adopted in this study was planned to minimize extraneous experimental variability. It was felt that runoff experiments used here would have several advantages in the assessment of acid rain damage to stone. Equipment, analytical procedures, and quality control techniques are readily available. Moreover, runoff experiments were anticipated to yield carbonate stone damage rates in a relatively short time frame. In contrast weight loss experiments, for example, may require time intervals of several years to yield valid carbonate stone damage rates. These experimental attributes can be contrasted with disadvantages which deal mainly with separation of the effects of wet and dry acidic deposition on stone damage.Thesedisadvantages involvethe interaction of severalenvironmental processesincluding: (1)Wet and dry deposition; (2)Gaseous pollutants and wet deposition; (3) Biological effects and wet deposition; and (4) Aging of the stone surface and wet deposition.
  • 4. 338 M.M. REDDY Several descriptions of the installation and operation af materials damage field sites have been recently published (Sherwood and Doe, 1984; Reddy et al., 1985, a and b; Reddy and Werner, 1985). PROCEDURES At the present time, four NAPAP research stone-exposure sites have been established. These sitesare operated in the eastern United States at Newcomb, New York; Chester, New Jersey; Washington, D.C.; and Research Triangle Park, North Carolina (Figure 1). Site design Four stone-exposure racks, fabricated of polypropylene and capable of holding two stones each are located at each research site. Stone-exposure racks have been designed to facilitate collection of rain runoff from the stone surface (Figure 2) for comparison with the composition of incident rainfall. Stones are one foot by two feet by two inches in size, are sloped (30" to horizontal) and are facing south. The design of the stone-runoff racks incorporated features to minimize the influence of processes other than rain interaction with the stone surface. Specific experimental complications that were avoided include: (1) Development of standing water on the stone surface; (2)Presence of accumulated moisture on the back side of the stones; (3) Accumulation of particulate material in the runoff sample; and (4) Exposure of an ill-defined stone surface rainfall-interception area. Reference stones are held slightlyoff the collector base by rails. Slotted and circular openings (shown in Figure 2 in an unoccupied rack) are intended to reduce the accumulation of moisture on the lower stone surface. Incident rainfall strikes the inclined (30")stone surface and runs over the stone. At the base of the rack, this runoff is directed through a plastic tube to a covered plastic collection bottle. A glass wool filter was placed in the tube to prevent particulate material from entering the sample-collection bottle. Details of runoff experiment operation were developed based on actual onsite operation of the equipment; Del Figure 1. Map showing stone-exposuresite locations in the eastern United States
  • 5. ACID RAIN DAMAGE TO CARBONATE STONE 339 A B Figure 2. (A) A typical completed research stone-exposure site with research stones in place; (B) An isometric projection of a single research stone-exposure rack; racks are mounted in pairs with four sets per location then these details were incorporated into a Site Operators Manual that is supplied to each siteand members of NAPAP Task Group G. A brief summary of the Site Operators Manual is presented in the Appendix. Limestoneand marble stonesare located in two of the racks; a third empty rack, (withouta stone)is used asa control (hereafter referred to as a blank sample). At the end of each rainstorm, after measurement of the total runoff volume,a one litre subsample,or the total runoff if lessthan one litre, was taken for subsequent analysis. Runoff volume, specificconductance, and pH measurements were determined at the research-stone exposure
  • 6. 340 M. M. REDDY sitesas soon as possible after collection, typically within a few hours. Samples then werefiltered through a0.45- pm pore-size Schleicherand Sdhuellfilter (grade OE67),placed in a clean polyethylene bottle, and sent to the U.S. Geological Survey National Water Quality Laboratory in Denver, Colorado, for chemical analysis.(Any use of trade names is for identification purposes only and does not constitute endorsement by the US. Geological Survey.) Samples from Chester, N. J. were not filtered onsite. Unfiltered samples were mailed directly to Denver. Details of the onsite and laboratory procedures, as well as a brief summary of results, are given by Reddy and Werner (1985).Sample preparation, analytical procedures, and laboratory quality control procedures for the water sample are described by Fishman and Friedman (1985). Ancillary study-site measurements Each research-stone exposure site has other materials-damage experiments,in addition to those discussedin this report. These supplemental data include an array of meteorological, climatological, air pollution, and rainfall chemistry measurements. The character of the general environment in which the rock samples were exposed has been given by Flinn et al. (1986). Analytical techniques and quality control procedures Chemical analysis of rain and runoff samples were performed by the U.S.Geological Survey National Water Quality Laboratory located in Arvada, Colorado. Analytical procedures and techniques as well as laboratory quality control were performed by the laboratory staff. A discussion of the chemical analysis of the runoff sample has been recently published (Reddy and Werner, 1985).Blank and runoff from stone pH and specific conductance were measured in the field. Upon receipt of samples in the laboratory in Denver, pHand specific conductance were remeasured, and sample alkalinity was determined. Each sample was analysed for calcium and sulphate ion concentrations. On selected samples more extensive chemical analyses were performed as a quality control procedure. In addition, blank, duplicate, and Standard Reference Water Samples (SRWS)were processed on site and submitted for analysis at the same time as field samples. In general, results for the blank samples were below the detection limit of the methods used. Analytical method detection limits and precision values are given by Fishman and Friedman (1985). Analytical precision for Standard Reference Water Samples and duplicate samples was typically better than 10per cent (expressed as a per cent relative standard deviation). Recovery values for the SRWS were always within two standard deviations of the most probable value. As an additional check on analytical accuracy ionic balances were calculated for the major components determined in each sample. Theseionic balances show a slight anion excess,that may result from the absence of ammonium ion determinations. Ammonium ion was not determined, because the samples were not appropriately preserved for this sample constituent. RESULTS AND DISCUSSION A summary of onsite results obtained during the summer and fall of 1984are shown in Table I;rainfall amount data were not available for the Washington, D.C. site during the period covered here. Tabulated values include the number of rainfall events for each stone type at each site, the range of rainfall amounts; the ranges of rain and runoff pH, the calculated hydrogen ion loading, the calculated stone recession per rainfall event, and a parameter related to sulphate formation on the stone surface. The data set used for this summary is given in Reddy (1987). Rainfall-runoff’measurement Carbonate stone surface loss is calculated from the amount of calcium ion added to rainfall as it reacts and flows from the surface of the stone. The concept of surface recession due to marble dissolution by acid rain, is shown in Figure 3. In the case of rainfall-runoff from a marble surface,minimal porosity restricts acid reaction with the carbonate mineral to the surface zone. Acid deposition interaction with a porous carbonate stone differs from rainfall interaction with a marble surface.Additional factors that may influenceacid reaction with a porous carbonate surface (Figure4)include:
  • 7. ACID RAIN DAMAGE TO CARBONATE STONE 341 Table I. Summary of ranges for stonerainfall-runoff experiments for a selecteddata set for three stone research sites: Newcomb, New York; Chester, New Jersey; and Research Triangle Park, North Carolina during the summer and fall of 1984 RTP, NC Chester, NJ Newcomb, NY Limestone experiment Rain events Rain (mm) Incident pH Runoff pH H+ Load (meqm - 2, CaCO, lost (pm) Antecedent SO2 (PPb-daY) Marble experiment Rain events Rain (mm) Incident rain pH Runoff pH H + Load (meqm ~ ') CaCO, lost (pm) Antecedent SO2 (PPb' day1 13 5-55 4-4.5 7.4-9.1 0.2-2'3 0.02-0.6 &40 18 2-50 3.8-5.5 7.68.8 0.03-2'3 0.02-0.35 4-40 10 6-57 3.9-47 0.3-3.6 5.9-8. i 0.04-0.3 2 6 5 0 9 6-4 1 3.9-4.9 6'5-7.8 0.2-3.7 0.05-0.28 2 6 5 0 16 4-28 4.&4.7 7.7-8.6 0.1-1.7 0-04-0.I7 2-16 I5 4-28 4.0-4.6 7.1-8.3 0.2- 1.7 0.01-0.16 2-16 mm, millimetre; meq, milliequivalent; m2, metres square; pm, micrometre; ppb, parts per billion of sulphur dioxide gas in air. Marble a Input rainfall Surface lowering flow Figure 3. A schematicillustration of surface recession from rain flowing over a low porosity marble surface (modified fromTrudgill, 1983) C ? , - Limestone Input rainfall I , .1 1 , Sur.,,, runoff I 1 I Chem lowering , . I Solution Redistribution of constituents precipitation Figure4. A schematic illustration of 4 Infiltration surface recession from rain flowing over a porous limestone surface (modified from Trudgill, 1983)
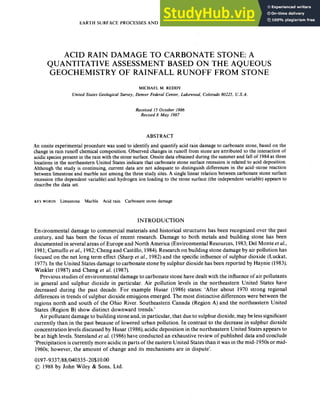
  • 8. 342 M. M. REDDY rain infiltration; dissolution and precipitation reactions within the stone; and leaching and subsequent movement of solutes from the interior to the stone surface. In addition to stone characteristics, the amount and intensity of rainfall will influence the runoff characteristics from a porous limestone. Small rain amounts of light rain intensity falling on a dry porous stone will cause little or no rainfall runoff. If none of the incident rain runs from the surface of the stone no calcium ion is removed from the stone surface;no observable net dissolution of the stone surface has occurred. In the caseofa porous limestone, in addition to loss of surface material through surface runoff, rain may infiltrate the interior of the stone. This infiltrating solution subsequently may reprecipitate calcium carbonate within the pore spaces, perhaps reducing the limestone porosity. Surface loss by other processes, such as granular disaggregation may lead to additional stone surface damage. Incident rainfall amount (expressedas depth,in millimetres)and the stone rainfall-runoff volume (expressed in litres)are variables which are used to calculate acid rain loading and damage to stone (Reddy and Werner, 1985).A sample calculation and experimental details are given in the Appendix. The relationship between rain amount and runoff volume (i.e. the microhydrology of the test stones) can be determined by direct measurement. In addition, the geometric projection of the stone surfaces can be used to calculate an intercepted volume of rain. Samples collected at Research Triangle Park during 1984 (Figure 5)illustrate several features of the sample microhydrology. Runoff volumes from each of the three sample types (i.e.limestone, marble,and a blank)have been analysed using a statistical linear regression. In Figure 5 the calculated interception volume for stone is referred to as ideal runoff from stone (calculated from the geometric rain interceptor area of the collector and the rain amount).The blank collector (Figure 2B)has a smaller interception area because of the weepholesand vent openings. The calculated blank interception volume is referred to as ideal blank runoff in Figure 5. Regression analysis for each of the three test surfaces shows a high degree of correlation. Table I1 summarizesthe statistical parameters which describe the linear regression model for the three test surfaces (i.e. limestone,marble, and blank). Each of the linear relations exhibitsa high correlation coefficient,supporting the direct relation of rain amount and rainfall-runoff volume from the test surfaces. The slope and intercept values among the test surfaces are consistent with the properties of each surface. The intercept obtained from the regression analysis is related to the rainfall volume collected by the test surface allowing measurable runoff. Regression analysis slope values of each data set in Figure 5 corresponds to the runoff produced per rainfall amount when the surface is fullywet. For the marble and the blank surface the volume of rain needed to wet the surface is approximately 25 ml. Limestone, because of its greater porosity, requires approximately 200 ml of rain to wet the surface. The slopes of the regression lines are consistent with the runoff surfaces (Figure 5). Marble has a slope similar to that for ideal value calculated for that collection surface. This suggests that little rain infiltrates into Table 11. Least-square regression relationship for blank, limestone, and marble surface runoff from rainfall,in litres per event, as a function of rainfallamount,in millimetres, at three stone-researchsites in the eastern United States. (A) Linear least-square regression; (B) Log transformed data A B Standard (1 m1-l) (1) r error A. Volume (1) = A* Rainfall (mm)+B Combined Sites Blank 0.066 0.0725 0.8966 0.3859 Limestone 0.084 0.010 0.7962 0.612 Marble 0.144 0120 0.9361 0447 B. Log [Volume (l)] = A* Log [Rainfall (mm)] +B Blank 1.0025 -1.163 0.9564 03795 Limestone 1.5906 - 1.813 0.9190 0.3795 Marble 1.0532 -0.8722 0959 0.1772
  • 9. ACID RAIN DAMAGE TO CARBONATE STONE 0 343 u- . c 0 C a a l o E 0.1 Rainfall, mm Limestone m A NC A NJ / r * NY 0.00 1 0.1 1 10 100 Rain, mm a i 5 5 0.1 > 0 C . c * 2 0.01 Marble : / * NC A NJ NY 0.00 1 0.1 1 10 100 Rain, mm Figure Sa, b, c
  • 10. 344 M. M. REDDY Blank NY 0.001 1 I 1 I I IIII I I I I 1 1 1 1 1 1 I I IIIILI 0 . 1 1 10 100 Rain, mm Figure5. Runoffvolume (in litres)versusrainfallamount (in millimetres)forsamplescollected at Research Triangle Park, North Carolina during the summer and fall of 1984 the marble surface. Limestone regression lies well below that for marble indicating that the porous stone apparently takes up additional water after that needed for surface wetting. The blank sample regression lies well above the ideal value calculated for that collection surface. This suggests that rain may be more efficiently collected than that anticipated based on the apparent interception area. Incident rain may flow or splash over the weep holes giving a higher collection efficiency than that calculated from the geometric interception area. For rainfall greater than 20 mm the rain amount needed to wet the limestone is only a fraction of the total incident rainfall. Under these circumstances the runoff amount for limestone increases. Rainfall-runoff data for the other sites studied are similar to rainfall-runoff data for Research Triangle Park. Several approaches have been examined for comparing rainfall-runoff amount to rainfall. Linear least- squares regressions of log-transformed rainfall amount to log-transformed runoff volume appear to give a useful representation of the statistical relation between rainfall and runoff. A summary of the statistical parameters for the log-transformed data for the combined data set is given in Table 11. Correlation coefficient values shown in Table 11are higher for all three collection surfaces when log-transformed data is used in the statistical evaluation. Plots of the log-transformed rainfall amount-runoff volume data (Figure 5) also demonstrate that the log-transformed data exhibit a better linear relationship than the untransformed data. As a test of the goodness-of-fit of the rain runoff-rain amount regressions, runoff amounts were calculated and compared with observed values. For limestone and for marble there is scatter in the values of actual-minus-calculated volume. Reasons for this scatter are not known at this time, but may arise because rain collection efficiency is strongly dependent on local meteorological conditions and volume loss due to evaporation. During some onsite runoff measurements rainfall-rwnoff volume from one or both stones was unavailable and was calculated from the log-transformed linear regression equation (Table I1 and Figure 5). Factors influencing stone surface recession Rainfall amount. Loss of carbonate stone under a fixed set of conditions, if there is not a kinetic limitation, is regulated by mineral solubility, expressed in units of mass per volume of solution. If,at equilibrium, the volume of aqueous solution reacting with a carbonate stone surface doubles then the carbonate stone loss would also double. If the dissolution reaction approaches equilibrium then the stone loss would be directly proportional to the amount of rain. Surface recession of carbonate stone is thus expected to be related to the amount of rain falling on the stone surface. (A detailed discussion of the calculation of surface recession from measured rain runoff composition has been presented by Reddy and Werner (1985)and is summarized in the Appendix.) Surface recession, for both carbonate building stones (expressed as calcium carbonate recession in
  • 11. ACID RAIN DAMAGE TO CARBONATE STONE 345 0.6 E a C 0 0, 0 .- 3 0.4 2 d % 0.2 0 0.0 micrometres per rain event)is plotted asa function of rainfall (inmillimetres)in Figure 6.Thedata points show a trend ofincreasing surface recession with increasing rain amount.Thesedata indicate that calciumcarbonate loss from both stone types is directly proportional to rainfall amount. Data shown in Figure 6 illustrate that there are not pronounced systematic differences between recession data for limestone and marble. Calcium carbonate dissolved and removed from the stone surface appears to be most influenced by the chemical nature of the surface. Both stone surfaces are composed of crystalline calcite and itsdissolution causes the observedcalcium ion in the rainfall runoff from the stone (seefor example, Reddy et al., 1985a and b).Physical differencesin the stone surfaces (i.e.stone porosity, grain size,and SO on)appear to be of secondary importance in regulating the calcium ion removal from the stone surface. Calcite dissolution kinetics (see for example Reddy et al., 1981)may limit removal of calcium ion from the stone surface under some conditions. Calcite dis'solution and subsequent calcium ion removal from the stone surfacemay reach a limitingvalue at high rainfall intensities. Thismay be thereason that there issomewhat less calcium ion removal for high rainfall amounts (Figure 6).If this is the case,then the rate of calcitedissolution at high rain amounts may become a transport controlled situation (Bermer, 1978). Additional planned rainfall- runoff measurements as a function of differing rainfall intensities should resolve this question. Lowest recession values are associated with low rainfall amounts on the limestone samples. These very low limestone recession values may be due to the low runoff volume because of water uptake by limestone. Incident rain p H . Since carbonate stone surface recession appears to be directly proportional to rainfall amount (Figure6),the recession valuescan be normalized to the rainfall amount (that is expressing the surface recession in micrometres of recession per millimetre of rain depth). This normalized surface recessionhas been found to correlate with incident rain pH (Reddy and Werner, 1985). Thus, both rainfall amount and rain pH appear to contribute in a significant way to loss of carbonate stone. Air pollutants. The influence of air pollutants on carbonate building stone damage has been described by Luckat (1977) and others. Typically such research has been conducted at locations with high pollutant concentrations and identifiable stone damage. In contrast to the elevated sulphur dioxide concentrations at European research sites sulphur dioxide concentrations at the NAAPA, Task Group G stone research sites shown in Figure 1 (Table 111) are low. Sulphur dioxideatmospheric concentrations and the presence of moisture on the stone surface between rain events are important characteristics influencing the transfer of sulphur dioxide to the stone surface. Thus, a record of sulphur dioxide air concentrations, the presence of stone surface moisture and the meteorological parameters that influence gaseous and particulate deposition to the stone surface at each research site are necessary to give a complete description of stone damage. In the stone damage study being conducted at the Limestone, 39 cases a - A Marble, 42 cases - i r - A - a A A a a - + a ' A - L * S y ' ' A a*+ A a A * r 8 a
  • 12. 346 M. M. REDDY four Task Group G research sites air pollution information is obtained simultaneously with damage measurements. Onsite meteorology, climatology, and air pollution data are being quality assured and verified and will be available for use in conjunction with stone damage in 1987. Sinceatmospheric sulphur dioxide is a recognized source of carbonate stone damage, an attempt was made to estimate sulphur dioxide influence on the carbonate stones exposed at the Task Group G sites. An index of carbonate stone-sulphur dioxide exposure was incorporated into the analysis of surface recession. This index is termed the antecedent sulphur dioxide exposure. It is calculated by multiplying the estimated site average sulphur dioxide concentration (Table 111) by the number of days between precipitation events. The rationale for use of a surrogate sulphur dioxide exposure variable is that sulphur dioxide transport to the stone surface will be related to atmospheric sulphur dioxide concentration and the length of exposure. Sulphur dioxide uptake by stone is a complex process mediated in large measure by stone surface moisture. Speeding (1969),for example, has found that sulphur dioxide uptake by limestone was dependent on the humidity. A better estimate of sulphur dioxideeffectoncarbonatestonedamage would includeaccurate6hour or 1 hour concentrations as well as peak values and durations. This information coupled with stone surface time-of-wetness information might allow future accurate calculation of sulphur dioxide flux to the stone surface. Hydrogen ion loading. Since carbonate stone surface recession depends on both rainfall amount and rain hydrogen ion concentration, surface recession will be correlated strongly to the product of these two terms. This product, hydrogen ion loading, is conveniently expressed in units of milliequivalents of hydrogen ion deposited per square metre of stone surface. In assessing acid rain effects, acid loading values often are used as independent variables in part because many environmental data bases have been developed using hydrogen ion loading as an estimate of acid deposition. Carbonatestone surface recession values,plotted as a function of hydrogen ion loading (Figure 7) exhibit a direct relation that is similar to that for loss due to rain amount.This similarity arises because,in part, rain ammnt is used in the calculation of hydrogen ion loading. Runoff amount, which is correlated to rainfall, is used in the calculation of recession. Data points lie along a line having a positive slope; suggesting that surface recession is directly proportional to hydrogen ion loading. Linear least-squares regressions were done relating the surface recession to hydrogen ion loading (Table IV)and to hydrogen ion loading with antecedent sulphur dioxide (Table V). The hypothesis of a linear relation between carbonate stone surface recession and hydrogen ion loading was evaluated using onsite data obtained during the summer and fall of 1984.In this statistical analysis, the known chemical solubility behaviour of calcium carbonate in the presence of acids allows us to assign stone surface recessionasa dependent variable and hydrogen ion load asan independent variable. Both variables are subject to random error. Coefficientsof correlation for the regression on hydrogen ion loading (Tables IV and V) exhibit a range of Table 111. Average sulphurdioxide concentrationvalues at each stone research site in the study area Site Average sulphur dioxide concentration (PPb) 1984* 1983t Research Triangle Park, 4-0 2 Chester, New Jersey 7.0 7 Newcornb, New York 1.8 3 North Carolina * Oral communication S.1. Sherwood, National Park Service, Washington, D.C., 1985. t Written communication, David Flinn, Bureau of Mines, Avondale, Maryland, 1985.
  • 13. ACID RAIN DAMAGE TO CARBONATE STONE 341 0.6 E a 0 " % 0.2 0 0.0 Limestone, - 39 cases - A Marble, 42 cases - A - m~ 1 - 0 1 2 3 4 Hydrogen ion loading, m e q h * Figure 7. Stone surface recession (in micrometres per rain event) for limestone and marble versus hydrogen ion loading (in units of milliequivalentsper square metre)at Newcomb, New York; Chester, New Jersey;and ResearchTriangle Park, North Carolina; during the summer and fall of 1984 Table IV. Linear least-square regression relation for limestone and marble surface recession, in micrometres per event, at three stone research sites in the eastern United States Y Research Triangle (Pm) Newcomb, NY Chester, NJ Park NC (A) Limestone m (micrometres per mil- 0.038 0.046 0.23 liequivalent of hydrogen ion per metre square) n 16 11 13 r 0.36 0-54 0.81 b (Pm) 0.060 0.068 -0.033 P 0.1 < 0.1 < 0.001 m (micrometres per (pm) 0.051 0.042 0.12 (B) Marble of hydrogen ion m2 b (Pm) 0.062 0.091 0.03 n 15 9 18 r 0.52 0.56 0-83 P < 0.05 0.1 < 0.001 y. dependent variable:calculated lim&tone or marble surface recession at each of three stone research sites, in micrometres (pm); m, slope of regression line, in micrometres per milliequivalentof hydrogen ion per metre square (pm mq- of hydrogen m- '); b, intercept of regression line with the y axisin micrometres (pm); n,number of data pairs for each stone type at each stone research site;r,coefficientof correlation; and p, probability that r will be equalled or exceeded in n pairs of randomly selected data pairs. significancevalues. Regression equations for both stone types at Research Triangle Park, North Carolina are significant with a high degree of confidence. The regression equations are significantat a lower confidencelevel for the New York and New Jersey sites. Coefficientsof regression for the two stone types at each of the three research sites are similar.A detailed statistical analysis of the differencesbetween these coefficientsis limited by the small number of cases. The regression coefficient for hydrogen ion appears to be higher at Research
  • 14. 348 M. M. REDDY Table V. Multiple least-squares regression relations for limestone and marble surface recession, in micrometres per event, at three stone research sites in the eastern United States Newcomb, New York Chester, Research Triangle Park New Jersey North Carolina A. Limestone m ( p n m e q - ' of hydrogen ion m-') 1 (pmpg-'l-') sulphur dioxide days b (pm) n r P B. Marble m (pnmeq-') of hydrogen ion m-' 1 ( p n p g - ' - ' ) sulphur dioxide days b (Pm) n r P 0.046 - 0.003 0.076 0.45 16 > 0.1 0.002 0.051 15 0 5 5 > 0.05 0.045 0.001 0.025 0.56 1 1 > 0.1 0.039 0.003 -0.019 9 0.71 > 0.05 0.23 -0.01 -0.03 13 0.81 > 0~001 0.12 0.0 0.027 in 0.83 > 0.001 y, dependent variable,calculated limestone or marble surface recession at each of three stone research sites; m, partial regression coemcient for hydrogen ion load, in micrometres per milliequivalent of hydrogen ion per metre square (pmmeq ~ ' of hydrogen ion me'); I, partial regression coefficient for antecedent sulphur dioxide, in micrometres per microgram per litre sulphur dioxide days (pmpg- 'I - I); b, intercept of regression line with y axis in micrometres (pn);m, number of data triplets for each stone type at each stone research site; r, multiple correlation coefficient; and p, probability that r will be equalled or exceeded in n triplets of randomly selected data triplets for unrelated variables. Triangle Park than at the other two sites for reasons that remain unclear. In addition, the influence of dry deposition on the measured surface recession may lead to dineerencesin the regression coefficientsamong the sites. Surface recession measurements for each stone type and site yielded data sets containing relatively small numbers of cases: these data sets were combined to examine the complete data set more fully. Statistical analysis included antecedent sulphur dioxide loading, as an independent variable, in addition to hydrogen ion loading. A summary of these results of the statistical analyses is given in Table VI. The statistical analysis of the combined data set, incorporating surface recession values for limestone, marble, and for combined limestone and marble for all three sites,gave results similar to results for the smaller data sets. The most statistically significant partial correlation coefficientreflects the influence of hydrogen ion loading, as was the case in the analysis by research site and stone type. Other potential stone damage factors associated with sulphur dioxide, site, and stone type are small and not significant. The hydrogen ion load coefficientonly is affected slightly by incorporation of other terms in the regression. Statistical analysis of the combined site and stone data supports strongly the relation between surface recession and hydrogen ion load (Table VI). Multiple correlation coefficient values and the significancelevel for the linear relation improve as the larger data set is used. Each of the combined site regressions is significant at the < 0.1 confidence level. Regression coefficientschange slightly for the two independent variables, going from marble, to limestone, to the marble-plus-limestone data set. Intercept values are uniform for the individual stones and the combined data; moreover, intercept values are similar to the values obtained by regression of the individual site data. Occasionally negative values are probably within the experimental error.
  • 15. ACID RAIN DAMAGE TO CARBONATE STONE 349 Table V1. Multiple linear least-squaresregression relations for limestoneand marble surface recession, in micrometres per event, using hydrogen ion loading and antecedent sulphur dioxide as independent variables Y (Pm) Limestone Marble Combined m (pmmeq-' 0.11 0.071 0.091 of hydrogen ion m sulphur dioxide days b (pm) 0.052 0051 0.053 n 39 42 81 r 0.60 070 0.61 -~ 1 (pmpg-'l-l) -0.001 0.0004 - 00005 y, dependent variable,calculated limestone,marble, or combined limestoneand marble surface recession at three stone research sites; m, partial regression coefficient for hydrogen ion load (micrometres per milliequivalentof hydrogen ion per metre squared ( pm meq; of hydrogen ion m- '); 1, partial regression coefficient for antecedent sulphur dioxide (pmpg- I I- '); b, intercept of regression line with y axis ( pm); n, number of data triplets for eachstone type or for both stone typescombined; r, multiple correlation coefficient;p. probability that r will be equalled or exceeded in n triplets of randomly selected data triplets for unrelated variables. Although the regression coefficients relating hydrogen ion loading to surface recession are significant, the regression coefficients for antecedent sulphur dioxide are not. This result suggests that sulphur dioxide levels may be too low at the stone research sites to yield a useful regression relation between surface recession and sulphur dioxide exposure. Additional studies are being conducted to incorporate actual sulphur dioxide concentrations and time-of-wetness information into the data analyses. The95per cent confidence levelsfor the slopeand intercept coefficientsfor the least squaresanalysis of stone surface recession as a function of hydrogen ion loading have been calculated using a procedure discussed in Dunn (1964).This analysis suggeststhat the uncertainty in the least-squares coefficientsis somewhat greater for the limestone data than for the marble data. For example, for limestone the slope and intercept coefficients have uncertainties of 50 per cent and 150per cent, respectively. Marble error ranges are a factor two smaller than those for limestone. A combined data set, using both limestone and marble data from all sites and elimination of some outlying data pairs exhibits regression coefficient error ranges similar to those observed for themarble dataset. It would seem that meteorological variables which influencethe moisturecontent of the stone surface may be most important, in addition to hydrogen ion loading, in predicting stone damage. Supportfor this assessment is that the limestone surface recession-hydrogen ion loading relationship, which is more influenced by surface moisture than the marble relationship because of limestones greater porosity, exhibits much higher uncertainty than the marble regression data. The surrogate variable used to identify stone type, also was not significant in the regression equation, which suggests that,with the current data,the two stcdaetypes respond in a similar fashion to hydrogen ion loading in spite of great differences in permeability. Differencesin the hydrogen ion loading term between sites may be significant. Elaboration of the reason for these site differences must await additional experimental data for each site. At the present time, the combined data set and the associated regression parameters appear to be the most useful quantitative expression that is available, which relates environmental hydrogen ion loading (that is acid rain) to carbonate stone damage, but more data are needed. Application of surface recession relation to composite materials The chemical reaction between aqueous hydrogen ion and solid calcium carbonate surfaces,quantified from the onsite exposure data, also may apply to composite construction or geological materials that have calcium carbonate as the bonding agent.Common examples of such materialsarelime mortar and carbonate-cemented
  • 16. 350 M. M. REDDY sandstone. These materials often consist of unreactive mineral grains (e.g. quartz grains in the case of calcite- cemented sandstone)held in place by a crystallinecalcium carbonate matrix. In mortar, carbonation proceeds from the surface asa slowlymoving front.Thus, although mortar contains hydroxides,the portion exposed to acid and sulphur dioxideattack can be regarded as being predominantly crystalline or microcrystalline calcium carbonate. In view of the unique structural role of calcium carbonate in these materials the experimental results for limestoneand marble dissolution also may describe the lossof the calcium carbonate matrix. Quartz grains in a lime mortar or sandstone may behave as an inert material that will be removed from the surface by granular disaggregation as the carbonate bonding matrix is lost. If this hypothesis is correct, the mortar linear recession rate would increase as the amount of quartz increases in the composite material. SUMMARY AND CONCLUSIONS A goal of this research programme is to develop reliable methods to identify and quantify environmental damage to carbonate stone. The onsite experimental programme used in the investigation reported here satisfiesthis goal. Rainfall runoff from the research stonesexhibitsmicrohydrologicalcharacteristicswhich are compatible with measuring stone damage due to acid rain reacting with the carbonate stone surface. Dissolution of the stone surface increases calcium concentration in the rainfall runoff. This increase in calcium concentration can be converted into a surface loss of calcium carbonate or a uniform carbonate surface recession. Stone surface recession was found to be directly proportional to rainfall amount. There were not pronounced differences in surface recession exhibited between limestone and marble. Identification and quantification of the influence of acid precipitation on carbonate stone damage is an additional goal of this programme. Results presented here have shown that surface recession is directly proportional to rainfall hydrogen ion loading to the stone surface. A preliminary estimate of the influence of sulphur dioxide deposition on stone damage suggests that damage to the stone by sulphur dioxide is not significant. Multivariant statistical analysis, using linear regression models, demonstrates that neither stone type nor location are statistically related to stone surface recession. The multivariant statistical linear regression model relating carbonate stone surface recession to hydrogen ion loading may also have application to composite materials which have calcium carbonate as a binding matrix. ACKNOWLEDGEMENT This work has been funded, in part by the National Park Service and the National Acid Precipitation Assessment Program. Results and conclusion presented in this publication do not necessarilyreflect the views of the National Park Service nor the National Acid Precipitation Assessment Program. REFERENCES Air-Borne Sulfur Pollution Report prepared within the framework-pf the Convention on Long-Range Transboundary Air Pollution, Bermer, R. A. 1978. ‘Ratecontrol of mineral dissolution under earth surface conditions’, American Journal o f Science, 278, 1235-1252. Camuffo, D., Del Monte, M., Sabbioni, C.,and Vittori, 0.1982. ‘Wetting,deterioration and visual featuresof stone surfacesin an urban Camuffo, D.,Del Monte, M.,and Sabbioni, C. 1983.‘Originand growth mechanismsof the sulfatedcrustson urban limestone’,Water,Air, Camuffo, D., Del Monte, M., Ongaro, A. 1984. ‘The pH of the atmospheric precipitation in Venice, related to both the dynamics of Cheng, R. J. and Castillo, R. 1984. ‘A study of marble deterioration at city hall, Schenectady, New York’, J . ofthe Air Pollution Control Cheng, R. J., Hwu, J. R., Kim, J. T. and Leu, S-M. 1987. ‘Deterioration of marble structures’, Analytical Chemistry, 59(2), 104A-106A. Del Monte, M.,Sabbioni,C.,and Vittori,0.1981. ‘Airbornecarbon particlesand marbledeterioration’,Atmos. Enuironment, 15,645-652. Dunn, 0.J. 1964. Basic Statistics: A Primerfor the Biomedical Sciences, John Wiley and Sons, Inc., New York,184 pp. Environmental Resources Limited, 1983. Acid rain, a reoiew of the phenomenon in the EEC and Europe, New York, Unipub for the United Nations, New York, 1984. area’, Atmospheric Environment, 16 (9),2253-2259. und Soil Pollution, 351-359. precipitation events and the weathering of monuments’, The Science o f the Total Encironment, 40, 125-139. ASSOC., 34(1), 15-19. Commission of European Communities, 159 pp.
  • 17. ACID RAIN DAMAGE TO CARBONATE STONE 351 Fishman, M. J. and Friedman, L. C. (Eds) 1985.‘Method for determination of inorganic substances in water and fluvial sediments’, Techniques of Water-Resources Investigations of the United States Geological Survey, Book 5, Chapter Al, Open-File Report, 85495, 709 pp. Flinn, D. R., Cramer, C. D., Carter, J. P., Hurwitz, D. M. and Linstrom, P. J. 1986.‘Environmental effects on metalliccorrosion products formed in short-term atmospheric exposures’,in Babioan, R. (Ed.),Materials Degradation Caused by Acid Rain,ACSSymposiumSeries, No. 318, American Chemical Society, Washington, D. C., 119-151. Haynie, F. H. 1983.‘Deterioration of marble’, Durability of Building Materials, 1(3), 241-254. High, C. J. and Hanna, F. K. 1970. ‘A method for the direct measurement of erosion on rock surfaces: Norwich, Eng.’, British Geomorphological Research Group, Technicul Bulletin, 5, 24 pp. Husar, Rudolph B. 1986.‘Emissionsof sulfur dioxideand nitrogen oxidesand trends for eastern North America’,in Acid Deposition:Long- Term Trends,Committee on Monitoring and Assessment of Trends in Acid Deposition National Research Council, National Academy Press, Washington, D.C., 48-92. Husar, R. B., Patterson, D. E., and Baer, N. S.1985.‘Deterioration of marble: a retrospective analysis of tombstone measurements’,US‘. Environmental Protection Agency, Atmospheric Sciences Research Laboratory, Research Triangle Park, N.C.,DX 14930338-01-1,23pp. Little, T. M. and Hills, F. J. 1978. Agricultural Experimentation: Design and Analysis, New York, John Wiley and Sons, 350 pp. Luckat, Siegbert 1977.‘Stonedeterioration at the Cologne Cathedral and other monuments due to action of air pollutants’,in Proceedings of the 4th International Clean Air Conference, Tokyo, Japan, 1977, 128-120. Nordstrom, D. K. and others, 1979.‘A comparison of computerized chemicalmodels for equilibrium calculations in aqueous systems’,in Jenne, E. A. (Ed.),Chemical Modeling in Aqueous Systems, Washington, D.C. American Chemical Society, Syniposium Series No. 93, 857-892. Reddy, M. M. 1987.‘Acid-raindamage to carbonate stone: A preliminary quantitative assessment based on the aqueous geochemistryof rainfall runoff’, U S . Geological Survey Water Resources Investigation, 87. Reddy, M. M. in press.‘Acid-raindamage to carbonate stone:a preliminary quantitative assessment based on the aqueous geochemistryof rainfall runoff ’ , U.S. Geological Survey Open-File Report. Reddy, M. M., Plummer, L. N., and Busenberg, E. 1981.‘Crystal growth of calcite from calcium bicarbonate solutions at constant PCO, and 25°C: a test of a calcite dissolution model’, Geochimica et Costnochimica Acta, 45(8), 1281-1289. Reddy, M. M.,Sherwood, S. I.,and Doe, B. R. IY85a.‘Modelinglimestonedissolution by acid rain’,in Proceedings of the American Institute of Architects, Los Angeles, California, March, 1985, 383-388. Reddy, M. M., Sherwood, S. I., and Doe, B. R. 1985b. ‘Limestone and marble dissolution by acid rain’, in Proceedings of the 5th International Congress on Deterioration and Conseruarion of Stone, Lausanne, Switzerland, September 1985, 517-526. Reddy, M. M. and Werner, M. 1985. ‘Composition of rainfall-runoff from limestone and marble at Research Triangle Park, North Carolina’, U S . Geological Survey Open-File Report, 85630, 6 pp. Reuss, J. 0.and Johnson, D. W. 1986. Acid deposition and the acid$cation of soils and waters, Springer-Verlag, New York, 119pp. Ross, M. 1985.‘Description,selection,and procurement of Shelbourne Marble samples used to study effectsof acid rain’, U.S.Geological Survey Open-File Report, 85594, 15 pp. Ross, M. and Knab, L. 1984. Selection, procurement, and description of Salem Limestone samples used to study effects of acid rain, Gaithersburg, Md., National Bureau of Standards, NBSIR 84-29050, 17 pp. Sharp,A. D., Trudgill, S.T.,Cooke, R. U., Price,C. A., Crabtree, R. W., Pickles,A. M.,and Smith, D. I. 1982.‘Weatheringof the balustrade on St. Paul’s Cathedral, London’, Earth Surface Processes and Landforms, 7(4),387-389. Sherwood, S. 1. and Doe, B. R. 1984. ‘Acid rain stone test sites’, EOS, Transactions 65 (50),1210pp. Speeding, D. J. 1969. ‘Sulphur dioxide uptake by limestone’, Atmospheric Environment, 3, 683. Stensland, G.J., Whelpdale, D. M.,and Oehlert, G. 1986.‘Aciddeposition: long-term trends committee on monitoring and assessmentof Trudgill, S.T. 1983. Weathering and Erosion, Butterworths, Boston, 192 pp. Trudgill, S. T., High,C.J.,and Hanna, K. K. 1981.‘Improvements to the micro-erosion meter (MEM)’,British Geomorphological Research Winkler, Erhard M. 1987.‘Weathering and weathering rates of natural stones’,Enoironmental Geology and Water Science, 9(2),85-92. trends’, in Acid Deposition National Research Council, National Academy Press, Washington, D.C., 128-199. Group, Technical Bulletin, 29, 3-17. APPENDIX. EXPERIMENTAL PROCEDURE Site characteristics Each monitoring site has four racks placed CBB three plywood boxes or bases. Sample bottles, supplies, and other equipment are located inside the bases. Each rack has two, 12by 24inch slotsfor glasssheets,stone slabs, or blanks providing a maximum of eight slots per site. Four slots are available for precipitation-runoff sample collection, and four slots are used for measurements replication when appropriate. Racks are number 1 through 4. Slots used for collecting samples are numbered A1 through A4; the other slots are numbered B1 through B4. Racks are side by side, in sequential order. Slots may be arranged in any workable order. Each set of racks, A and B, contains at least one glass sheet, one limestone slab, one marble slab, and one blank slot. Pexiglass splash guards are placed between the slots to avoid contamination between slots. Site maintenance Visualinspection of the racks is made immediately after arrival at the site. If maintenance is required, it needs to be doneafter the water sampleis removed and before the replacement bottle is installed. Debris deposited by
  • 18. 352 M. M. REDDY natural causes on a rack is left as is. Other debris (for example, leavesjamming the drain outlet of the rack) is gently removed and such removal is noted on the Inspection Log. Sample collection procedure is as follows: 1. Check apparatus for normal operation. 2. If a collection bottle contains any water, remove, cap,and label the bottle with a unique sample number and the date and time of removal. 3. Perform and make a note of maintenance. 4. Replace original collection bottle with a clean, pre-labelled collection bottle. (Collection bottles need to be rinsed well with distilled water three times and air dried.) 5. Check the in-line, fibre-glass filter and replace the filter if debris has accumulated. 6. Insert the sample-collection line into the replaced collection bottle. Sample processing Samples are to be processed immediately after collection, preferably indoors under controlled conditions, using reliable equipment. All glassware is to be scrupulously clean. If possible, perform all measurements at a room temperature of 25" (degree Celsius). Cleaning glassware. Collection bottles and glassware (bothnew and used)need to be rinsed three times with distilled water, then rinsed with dilute nitric acid,then rinsed three times with distilled water, and then allowed to air dry. Dilute nitric acid is prepared by mixing 1 part of acid with 20 parts of water. The procedure for sample collection is designed for the collection of a sample after every storm. The Filtration procedure. 1. Wear rubber gloves. Do not touch the inside of the filtration equipment. 2. Use of 0.45 pm sealed filterattached to 50 ml syringe to provide pressure. Use of a pump filtration assembly with 50 mm diameter, 0.45 pm filter is an acceptable alternative to the filtration syringe. 3. Rinse the filter by passing 25 ml of distilled water through filter, followed by 10ml of sample. Discard this filtrate. 4. Rinse a clean shipping bottle with 25 ml of distilled water. Filter one half (asmuch as 250 ml)of the sample through the filter and into the shipping bottle. If the filter clogscompletely before 250 ml have been filtered, rinse the syringe and use a new rinsed filter. 5. Cap and label the shipping bottle; specify 'FILTERED. 6. Discard filters. The syringe can be reused if it is still operating well. Use separate syringes and filters for filtering the limestone, marble, and blank samples, or rinse well with distilled water between samples. Volume Measurement and Processing Options. 1. Pour sample into a clean graduated cylinder with a volume of 1OOOml (millilitres); record volume to nearest 10ml. 2. If volume is less than 200 ml: (a) Measure pH and specific conductance of unjiltered sample. (b) Pour any remaining sample, without Jiltering,into a clean shipping bottle with a volume of 250 ml. 3. If the volume is more than 200 ml: (a) Measure pH and specific conductance of unfiltered sample. (b) Filter one half of remaining sample into a clean shipping bottle with a volume of 250 ml. (c) Pour remaining one half of sample, withoutfilrering,into anotherclean shipping bottle with a volume of 250 ml. pH measurements. About 20 ml of sampleare needed for these measurements. General procedures applying @ # to all measurements during calibration of the instrument and measuring of the sample pH are:
  • 19. ACID RAIN DAMAGE TO CARBONATE STONE 353 1. Before first measurement and between measurements, rinse the glass pH electrode three times with distilled 2. Carefully adjust the temperature compensation for every measurement. 3. Allow all measurements to stabilize before recording them; this may take as much as 15 minutes for dilute water, then rinse with the next solution to be measured. solutions. Before sample pH is measured, the instrument is to be calibrated as follows: 1. Measure pH of distilled water and standard dilute acid. 2. Calibrate the zero adjustment using the pH 7.00 buffer. 3. Adjust the slope control using the pH 4.00 buffer. 4. Repeat steps 2 and 3 until measurements for each buffer are within 0.01 pH unit of known value. 5. Measure the pH of distilled water and standard dilute acid as checks of instrument calibration record sheet. Measure sample pH as follows: 1. If sample volume is less than 200 ml, make 1 measurement. 2. If sample volume is more than 200 ml, make 2 measurements. 3. Record measurements on Attachment 11. 4. After all samples are measured, or after every 10 samples are measured, check for calibration drift by measuring pH 7.00 and 4.00 buffers. If calibration has drifted more than 005 pH units, recalibrate the pH meter. Specijic Conductance Measurements. About 20 ml of sample are needed for these measurements. General procedures applying to all measurements during calibration of the instrument and measuring of sample specific conductance are: 1. Between measurements, rinse the measuring cell three times with distilled water, then rinse with the next 2. If possible, adjust the meter, to the appropriate cell constant. Also temperatures, and the cell constant. 3. Allow readings to stabilize. Record all specific conductances, temperatures, and the cell constant. 4. Measure the specific conductance of low and high standard solutions and of distilled water. 5. If your meter does not have adjustments for temperature or cell constant, you may use the following solution to be measured. formulae to compute the specific conductance of your standard solutions at 25°C: CmK c2= 1+0.02 (T- 25) where C, = actual specific conductance (ps/cm); C, = measured specific conductance (ps/cm); K = cell constant; and T = temperature ("C) 6. Measure specific conductance of distilled water and standard dilute acid solutions and KCl solutions as checks. 7. Measure specific conductance of sample and repeat if sample volume exceeds 200 ml. 8. After all samples are processed, measure sR+fic conductance of distilled water and standard solutions. Quality Control. To determine if any loss or contamination is occurring in the sample processing, a filtered standard reference sample and filtered distilled water blank sample are to be submitted each month. These samples are prepared exactly as the precipitation sample. As a check on analytical variation, the operator is to submit a set of duplicate samples each month for the first storm that has volume larger than 1,000ml. Duplicate samples are to be processed in the same manner as all other precipitation samples. A filtered and unfiltered sample are to be provided for each duplicate sample. Calculation of surface recession for limestone and marble Analytical results for calcium and sulphate ions are for the net change in rainfall composition after the rainfall flows over the surface of the exposed stone. The net concentration, assumed to result from the interaction of rain with the stone surface, is calculated by subtracting the blank sampleconcentration from the
  • 20. 354 M. M. REDDY concentration measured for the stone runoff. Granulardisintegration of the test stones,a process which may be important in determining the total erosion rate, is not evaluated in these measurements. Sulphate ion net concentration has been calculated to identify the presence of soluble mineralscontaining sulphate on the stone surface. Surface recession is calculated from the measured solution concentrations, rainfall runoff volume, stone density, and stone surface area by multiplication by the appropriate conversion factors. A sample calculation is given in Table AI. Table AI. Sample calculation for determining calcium carbonate reference stone surface recession from measured data Net calcium ion concentration in stone runoff: Measured calcium ion concentration in runoff = 12.08 milligrams per litre. Measured calcium ion concentration of blank = 0.53 milligrams per litre. Calcium ion concentration from reference stone dissolution (12.08-0.53) = 11.55 milligrams per litre. Total weight o f calcium lost from stone surface: (Net calcium concentration in runoff) x (runoff volume) = milligrams calcium. 1155 milligrams per litre x 1.91 litres = 22.11 milligrams calcium. 22.1 milligrams calcium x 2.50 ~ = 55.2 milligrams calcium carbonate. 55.2 milligrams calcium carbonate x (0001)= 0.055 gram calcium carbonate. Volume of calcium carbonate lost from stone surface: 0.055 gram calcium carbonate + 2.7 grams per cubic centimetre = 0.02 cubic centimetre calcium carbonate. Surface recession of reference stone: 0.02 cubic centimetre calcium carbonate t 1858 square centimetres = 1.1 x lo-’ centimetre. 0.11 x CaCO, Ca = 0.11 micrometre of calcium carbonate lost.