Total vacancy in Detroit office space has continued to decline since 2011 and is expected to further decline through 2015, ensuring favorable conditions for tenants. However, over 14.5 million square feet remains vacant. Rents are expected to modestly rise among Class A properties. The economic challenges have prevented new speculative construction, though demand growth will translate to further vacancy declines. Office employment increased 2.7% annually with gains in professional/business services of 9,700 jobs. Several companies are expanding, relocating or consolidating operations in Detroit, including Ally Financial and La-Z-Boy choosing to remain in the city.
Industrial employment sectors have experienced substantial employment expansion over the last year, recording an annualized net gain of 31,400 jobs across the metro.
According to the most recent estimates from the BLS, total non-farm employment in Detroit stood at ~1.9 million payrolls, representing an annualized increase of 12,500 jobs or 66 basis points. Meanwhile, unemployment decreased 1.2 percentage points year-over-year to 7.0 percent.
Office-using employment sectors have experienced substantial employment expansion over the last year, recording an annualized net gain of 12,500 jobs across the metro.
The Columbus metro continued its steady expansion by recently adding 15,200 payrolls, year-over-year, bringing total non-farm employment to 1.02 million. Meanwhile, unemployment fell 60 basis points year-over-year to 3.8 percent.
Office employment sectors contracted over the last year, recording an annualized net loss of 600 jobs. Professional and business services was the only office-using supersector to post employment gains, adding 2,200 jobs, year-over-year
The Cincinnati metro continued its steady expansion by recently adding 20,000 payrolls, year-over-year, bringing total non-farm employment to 1.06 million. Meanwhile, unemployment fell 80 basis points year-over-year to 4.1 percent.
St. Louis unemployment held steady at 5.6 percent this month as the number of job seekers kept pace with employment. The number of employed workers continues to be at post-recession highs.
JLL Cincinnati Office Employment Update May 2015Andrew Batson
The office employment sector continued its streak of strong jobs growth, posting an annual net gain of 5,500 jobs according to the latest data from the BLS.
Non-farm employment across the Baltimore metro area totaled nearly 1.4 million, which is up 2.5 percent compared to the previous year and 4.4 percent higher than the previous cyclical peak reached in late 2007.
Industrial employment sectors have experienced modest employment expansion over the last year, recording an annualized net gain of 3,100 jobs across the metro. Employment gains were led by the mining, logging and construction sector, which added 3,100 jobs year-over-year.
Office-using employment sectors have experienced sustained, albeit modest employment expansion over the last year, recording an annualized net gain of 3,200 jobs across the metro.
The Columbus metro enjoyed strong jobs growth as of late by adding 23,000 payrolls, annually, according to the latest figures from the BLS. Total non-farm employment now sits at roughly 1 million jobs. Meanwhile, unemployment currently stands at 5.0 percent, an increase of 1.1 percent from the previous month.
This is the Boyle County Employment Report for Q4 2010 compiled by the Boyle County Industrial Foundation and released publicly by the Danville/Boyle County Economic Development Partnership. (Due to a data correction, this report was revised on January 30, 2011.)
JLL September 2015 Baltimore Employment UpdatePatrick Latimer
Baltimore’s steady economic recovery continued in September as payrolls grew by 2.1 percent compared to the previous year and the unemployment rate edged downwards to 5.3 percent.
This is the First Quarter 2012 employment report for Boyle County, Kentucky, compiled from employment data monitored by the Boyle County Industrial Foundation.
This is the Boyle County Employment Report for Q3 2010 compiled by the Boyle County Industrial Foundation and released publicly by the Danville/Boyle County Economic Development Partnership.
Columbus MSA employment was up 8,200 (0.8 percent) from March to June, ahead of Ohio’s increase of 0.4 percent and the U.S. increase of 0.6 percent, according to the Q2 economic update report produced by Columbus 2020. Going into the second half of the year, unemployment in the Columbus Region continued to decline at 4.6 percent, compared to June state and national rates of 5.5 and 6.1, respectively.
The Cincinnati metro enjoyed strong jobs growth by recently adding 19,300 payrolls, year-over-year, bringing total non-farm employment to 1.03 million. Meanwhile, unemployment rose 1.2 percent from the previous month to 5.5 percent, equal that of the national level.
JLL Columbus Office Employment Update February 2015Andrew Batson
The Columbus metro saw modest job growth according to the latest figures from the BLS, adding 8,300 payrolls, annually. Meanwhile, unemployment remains virtually unchanged from the previous month at 3.7 percent, one of the lowest in the U.S.
The Columbus metro added 8,300 payrolls, annually, according to the latest figures from the BLS. Total non-farm employment now sits at roughly one million jobs. Meanwhile, unemployment remains virtually unchanged from the previous month at 3.7 percent.
13 Steps to Set Up & Implement Google Analytics Through Google Tag ManagerAnnie Singer
Need help setting up Google Analytics and Google Tag Manager for your blog, small business, or website? Part 1 of this series showed you how to set up your Google Analytics account and generate your UA Code.
Part 2 shows you 13 easy steps to set up your Pageview tag and implement Google Analytics tracking through Google Tag Manager. Screen shots of code implementation are from Wordpress. This process will vary by platform.
Visit anniesinger.me for more details on this presentation.
Industrial employment sectors have experienced substantial employment expansion over the last year, recording an annualized net gain of 32,200 jobs across the metro.
Office-using employment sectors contracted over the last year, recording an annualized net loss of 4,400 jobs across the metro. The largest job losses occurred in the financial activities sector, where total employment declined by 2,700 jobs year-over-year.
St Louis office employment update | April 2015Blaise Tomazic
A surge in the labor force caused the St. Louis unemployment rate to spike 60 basis points from the previous months to 6.0 percent. This is still an improvement of 150 basis points from the previous year. The labor force increased by 3.4 percent year-over-year; its largest change since 1995 and an encouraging sign that more workers are available in the local labor force.
JLL Columbus Office Employment Update May 2015Andrew Batson
Office employment sectors contracted over the last year, recording an annualized net loss of 600 jobs. Professional and business services was the only office-using supersector to post employment gains, adding 2,200 jobs year-over-year
The Cincinnati metro continued its steady expansion by recently adding 14,400 payrolls, year-over-year, bringing total non-farm employment to 1.04 million. Meanwhile, unemployment fell 1.2 percent to 4.8 percent from the previous year.
Office-using employment in the Twin Cities increased by nearly 7,000 jobs month-over-month and by more than 12,000 jobs year-over-year in the most recent data from BLS.
The Cincinnati metro enjoyed strong jobs growth by recently adding 19,300 payrolls, year-over-year, bringing total non-farm employment to 1.03 million. Meanwhile, unemployment rose 1.2 percent from the previous month to 5.5 percent, equal that of the national level.
The office employment sector continued its streak of strong jobs growth, posting an annual net gain of 5,500 jobs according to the latest data from the BLS.
JLL Cincinnati Office Employment Update May 2015Andrew Batson
The office employment sector continued its streak of strong jobs growth, posting an annual net gain of 5,500 jobs according to the latest data from the BLS.
The Columbus metro continued its steady expansion by recently adding 15,200 payrolls, year-over-year, bringing total non-farm employment to 1.02 million. Meanwhile, unemployment fell 60 basis points year-over-year to 3.8 percent.
According to the most recent estimates from the Bureau of Labor Statistics, total nonfarm employment in Detroit stood at ~2.0 million payrolls, representing an annualized increase of 45,200 jobs or 2.4 percent. Meanwhile, unemployment decreased 2.7 percentage points year-over-year to 6.2 percent.
While the metro may be experiencing some short-term fluctuations in employment levels, the long-term prospects for Pittsburgh remain among the brightest in the Great Lakes region based on the metro’s diverse economic base
Office-occupying employment has now had annual losses in three consecutive months. The most recent loss of 2,900 jobs was the largest since 2012. Government remained the laggard in the category, contracting by 4,000 jobs from the prior year. Employment in the sector is down 24 percent since its peak in 2010.
The Cincinnati metro enjoyed strong jobs growth by recently adding 21,700 payrolls, year-over-year. Total non-farm employment now sits at 1.05 million. Meanwhile, unemployment fell 20 basis points from the previous month to 4.1 percent.
The Twin Cities gained nearly 32,000 jobs in 2014 and continues to have the lowest unemployment rate among U.S. metro areas with at least one million residents.
According to the most recent estimates from the BLS, total non-farm employment in Pittsburgh stood at ~1.2 million payrolls, representing an annualized increase of 9,100 jobs or 80 basis points. Meanwhile, unemployment decreased 1.7 percentage points year-over-year to 4.3 percent.
Similar to Detroit JLL Office Employment update july 2015 (20)
The Indy industrial market continued to grow this quarter. Net absorption has already surpassed last year’s total and completed construction is closing in on last year’s total.
Finance and insurance driving expansions and relocations in the market
As of third quarter, metro employment in the finance and insurance industries finally approached pre-recession levels.
The office market saw substantial leasing activity from firms like Ally Financial which recently relocated 150 employees to the Shoreview Corporate Center with plans to add another 250 jobs by 2017.
Other firms like One Beacon Insurance Group, Securian Financial Group, Travelers Companies, and General Casualty Company have either invested in new space or absorbed existing space in all corners of the Minneapolis-St. Paul market.
Grand Action, a non-profit organization made of the city’s wealthiest benefactors, led the way on three major projects that, starting in the 1990s, transformed downtown Grand Rapids. The
Minneapolis CBD leads in large leasing deals
Vacancy rates in Minneapolis CBD continue their trend of shrinking every quarter. Vacancy at IDS Center declined 250 basis points since 2014 and the building now has its lowest quarterly vacancy in recent years. The demand for premium downtown office space is substantial and even co-working firms are getting in on the craze. Recently, two shared-space companies out of Chicago, Industrious and Assemble, leased a collective 36,000 sf with plans to rent out collaborative workspace to entrepreneurs and small firms by end of year.
Leasing activity and tenant demand in Cleveland looks quite strong. Office employment sectors have recorded sustained jobs growth over the last three years, which is translating into increased tenant demand.
Downtown Detroit is beginning to show its credit worthiness to the capital markets. With interest rates at all time lows but expected to rise in the near future, investors are looking to take advantage.
After increasing in July, the local labor market contracted by 2,000 workers in August. Along with that employment held flat, still near a historic high. As a result, unemployment edged down 40 basis points to 3.3 percent.
The size of the local labor force declined by 32,000 workers in August. That contraction caused the unemployment rate to decline 40 basis points to 5.7 percent.
Total net absorption across the metro equaled 322,977 square feet in the third quarter, a welcome change from the negative absorption posted in each of the previous two quarters.
Detroit’s economy added 46,900 net new jobs over the last year, representing a 2.5 percent increase. With steady employment gains across the metro, look for further improvement in Detroit’s office and industrial property sectors.
Manufactured goods constitute 90 percent of Illinois exports and roughly half of the state’s manufacturing output. Last year Chicago area companies accounted for over two thirds of the $68.3 billion worth of exports that originated in Illinois. Metro exports have exhibited steady improvement over the past five years growing by an average of $3.8 billion annually as manufacturing user demand followed suit.
Roughly 60 percent of Chicago’s exports were sent to countries with existing free trade agreements in place. According to the Department of Commerce members of the proposed Trans-Pacific Partnership imported $28.7 billion worth of products from Chicagoland last year. Should TPP move forward escalating trade volumes are likely to impact the local industrial market.
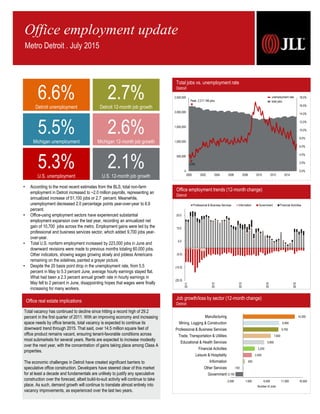
1. Office real estate implications
Sources: JLL Research, Bureau of Labor Statistics
Job growth/loss by sector (12-month change)
Detroit
Total vacancy has continued to decline since hitting a record high of 29.2
percent in the first quarter of 2011. With an improving economy and increasing
space needs by office tenants, total vacancy is expected to continue its
downward trend through 2015. That said, over 14.5 million square feet of
office product remains vacant, ensuring tenant-favorable conditions across
most submarkets for several years. Rents are expected to increase modestly
over the next year, with the concentration of gains taking place among Class A
properties.
The economic challenges in Detroit have created significant barriers to
speculative office construction. Developers have steered clear of this market
for at least a decade and fundamentals are unlikely to justify any speculative
construction over the forecast, albeit build-to-suit activity will continue to take
place. As such, demand growth will continue to translate almost entirely into
vacancy improvements, as experienced over the last two years.
Total jobs vs. unemployment rate
Detroit
(25.0)
(15.0)
(5.0)
5.0
15.0
25.0
2011
2012
2013
2014
2015
Professional & Business Services Information Government Financial Activities
Office employment trends (12-month change)
Detroit
Office employment update
Metro Detroit . July 2015
0.0%
2.0%
4.0%
6.0%
8.0%
10.0%
12.0%
14.0%
16.0%
18.0%
0
500,000
1,000,000
1,500,000
2,000,000
2,500,000
2000 2002 2004 2006 2008 2010 2012 2014
Peak: 2,217,186 jobs
unemployment rate
total jobs
3.0%
-2,100
-100
500
2,400
3,200
5,800
7,600
9,700
9,900
14,200
-3,500 1,500 6,500 11,500 16,500
Government
Other Services
Information
Leisure & Hospitality
Financial Activities
Educational & Health Services
Trade, Transportation & Utilities
Professional & Business Services
Mining, Logging & Construction
Manufacturing
Number of Jobs
• According to the most recent estimates from the BLS, total non-farm
employment in Detroit increased to ~2.0 million payrolls, representing an
annualized increase of 51,100 jobs or 2.7 percent. Meanwhile,
unemployment decreased 2.0 percentage points year-over-year to 6.6
percent.
• Office-using employment sectors have experienced substantial
employment expansion over the last year, recording an annualized net
gain of 10,700 jobs across the metro. Employment gains were led by the
professional and business services sector, which added 9,700 jobs year-
over-year.
• Total U.S. nonfarm employment increased by 223,000 jobs in June and
downward revisions were made to previous months totaling 60,000 jobs.
Other indicators, showing wages growing slowly and jobless Americans
remaining on the sidelines, painted a grayer picture.
• Despite the 20 basis point drop in the unemployment rate, from 5.5
percent in May to 5.3 percent June, average hourly earnings stayed flat.
What had been a 2.3 percent annual growth rate in hourly earnings in
May fell to 2 percent in June, disappointing hopes that wages were finally
increasing for many workers.
5.3%U.S. unemployment
2.1%U.S. 12-month job growth
6.6%Detroit unemployment
2.7%Detroit 12-month job growth
5.5%Michigan unemployment
2.6%Michigan 12-month job growth