1. P1.8 PRELIMINARY RESULTS FROM PHASE-1 OF THE
STATISTICAL FORECASTING OF LIGHTNING CESSATION PROJECT
William P. Roeder James Ervin Glover, Ph.D.
45th Weather Squadron Oral Roberts University
Patrick Air Force Base, FL Tulsa, OK
1. INTRODUCTION
The 45th Weather Squadron (45 WS) provides
comprehensive weather services to America’s space
program at Cape Canaveral Air Force Station (CCAFS)
and NASA Kennedy Space Center (KSC) (Harms et al.,
1999). One of the most important of these services is
lightning advisories. The 45 WS lightning advisory
requirements are among the most challenging in
operational meteorology (Weems et al., 2002). Lightning
advisories are the most frequent 45 WS product. The
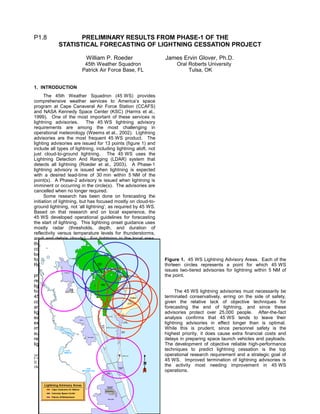
lighting advisories are issued for 13 points (figure 1) and
include all types of lightning, including lightning aloft, not
just cloud-to-ground lightning. The 45 WS uses the
Lightning Detection And Ranging (LDAR) system that
detects all lightning (Roeder et al., 2003). A Phase-1
lightning advisory is issued when lightning is expected
with a desired lead-time of 30 min within 5 NM of the
point(s). A Phase-2 advisory is issued when lightning is
imminent or occurring in the circle(s). The advisories are
cancelled when no longer required.
Some research has been done on forecasting the
initiation of lightning, but has focused mostly on cloud-to-
ground lightning, not ‘all lightning’, as required by 45 WS.
Based on that research and on local experience, the
45 WS developed operational guidelines for forecasting
the start of lightning. This lightning onset guidance uses
mostly radar (thresholds, depth, and duration of
reflectivity versus temperature levels for thunderstorms,
anvil and debris clouds). For lightning in the local area,
the onset prediction is supplemented with low altitude
convergence calculated from 41 weather towers and 31
local surface electric field mills. The 45 WS techniques
for forecasting the start of lightning are summarized in
Roeder and Pinder (1988) and Roeder et al. (2002).
Unfortunately, very little research has been done on
predicting the cessation of lightning (Hinson, 1997). As a
result, the 45 WS operational guidance for canceling
lightning advisories is not as well developed. The timing
for the last lightning flash is especially problematic. The
45 WS techniques for terminating lightning advisories
consist of waiting until the onset rules are no longer met,
and waiting some variable time after the last observed
lightning flash. The length of that time varies based on
each storm, professional subjective judgment and
experience. For decaying thunderstorms over the
immediate area, the 31 surface electric field mills also
supplement the decision to cancel the advisory. Both
research and local experience indicate that predicting
lightning cessation is exceedingly difficult.
Corresponding author: William Roeder, 45 WS/SYR, 1201 E. H. White
II St., MS 7302, Patrick AFB, FL 32925; william.roeder@patrick.af.mil
(hot link), htps://www.patrick.af.mil/45og/45ws/index.htm (hot link)
Figure 1. 45 WS Lightning Advisory Areas. Each of the
thirteen circles represents a point for which 45 WS
issues two-tiered advisories for lightning within 5 NM of
the point.
The 45 WS lightning advisories must necessarily be
terminated conservatively, erring on the side of safety,
given the relative lack of objective techniques for
forecasting the end of lightning, and since these
advisories protect over 25,000 people. After-the-fact
analysis confirms that 45 WS tends to leave their
lightning advisories in effect longer than is optimal.
While this is prudent, since personnel safety is the
highest priority, it does cause extra financial costs and
delays in preparing space launch vehicles and payloads.
The development of objective reliable high-performance
techniques to predict lightning cessation is the top
operational research requirement and a strategic goal of
45 WS. Improved termination of lightning advisories is
the activity most needing improvement in 45 WS
operations.
2. 2. THE STATISTICAL FORECASTING OF
LIGHTNING CESSATION PROJECT
The 45 WS teamed with KSC to begin a new
research project to improve forecasting of lightning
cessation. The ‘Statistical Forecasting Of Lightning
Cessation’ project was funded under the NASA Faculty
Fellowship Program (www.nasa.gov/audience/
foreducators/postsecondary/grants/NFFP.html (hot
link)). This project brought Dr. Glover from the
department of computer sciences and mathematics at
Oral Roberts University to CCAFS/KSC for 9 weeks
during the summer of 2004 to conduct this research.
The purpose of this project is to develop
techniques that are highly focused on helping the
operational forecaster. The forecaster can usually
easily identify when thunderstorms are decaying based
on radar and lightning flash rate. If several minutes
have passed since the last flash, the forecaster is faced
with the challenge to decide if that was actually the last
flash and the advisory can be cancelled, or how likely is
another lightning flash. This forecaster mindset
inspired the statistical approach for this project and
suggested two methodologies.
The first methodology is to develop climatology for
the distribution of times between the last and second-
last flash. Given some low operationally determined
probability of acceptable risk, this distribution of times
between last-2nd last lightning flashes could be
integrated for guidance on how long to wait in general
before canceling lightning advisories. After all, the first
step in most forecast processes is climatology, but
climatology for terminating lightning advisories did not
exist. While far from a final solution, the low risk,
speed of development, and initial utility made this a
worthwhile goal of this project.
The second methodology is to determine if a
specific family of curve can model the slowing lightning
flash in decaying thunderstorms in general. Then find
the best fit of that family of curves to the flash rate in
an individual decaying thunderstorm. Finally, integrate
that best fit curve to find the time when the probability
of no more lightning drops below the operationally
acceptable threshold. This second methodology was
considered high-risk, given the extreme technical
difficulty in forecasting the end of lightning and that the
proposed approach is purely statistical with no explicit
meteorological science. This second methodology was
also considered potentially high-return, since it might
deliver a large leap forward to 45 WS capability.
2.1 Phase-1 Design
The first phase of this project was considered a
proof-of-concept to answer two main questions:
1) could a good curve be found for the distribution of
times between last and 2nd last lightning flashes from
many thunderstorms, and 2) did the concept of a decay
curve to lightning flash rate in individual thunderstorms
to predict the probability of another lightning flash have
any validity. Because this phase of the project was
considered proof-of-concept, and given the short time
the summer visiting scientist was available (9 weeks),
this preliminary research was restricted to only cloud-
to-ground lightning. The lightning data were easily
available from the Cloud-to-Ground Lightning
Surveillance System (CGLSS) database (Roeder et al.,
2005). The ‘all lightning’ data are also available from
LDAR archive, but are very difficult to use quickly due
to the shear volume of data (hundreds of step leaders
per flash) and the tabular 4-D data format. Without a
visualization tool, determining which step leader points
go with which flash, and which flashes go with which
thunderstorm, can not be determined quickly. The
CGLSS is a local system, similar to the National
Lightning Detection Network, but with better
performance (Boyd et al., 2005). Because this phase
of the project did not analyze ‘all lightning’, the results
are not immediately useful for 45 WS lightning
advisories.
The 45 WS is interested in research to convert the
LDAR step leader archive into a lightning flash
database. An optimized ‘step leader to lightning flash’
conversion algorithm is needed. A simple algorithm for
this already exists, but there is considerable room for
improvement (McNamara, 2002). A ‘thunderstorm-ID
assignment’ algorithm is also required and would
presumably be based on clustering the flash starting
points in x-y location and time, with perhaps some
weak cluster in z-location. Considering the time series
of flash rate and morphology of flash might allow
automatic identification of the lightning cloud
classification: thunderstorm, anvil, or debris cloud
lightning. These algorithms could be applied to the 10+
years of LDAR step leader observations to create a
much easier to use lightning flash database. This
LDAR flash database would facilitate many lightning
research projects, including future phases of the
‘statistical forecasting of lightning cessation’ project.
Phase-1 analyzed 58 thunderstorms near
CCAFS/KSC, which were sampled from five convective
seasons during the summer convective season (May-
Sep) as shown in Table-1 and Table-2. This was done
to avoid any seasonal or monthly biases in the results.
The timeline of flashes from one storm is shown in
figure 2. Such timelines were part of the inspiration for
this project, since anecdotally some sort of decay curve
seemed to apply. Likely candidates for the decay curve
included negative exponential, Poisson, log-linear, etc.
The 58 storms were used to create a 59th composite
“thunderstorm” that represents the average behavior of
all the storms.
Table 1.
58 thunderstorms analyzed during Phase-1 of this
project by season (May-Sep)
YEAR NUMBER OF THUNDERSTORMS
1999 12 (May: 2, Jun: 2, Jul: 2, Aug: 4, Sep: 2)
2000 13 (May: 0, Jun: 4, Jul: 6, Aug: 1, Sep: 2)
2001 14 (May: 0, Jun: 5, Jul: 3, Aug: 5, Sep: 1)
2002 7 (May: 0, Jun: 1, Jul: 2, Aug: 4, Sep: 0)
2003 12 (May: 0, Jun: 2, Jul: 3, Aug: 7, Sep: 0)
Table 2.
58 thunderstorms analyzed during Phase-1 of this
project by Month (May-Sep)
3. YEAR NUMBER OF THUNDERSTORMS
May 2
Jun 14
Jul 16
Aug 21
Sep 5
Figure 2. Timeline from one thunderstorm.
The 58 cases were actually all cloud-to-ground
lightning observed in a ± 10 NM box centered on
CCAFS/KSC. Therefore, flashes from more than one
thunderstorm might have been included, although the
person providing that cases tried to provide only
isolated thunderstorms in the sample box, so this was
not likely a significant problem. Likewise, flashes from
thunderstorms moving into and out of the sample box
could have contaminated the analysis, e.g. a storm of
constant activity could appear to be decaying as it
moves out of the sample box. However, again the
person providing the cases tried to provide
thunderstorms centered in box. Given that most of our
thunderstorms are organized on relatively slow moving
sea-breeze fronts, this centering of the data led this to
not be considered a significant problem either. These
compromises in sampling were required due to the
short time the visiting scientist was available (9 weeks)
and the lack of appropriate software for visualizing
saved CGLSS lightning data at 45 WS. The
thunderstorms sampled tended to be more active
storms with above average lighting flash rates, though
they were still mostly pulse thunderstorms on sea
breeze fronts and other boundary interactions, as
opposed to extremely lightning active squall lines. This
was needed to provide enough flashes during the
decaying part of the thunderstorm lifecycle to allow for
effective curve fitting. This was a sample bias for
which compensation could not be applied. However,
the authors know of no reason why above average
lightning storms should behave significantly different
from other pulse more typical thunderstorms during
their decay phases, so this may not be a significant
problem either.
2.2 Phase-1 Results
Phase-1 of this project was a proof-of-concept
effort to determine the promise of a statistical approach
to forecasting lightning cessation. Phase-1 was
successful and further development under future
phases is justified.
2.2.1. Climatological distribution of times between last
and 2nd to last lightning flashes:
The time differences between the last and 2nd last
lightning flash were used to create a probability density
function of the time differences (figure 3). Several
standard statistical curves were fit to this probability
density function. The best fit was a log-linear curve,
with the following coefficients and constants,
P(∆t) = -0.0469 Ln(∆t) + 0.1493, where ∆t is the time
difference between last and 2nd last flash and P(∆t) is
it’s probability density function. This best fit curve
yielded a correlation coefficient of 0.8665, so that 75%
of the variation is explained by the log-linear curve
(r2
= 0.7509). Since the logarithmic function tends to
produce a more linear result than the original curve, a
Z-Score of Ln(∆t) was used to check if the log-linear fit
was appropriate. As shown in figure 4, the Z-Score is
very linear, with a correlation coefficient of 0.9985, so
that 99.7% of the variance is explained by the log-linear
curve (r2
= 0.997). Therefore, the log-linear fit is
accepted as reasonable.
If a similar curve had been fit to for ‘all lightning’,
such as from the LDAR sensor, then a climatological
tool for canceling 45 WS lightning advisories could be
created. Integrating the probability density function
from various times to infinity would produce a table of
recommended times to wait after the last observed
flash to achieve various probabilities of another flash
occurring. A hypothetical example is shown in Table 3.
Alternatively, if a specific probability of another flash is
required for a specific operation, that time to wait after
the last observed flash could also be calculated.
Figure 3. Probability density function of the times
between last and 2nd last lightning flashes.
4. Figure 4. Z-Score of Ln(∆t), which helps confirm that
the log-linear curve, is a reasonable fit.
Table 3.
Hypothetical example of climatological tool for
canceling lightning advisories (not for operational use!)
% PROBABILITY OF
ANOTHER FLASH
AVERAGE TIME
25% 10 min
10% 15 min
5% 20 min
1% 25 min
0.1% 50 min
2.2.2. Curve fitting of lightning flash rates in decaying
thunderstorms:
Several standard statistical curves were fit to the
decaying lighting rate in the composite thunderstorm,
which represents the average behavior of the 58
individual thunderstorms in this analysis. The log-
linear equation again provided the best fit curve with
the following parameterization,
P(t) = -0.2821 Ln(t) + 1.5115 (figure 5). The coefficient
of regression was 0.8977, which explained 81% of the
variation (r2
= 0.8058). A linear fit with a slope of
-0.0102 and intercept of 0.998 provided a better fit
(r2
= 0.9999), but the log-linear fit is preferred since this
curve was one of the curves expected a priori, and
agrees with the best fit curve to the entire composite
thunderstorm lifecycle (P(t) = -0.3085 Ln(t) + 1.7599,
r2
= 0.8642). The linear fit having a higher correlation
coefficient may be an artifact of identifying the start of
the decay phase of the composite thunderstorm too
late in the lifecycle. An example of a best-fit curve to
the decaying flash rate from an individual thunderstorm
is shown in figure 6. In this case, a negative
exponential was the best-fit curve; P(flash rate) =
0.8551e-0.5876(t)
. This equation yielded a correlation
coefficient of r = 0.9839, which explains 97% of the
variance (r2
= 0.9681). This is consistent with the
recent research on decaying flash rates of ‘all lightning’
in Dallas, TX (Holle and Murphy, 2003). If similar
curves were fit to the decaying flash rate of ‘all
lightning’ from a thunderstorm in real time, the
integration of the equation could help predict the time
when the probability of another flash would fall below
some low operational threshold.
Survivability of Strike Rates for the Composite
Storm (Decay Phase)
y = -0.2821Ln(x) + 1.5115
R
2
= 0.8058
-0.5
0
0.5
1
1.5
2
0 50 100 150
Time ( t+121) Minutes
Reliability(t+121)
Series1
Log. (Series1)
Linear (Series1)
Figure 5. Probability density function of the times
between last and 2nd last lightning flash from the 58
thunderstorms in this analysis and the best-fit curve.
Figure 6. Probability density function and best-fit
curve for an individual thunderstorm.
2.3 Future Phases
Phase-1 indicated that statistical forecasting of
lightning cessation has promise and further
development is justified. If funding is approved,
Phase-2 and Phase-3 might be done during the
summer of 2005 and the summer 2006, respectively.
2.3.1. Phase-2 Proposal:
Phase-2 would repeat the work of Phase-1 but
using ‘all lightning’ from the LDAR sensor, rather than
just cloud-to-ground lightning. Climatology for the
distribution of time differences between last and 2nd
last lightning flashes for ‘all lightning’ would be built.
Since the climatology would be based on ‘all lightning’,
matching 45 WS lightning advisory procedures, this
climatology might be used immediately as guidance in
ending lightning advisories operationally. Also, curve
fitting to the ‘all lightning’ flash rate from decaying
individual thunderstorms would be explored. The
potential sampling shortfalls discussed previously
would be explicitly avoided to ensure that all lightning
would be recorded throughout the decaying lifecycle
from only one thunderstorm. Verification against
independent data would also be accomplished. Finally,
estimation of the performance of the curve fitting
approach in the real world would begin. Lightning
flashes from individual decaying thunderstorms would
5. be used to update the best-fit curve for each flash and
integrated to estimate the timing for various
probabilities of last flash, which would be verified
against the actual last flashes. The average
performance of the climatological and curve fitting
methods would be compared against average
performance of the 45 WS termination of advisories,
especially as regards safely terminating the advisories
sooner.
2.3.2. Phase-3 Proposal:
If justified by Phase-2 results, Phase-3 would
enlarge the sample size of the climatology and curve
fitting approach for ‘all lightning’. In addition, the
performance verification on independent data would be
extended and completed. A performance comparison
would be conducted between the climatological and
curve fitting methods and 45 WS termination of
lightning advisories on a sample of independent
thunderstorms. Finally, a proposal for future research
and preliminary design would be drafted to support the
long-range goal of automated guidance for forecasting
lightning cessation and terminating 45 WS lightning
advisories.
3. LONG RANGE GOAL
The long-range goal is to create a system that
would provide automated guidance on which
thunderstorms are decaying, the expected time for the
probability of another flash to drop below some low
operational threshold, and flag storms that have
already fallen below that operational threshold. Such
an automated system would need an ‘all lightning’
detection system, such as LDAR. Special post-
processing software would also be required. The first
function of this post-processing software would be to
assign each lightning flash to a specific thunderstorm,
presumably via a statistical cluster algorithm operating
on the x-y location, time, and to a lesser degree ‘z’
location of the starting point of the lightning flashes.
The second function of the post-processing software
would be to identify when thunderstorms start
decaying, presumably through a simple analysis of a
smoothed time-series of flash rate from individual
thunderstorms. Finally, the post-processing software
would calculate the best-fit coefficients for the
appropriate family of curve for each thunderstorm and
calculate when the integration of that best fit equation
would suggest that the probability of another flash
reaches a low operational threshold. As each flash
occurs, the best fit coefficients of the curve and a new
integration would be recalculated to update the timing
guidance. Even more advanced systems could
combine data from radar and electric field mills for
even better lightning cessation guidance.
Automated guidance on lightning cessation will not
be available for many years. In the meantime, interim
techniques on how to cancel lightning advisories is
required by 45 WS, such as climatology of the
distribution of times between last and 2nd last flashes
from all lightning.
4. SUMMARY
The 45 WS needs to terminate their lightning
advisories sooner without compromising safety.
Unfortunately, the lack of research on this topic makes
improving the forecasting of lightning cessation very
difficult. A preliminary examination of a new statistical
approach was performed during summer 2004. Initial
results were encouraging and further research on this
statistical approach is justified.
Acknowledgments: The NASA Faculty Fellowship Program
funded this research. Mr. Weems of 45 WS was instrumental in
providing lightning cases studies from the CGLSS database.
The Applied Meteorology Unit provided office space and use of a
personal computer, technical advice from Dr. Short and
Dr. Bauman, and office hardware and software assistance from
Mr. Case. Dr. Merceret of the KSC Weather Office provided
technical advice and mentoring on effective communication. This
research would not have been possible without the support for
operational research from Colonel LaFebre, 45 WS Commander,
and previous 45 WS commanders.
REFERENCES
Boyd, B. F., W. P. Roeder, D. L. Hajek, and M. B. Wilson,
2005: Installation, Upgrade, And Use Of A Short
Baseline Cloud-To-Ground Lightning Surveillance
System In Support Of Space Launch Operations,
Conference on Meteorological Applications of Lightning
Data, 9-13 Jan 05, 4 pp.
Harms, D. E., A. A. Guiffrida, B. F. Boyd, L. H. Gross, G.
D. Strohm, R. M. Lucci, J. W. Weems, E. D. Priselac, K.
Lammers, H. C. Herring and F. J. Merceret, 1999: The
Many Lives Of A Meteorologist In Support Of Space
Launch, 8th Conference On Aviation, Range, And
Aerospace Meteorology, 10-15 Jan 99, Dallas, TX, 5-9
Hinson, M. S., 1997: A Study Of The Characteristics Of
Thunderstorm Cessation At The NASA Kennedy Space
Center, M.S. Thesis, Aug 97, Texas A&M University,
91 pp.
Holle, R. L., M. L. Murphy, Martin, and R. E. Lopez, 2003:
Distances and Times Between Cloud-to-Ground Flashes
in a Storm, International Conference on Lightning and
Static Electricity, 16-18 Sep 03, 6 pp.
Roeder, W.P., J. W. Weems, and P. B. Wahner, 2005:
Applications Of The Cloud-To-Ground Lightning
Surveillance System Database, Conference on
Meteorological Applications of Lightning Data,
9-13 Jan 05, 5 pp.
7.3 METEOROLOGICAL AND OCEANIC
INSTRUMENTATION AT SPACEPORT
FLORIDA – OPPORTUNITIES FOR
COASTAL RESEARCH
USE OF WEATHER RADAR
TO SUPPORT
AMERICA’S SPACE PROGRAM -- PAST, PRESENT,
AND FUTURE
Roeder, W. P., D. L. Hajek, F. C. Flinn, G. A. Maul, M. E.
Fitzpatrick, 2003: Meteorological And Oceanic
Instrumentation At Spaceport Florida – Opportunities
For Coastal Research, 5th Conference on Coastal and
Atmospheric Prediction and Processes, 6-8 Aug 03, 132-
137
Roeder, W. P., S. C. Jacobs, J. E. Sardonia, J. W. Weems,
and C. S. Pinder, 2002: Computer Based Training For
6. Lightning Warnings At 45th Weather Squadron, 10th
Conference on Aviation, Range, and Aerospace
Meteorology, 13-16 May 02, 285-288
Roeder, W. P., and C. S. Pinder, 1998: Lightning
Forecasting Empirical Techniques For Central Florida In
Support Of America’s Space Program, 16th Conference
on Weather Analysis and Forecasting, 11-16 Jan 98, 475-
477
Weems, J.W., C. S. Pinder, W. P. Roeder, and B. F. Boyd,
2001: Lightning Watch And Warning Support To
Spacelift Operations, 18th Conference on Weather
Analysis and Forecasting, 30 Jul-2 Aug 01, 301-305
7. Lightning Warnings At 45th Weather Squadron, 10th
Conference on Aviation, Range, and Aerospace
Meteorology, 13-16 May 02, 285-288
Roeder, W. P., and C. S. Pinder, 1998: Lightning
Forecasting Empirical Techniques For Central Florida In
Support Of America’s Space Program, 16th Conference
on Weather Analysis and Forecasting, 11-16 Jan 98, 475-
477
Weems, J.W., C. S. Pinder, W. P. Roeder, and B. F. Boyd,
2001: Lightning Watch And Warning Support To
Spacelift Operations, 18th Conference on Weather
Analysis and Forecasting, 30 Jul-2 Aug 01, 301-305