From sample-to-spray: high performance workflow for top down protein analysis
•
0 likes•47 views

A new workflow for obtaining high-quality mass spectrometric data on intact proteins from complex biological samples has been developed.

Recommended
Recommended
More Related Content
What's hot
What's hot (20)
Similar to From sample-to-spray: high performance workflow for top down protein analysis
Similar to From sample-to-spray: high performance workflow for top down protein analysis (20)
More from Expedeon
More from Expedeon (20)
Recently uploaded
Recently uploaded (20)
From sample-to-spray: high performance workflow for top down protein analysis
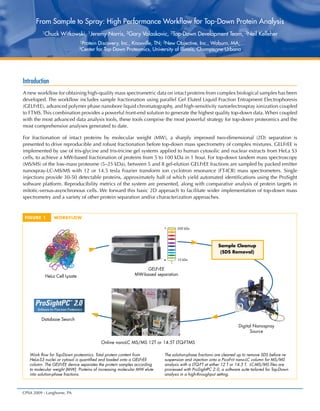
- 1. CPSA 2009 - Langhorne, PA From Sample to Spray: High Performance Workflow for Top-Down Protein Analysis 1Chuck Witkowski, 1Jeremy Norris, 2Gary Valaskovic, 3Top-Down Development Team, 3Neil Kelleher 1Protein Discovery, Inc., Knoxville, TN; 2New Objective, Inc., Woburn, MA; 3Center for Top-Down Proteomics, University of Illinois, Champagne-Urbana Introduction A new workflow for obtaining high-quality mass spectrometric data on intact proteins from complex biological samples has been developed. The workflow includes sample fractionation using parallel Gel Eluted Liquid Fraction Entrapment Electrophoresis (GELFrEE), advanced polymer phase nanobore liquid chromatography, and high-sensitivity nanoelectrospray ionization coupled to FTMS.This combination provides a powerful front-end solution to generate the highest quality top-down data. When coupled with the most advanced data analysis tools, these tools comprise the most powerful strategy for top-down proteomics and the most comprehensive analyses generated to date. For fractionation of intact proteins by molecular weight (MW), a sharply improved two-dimensional (2D) separation is presented to drive reproducible and robust fractionation before top-down mass spectrometry of complex mixtures. GELFrEE is implemented by use of tris-glycine and tris-tricine gel systems applied to human cytosolic and nuclear extracts from HeLa S3 cells, to achieve a MW-based fractionation of proteins from 5 to 100 kDa in 1 hour. For top-down tandem mass spectroscopy (MS/MS) of the low-mass proteome (5–25 kDa), between 5 and 8 gel-elution GELFrEE fractions are sampled by packed emitter nanospray-LC-MS/MS with 12 or 14.5 tesla Fourier transform ion cyclotron resonance (FT-ICR) mass spectrometers. Single injections provide 30-50 detectable proteins, approximately half of which yield automated identifications using the ProSight software platform. Reproducibility metrics of the system are presented, along with comparative analysis of protein targets in mitotic-versus-asynchronous cells. We forward this basic 2D approach to facilitate wider implementation of top-down mass spectrometry and a variety of other protein separation and/or characterization approaches. FIGURE 1 WORKFLOW HeLa Cell Lysate Digital Nanospray Source Online nanoLC MS/MS 12T or 14.5T LTQ-FTMS Database Search GELFrEE MW-based separation 200 kDa– 10 kDa+ Sample Cleanup (SDS Removal) The solution-phase fractions are cleaned up to remove SDS before re- suspension and injection onto a PicoFrit nano-LC column for MS/MS analysis with a LTQ-FT at either 12 T or 14.5 T. LC-MS/MS files are processed with ProSightPC 2.0, a software suite tailored for Top-Down analysis in a high-throughput setting. Work flow for Top-Down proteomics. Total protein content from HeLa-S3 nuclei or cytosol is quantified and loaded onto a GELFrEE column. The GELFrEE device separates the protein samples according to molecular weight (MW). Proteins of increasing molecular MW elute into solution-phase fractions.
- 2. 2CPSA 2009 - Langhorne, PA From Sample to Spray: High Performance Workflow for Top-Down Protein Analysis Methods & Materials Samples • Protein Standards (Sigma) in 0.2% formic acid • Cytosolic lysate, undigested, reduced, alkylated from in- house cell culture of HeLa S3 (ATCC) cell line GELFrEE • Programmable electrophoretic controller and 8 channel GELFrEE cartridges (Protein Discovery) • 100 µL aliquot of lysate, loaded (0.1% SDS) • 16 fractions (150 µL each), collected over 1 hour • Aliquots from each fraction were characterized by 1D SDS-PAGE • SDS removal (post GELFrEE) • Protein precipitation (cold acetone) of each fraction followed by centrifucation of pellet • Re-suspension in 40 µL of 5% ACN, 0.2% formic acid HPLC • 1D-plus NanoLC (Eksigent) • A=5% ACN, 0.2% formic acid; B= 95% ACN, 0.2% formic acid • 300 nL/min. Gradient: 20% B @ 10 min., 60% B @ 45 min., 95% B @ 55 min. • 10 µL autosampler injection • PicoFrit packed-emitter column (New Objective) • Porous polymer media (5 µm, 300 or 1,000 A), 75 µm ID x 10 cm • 15 µm ID emitter Mass Spectrometry • LTQ-FT Ultra (Thermo Fisher) with 12 tesla magnet • “Low-high” format; full scan acquisition in linear trap, data dependant (top two) MS/MS acquired at high resolution (180,000 RP). Dynamic exclusion with a repeat count of 1, set for 5,000 sec. • Digital PicoView nanospray source (New Objective) • Automated emitter rinsing between LC runs • ESI voltage: 2.5 - 2.8 kV typical Data Analysis • ProSight PC 2.0 (Thermo Fisher) • 10 Dalton precursor window • 10 ppm fragment mass tolerance FIGURE 2 FIGURE 3 Analytical slab gel and heat map showing masses detected in GELFrEE fractions. The silver-stained slab gel (top) of solution phase GELFrEE fractions shows typical GELFrEE separation (tris-tricine buffer system). After LC-MS of the GELFrEE fractions, the detected masses for each fraction are plotted as a function of LC retention time (bottom). The MS relative abundance is designated with the scale on the right. General correlation can be seen between detected masses and abundances from the MS and the intensities of protein bands detected on the slab gel. 1 10 15 37 20 25 2 3 4 5 6 7 8 9 GELFrEE Fraction # (kDa) 23 37 5 (kDa) 0.5 0 1 1.5 Relative Abundance (107 NL) 2 B A Tris-tricine and tris-glycine GELFrEE runs displayed via slab gels. In A, a slab gel visualization of a tris-tricineGELFrEE fractionation (400 µg loaded) is displayed. In B, a slab gel visualization of a tris-glycineGELFrEE fractionation (200 mg loaded) is shown. The tris-tricine run shows a larger number of fractions at lower molecular weight. The samples were nuclear lysates from HeLa-S3 cells.
- 3. 3CPSA 2009 - Langhorne, PA From Sample to Spray: High Performance Workflow for Top-Down Protein Analysis FIGURE 4 FIGURE 6 FIGURE 5 Chromatographic performance of C4 and Polymer packed PicoFrit columns for intact protein analysis. A) Chromatograms for RPLC separation of a seven protein standards mixture of varying concentrations, using C4 (blue) and Polymer (red) (75 um I. D. x 100 mm, 300 A, 5 um stationary phase) PicoFrit columns. Standards used were: 1. Ubiquitin; 2. Cytochrome c; 3. ß-lactalbumin; 4. Myoglobin; 5. ß-casein; 6. Carbonic Anhydrase; 7. Ovalbumin. Total protein load is shown. Examples selected from an LC-MS/MS injection of fraction #3 from a tris-glycine GELFrEE run. A base-peak chromatogram is shown (A), with charge state distributions from selected retention times shown in B. In panel C, abundant charge states (above the arrows) were targeted for fragmentation. Fragmentation mass spectra for each protein are shown along with the corresponding identifications and E-values. A fragmentation map (D) results from the matching fragment ions of nucleoside diphosphate kinase B. The protein is N-terminally acetylated. A B C D A representative LC-MS/MS run generated from data- dependent (top 2) acquisition. The sample infused was GELFrEE fraction #5 from fractionation of a HeLa nuclear lysate. Data were from a 12 tesla LTQ FT instrument, with identifications resulting from ProSightPC 2.0. All identified proteins are shown in Table 1 (Figure 7). Acknowledgements The laboratory of NLK was supported by the Packard Foundation, the Sloan Foundation, the National Institutes of Health (GM-067193-07), the UIUC Neuroproteomics Center on Cell-Cell Signaling, and the National Institute on Drug Abuse (P30 DA-018310-06)
- 4. 4CPSA 2009 - Langhorne, PA From Sample to Spray: High Performance Workflow for Top-Down Protein Analysis FIGURE 8 © 2009 New Objective, Inc. All rights reserved. All trademarks and registered trademarks are properties of their respective companies. Conclusions • For fractionation of intact proteins, GELFrEE is robust and general • GELFrEE enables high loading capacity and a fast (1 hr.) fractionation of complex samples • Polymer media, packed-emitter nanobore columns offer high performance separations of the low MW proteome (<25 kD) • 30-50 distinct protein forms are observed in a single LC- MS/MS run • ProSight PC 2.0 enables the automated identification of intact proteins, including the determination of post- translational modifications • Extension of LC to higher mass proteins is under development FIGURE 7 Originally published at the 2009 Chemical and Pharmaceutical Structure Analysis Symposium in Langhorne, PA Proteins identified from the run shown in Figure 6. Migration-inducing protein 12 40S ribosomal protein S30 Metallothionein-2 Small EDRK-rich factor 2 Coiled-coil domain-containing protein 72 40S ribosomal protein S28 60S ribosomal protein L38 Oncogene DJ-1 (fragment) Ubiquitin (fragment) GAPDH (fragment) 1-AGP acyltransferase 2 (fragment) ATPase inhibitory factor 1 (fragment) S100 calcium-binding protein A6 U6 snRNA-associated SM-like protein LSm8 Dynein-associated protein Km23 Heat shock 10-kDa protein S100 calcium-binding protein A13 S100 calcium-binding protein A11 S100 calcium-binding protein A16 SUMO-1 specific protease 2 (fragment) S100 calcium-binding protein A4 Thioredoxin Glutaredoxin-1 Phenylpyruvatetautomerase MIF protein 4933.5 6643.9 6932.6 6953.6 6972.9 7935.2 8138.7 8264.3 8845.6 8855.6 9252.8 9510.9 10,141.3 10,307.3 10,825.7 10,835.7 11,375.1 11,757.8 11,761.0 11,785.7 11,794.7 11,883.8 11,964.3 12,508.2 12,538.3 4933.5 6643.8 7046.6 6937.7 6972.9 7935.2 8138.7 8264.3 8845.6 8855.6 9252.8 9510.9 10,141.3 10,307.3 10,825.7 10,835.8 11,375.1 11,757.8 11,762.0 11,785.2 11,859.8 11,883.8 11,964.3 12,508.2 12,551.2 0.2 0.1 N/A* N/A* -1.1 0.3 -4.5 -0.6 0.7 0.5 11.2 0.5 1.4 0.8 1.1 -5.7 0.6 1.3 12.3 32.3 N/A* -0.5 1.0 1.3 N/A* 32 27 16 9 13 29 8 8 61 13 9 16 10 44 10 79 22 29 21 5 9 11 15 25 8 360 334 183 60 205 453 74 95 952 159 60 87 95 797 125 1035 277 167 317 52 53 150 132 335 50 1 x 10-35 4 x 10-34 5 x 10-19 1 x 10⁻⁶ 3 x 10-21 5 x 10-46 4 x 10⁻⁸ 3 x 10⁻¹⁰ 6 x 10-96 9 x 10-16 1 x 10⁻⁶ 2 x 10⁻⁹ 3 x 10⁻¹⁰ 2 x 10-79 3 x 10-13 3 x 10-104 2 x 10-28 2 x 10-17 2 x 10-32 6 x 10⁻⁶ 5 x 10⁻⁶ 1 x 10-15 6 x 10-14 3 x 10-34 1 x 10⁻⁵ N-terminal acetylation N-terminal acetylation N-terminal acetylation N-terminal acetylation N-terminal acetylation N-terminal acetylation N-terminal acetylation N-terminal acetylation N-terminal acetylation N-terminal acetylation N-terminal acetylation N-terminal acetylation N-terminal acetylation Methylation Methylation Observed Mass (Da) Calculated Mass (Da) Mass Difference (ppm) PTMs Matching Fragments E-value -10 x log (E-value)Protein Description * The observed protein forms were not present in the database; therefore, large mass discrepencies exist between the observed and calculated forms LC-MS reproducibility. Base-peak chromatograms from technical triplicate GELFrEE-LC-MS injections are shown in A. The largest peaks have been colorized to highlight reproducibility. The intact protein detected at retention time ~30 min is shown for each injection in panel B. Similar charge state distributions are observed for the protein in each injection. A Venn diagram (not to scale) showing overlap of distinct detected masses is presented in C. A B C