Download as PDF, PPTX
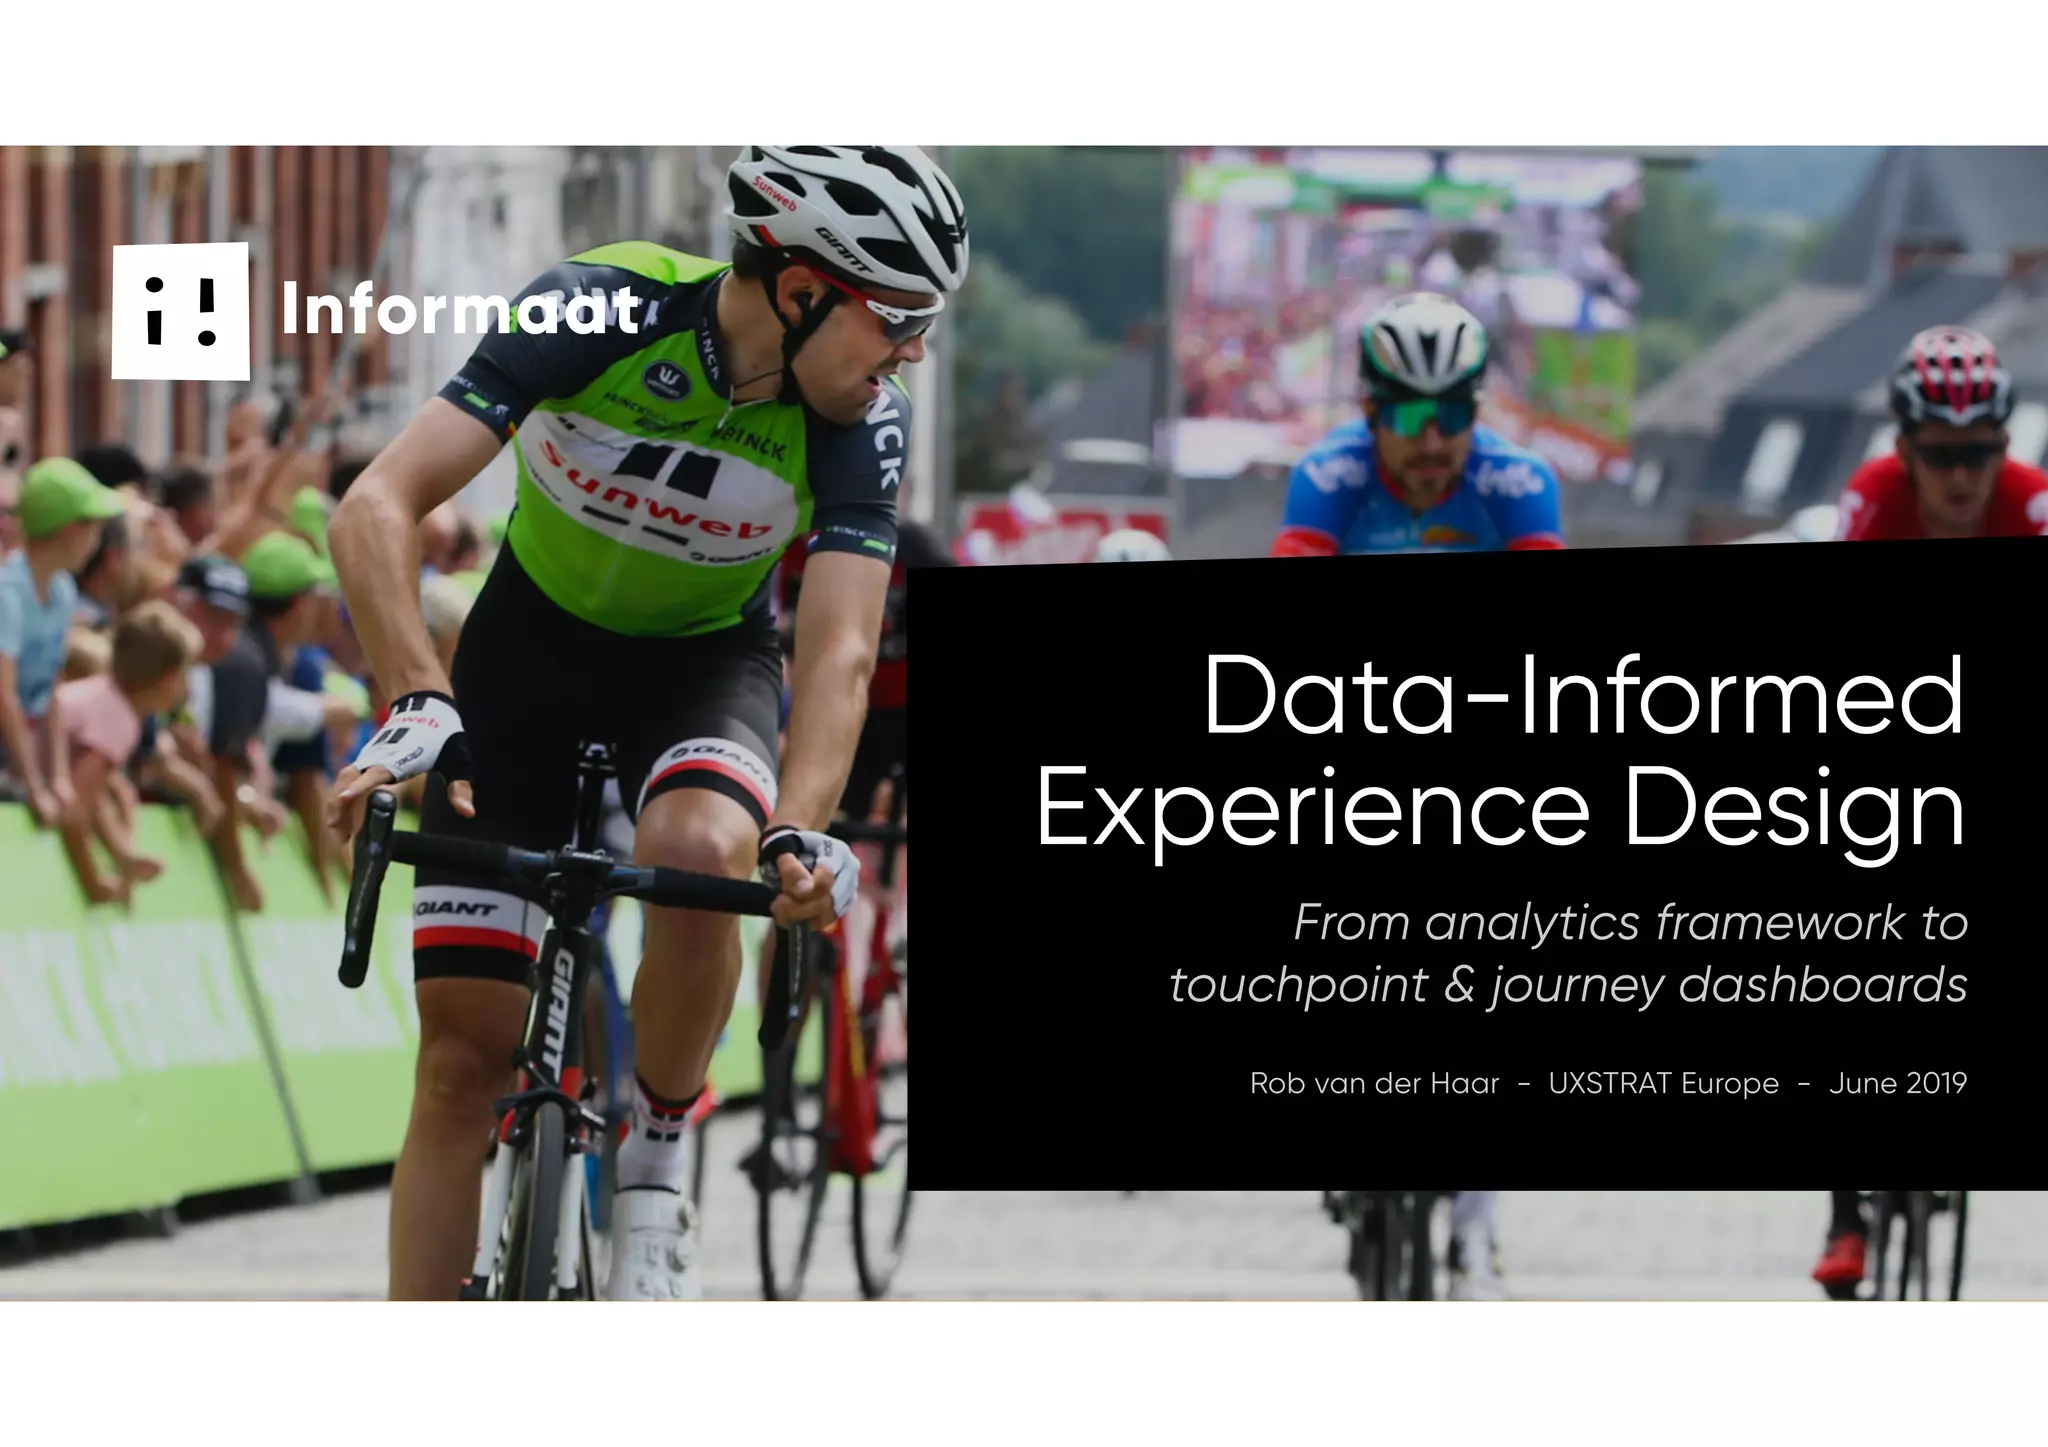
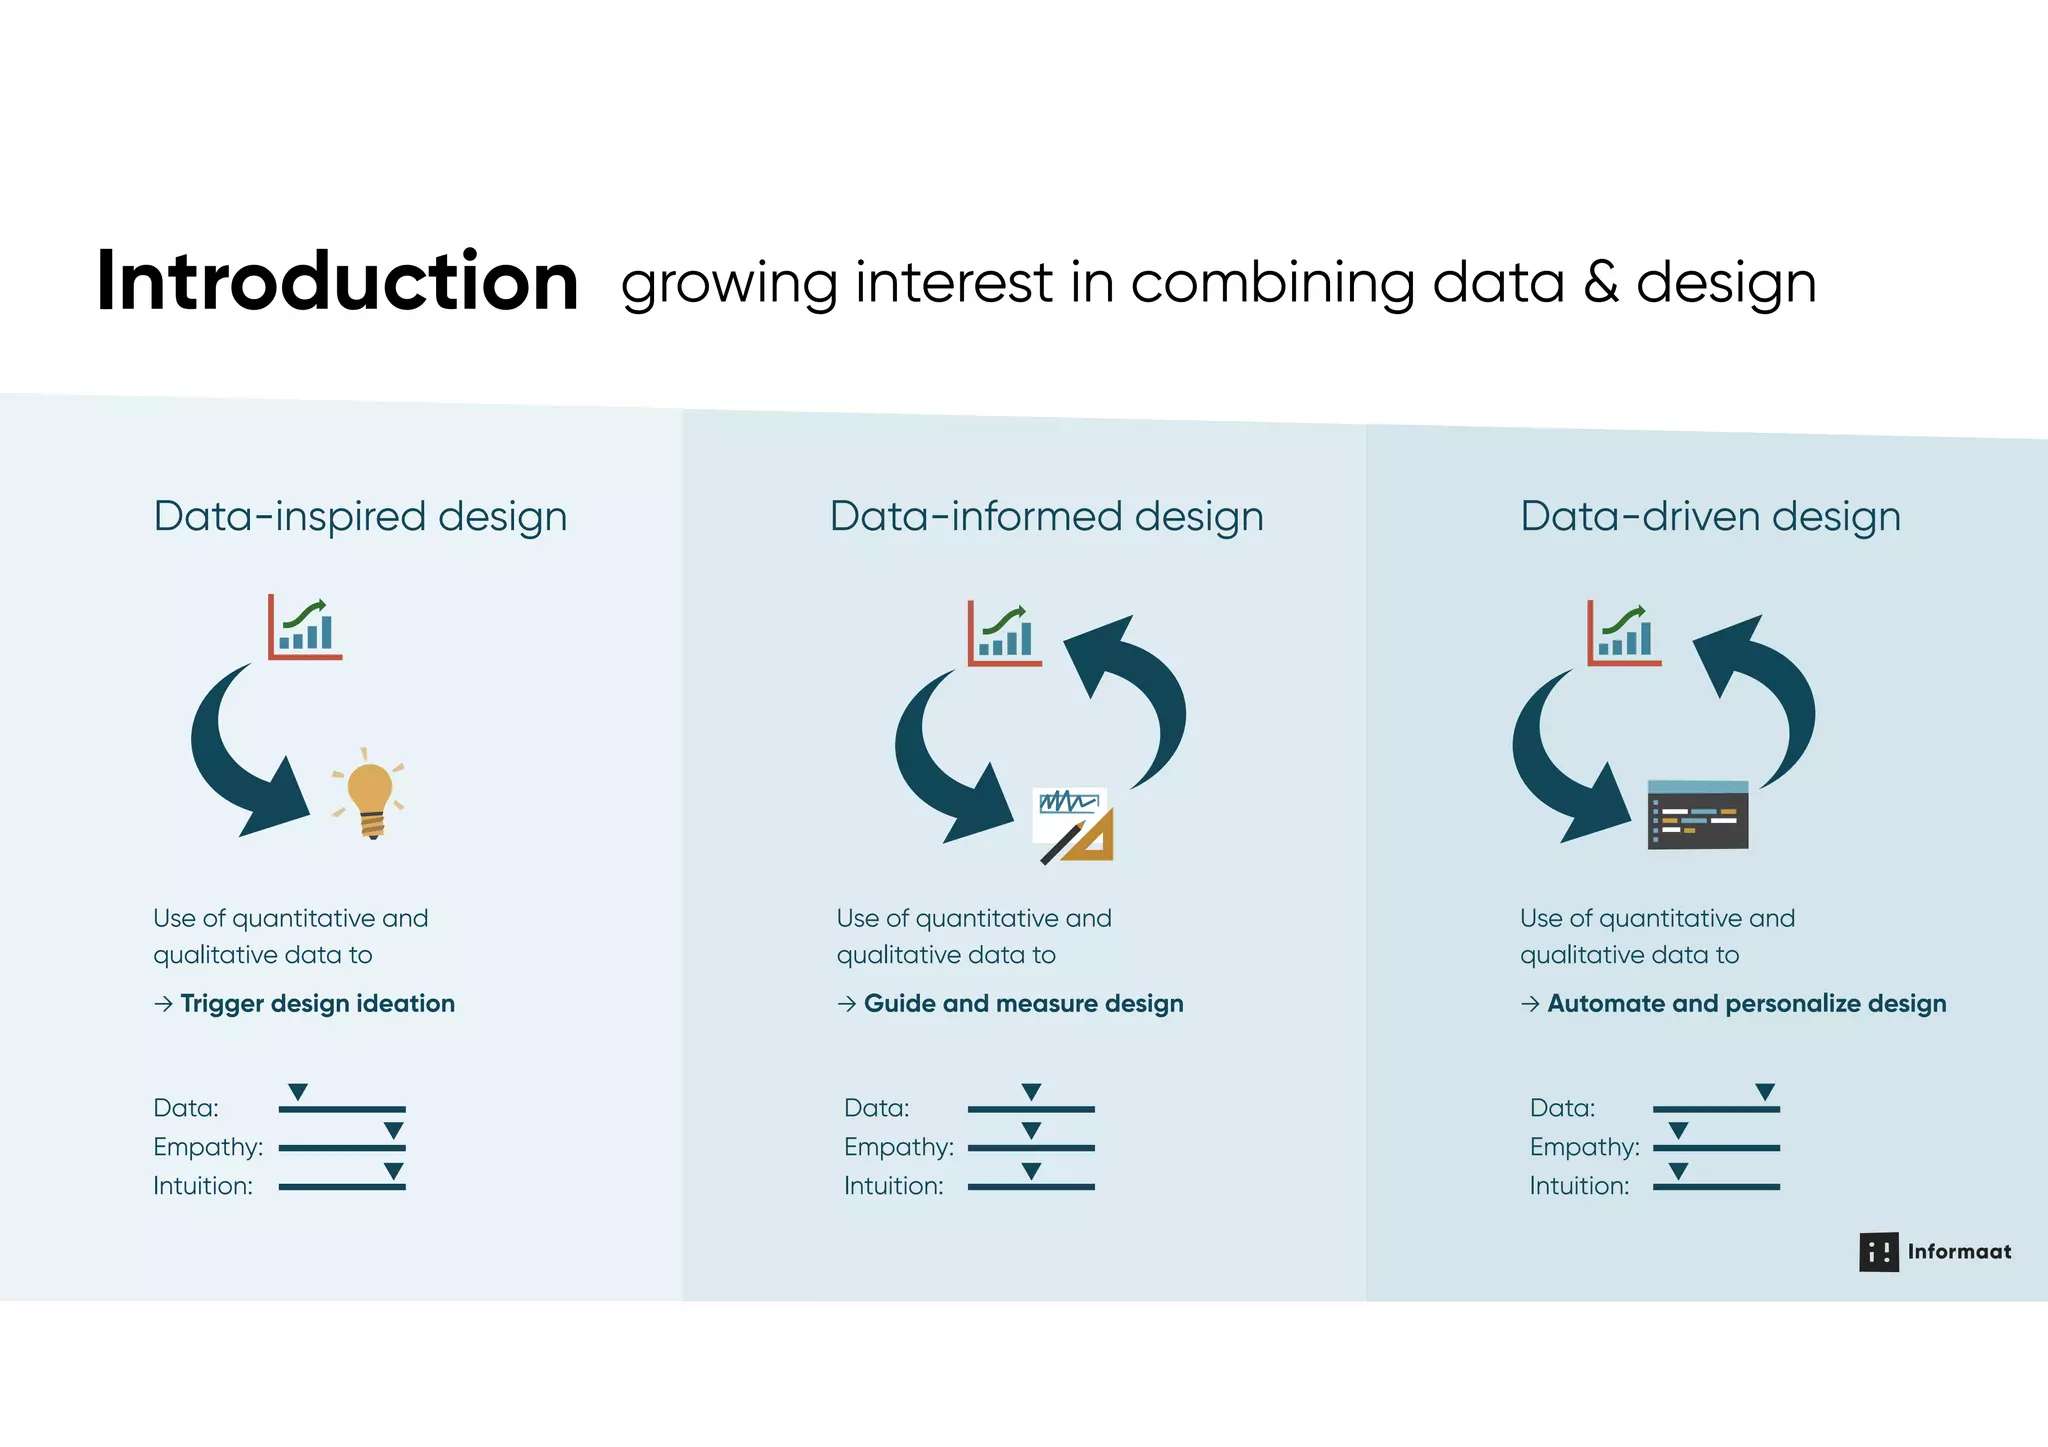
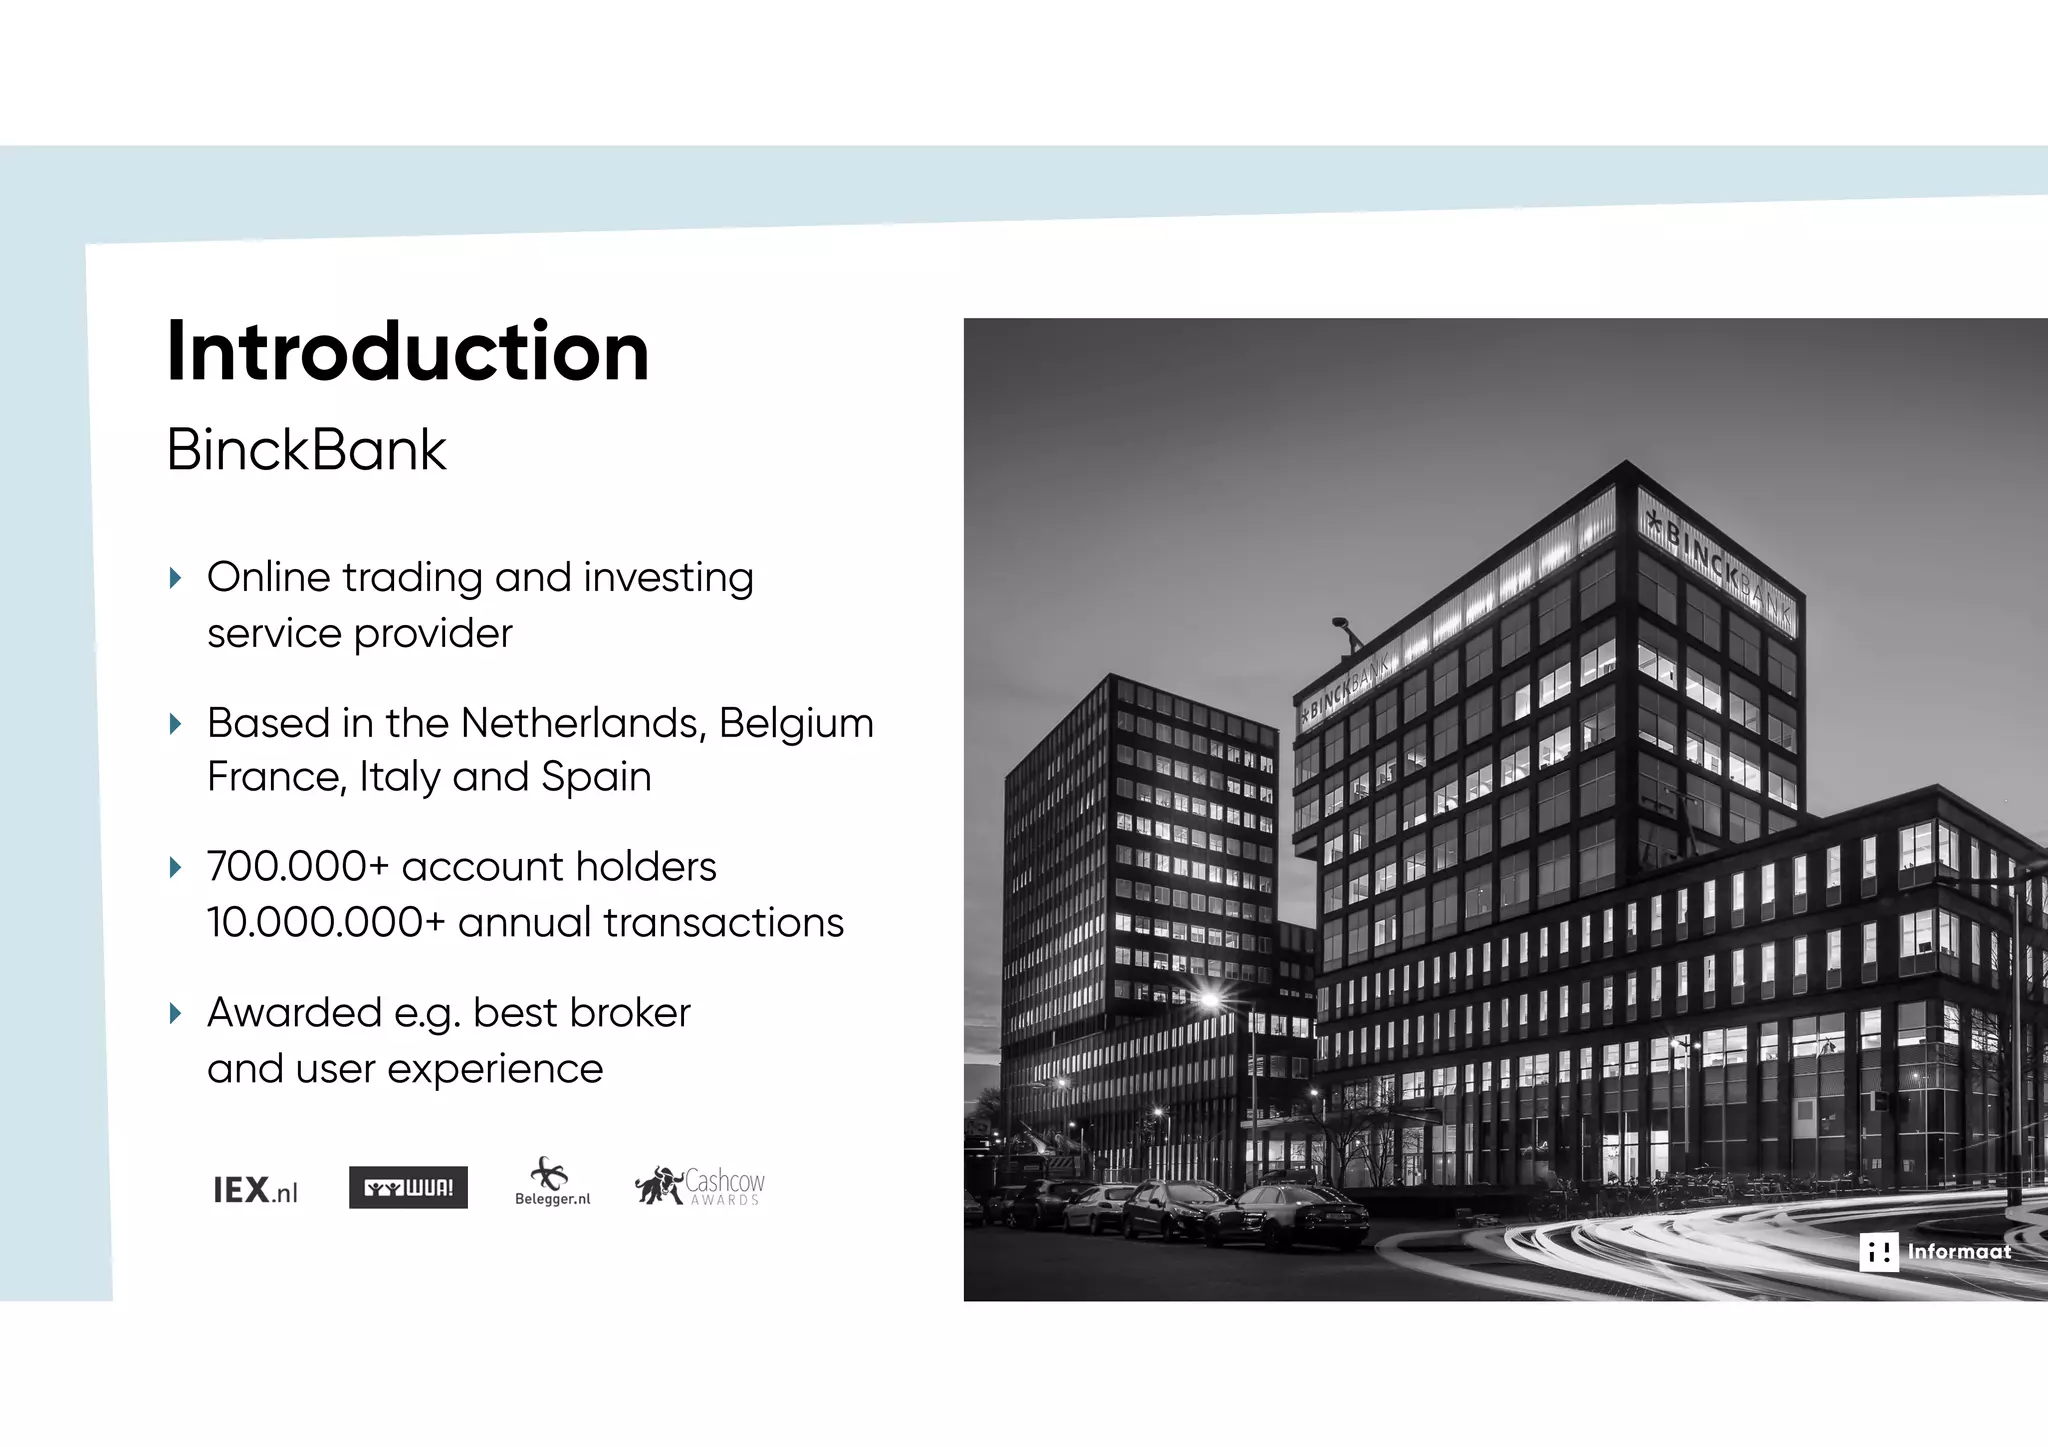
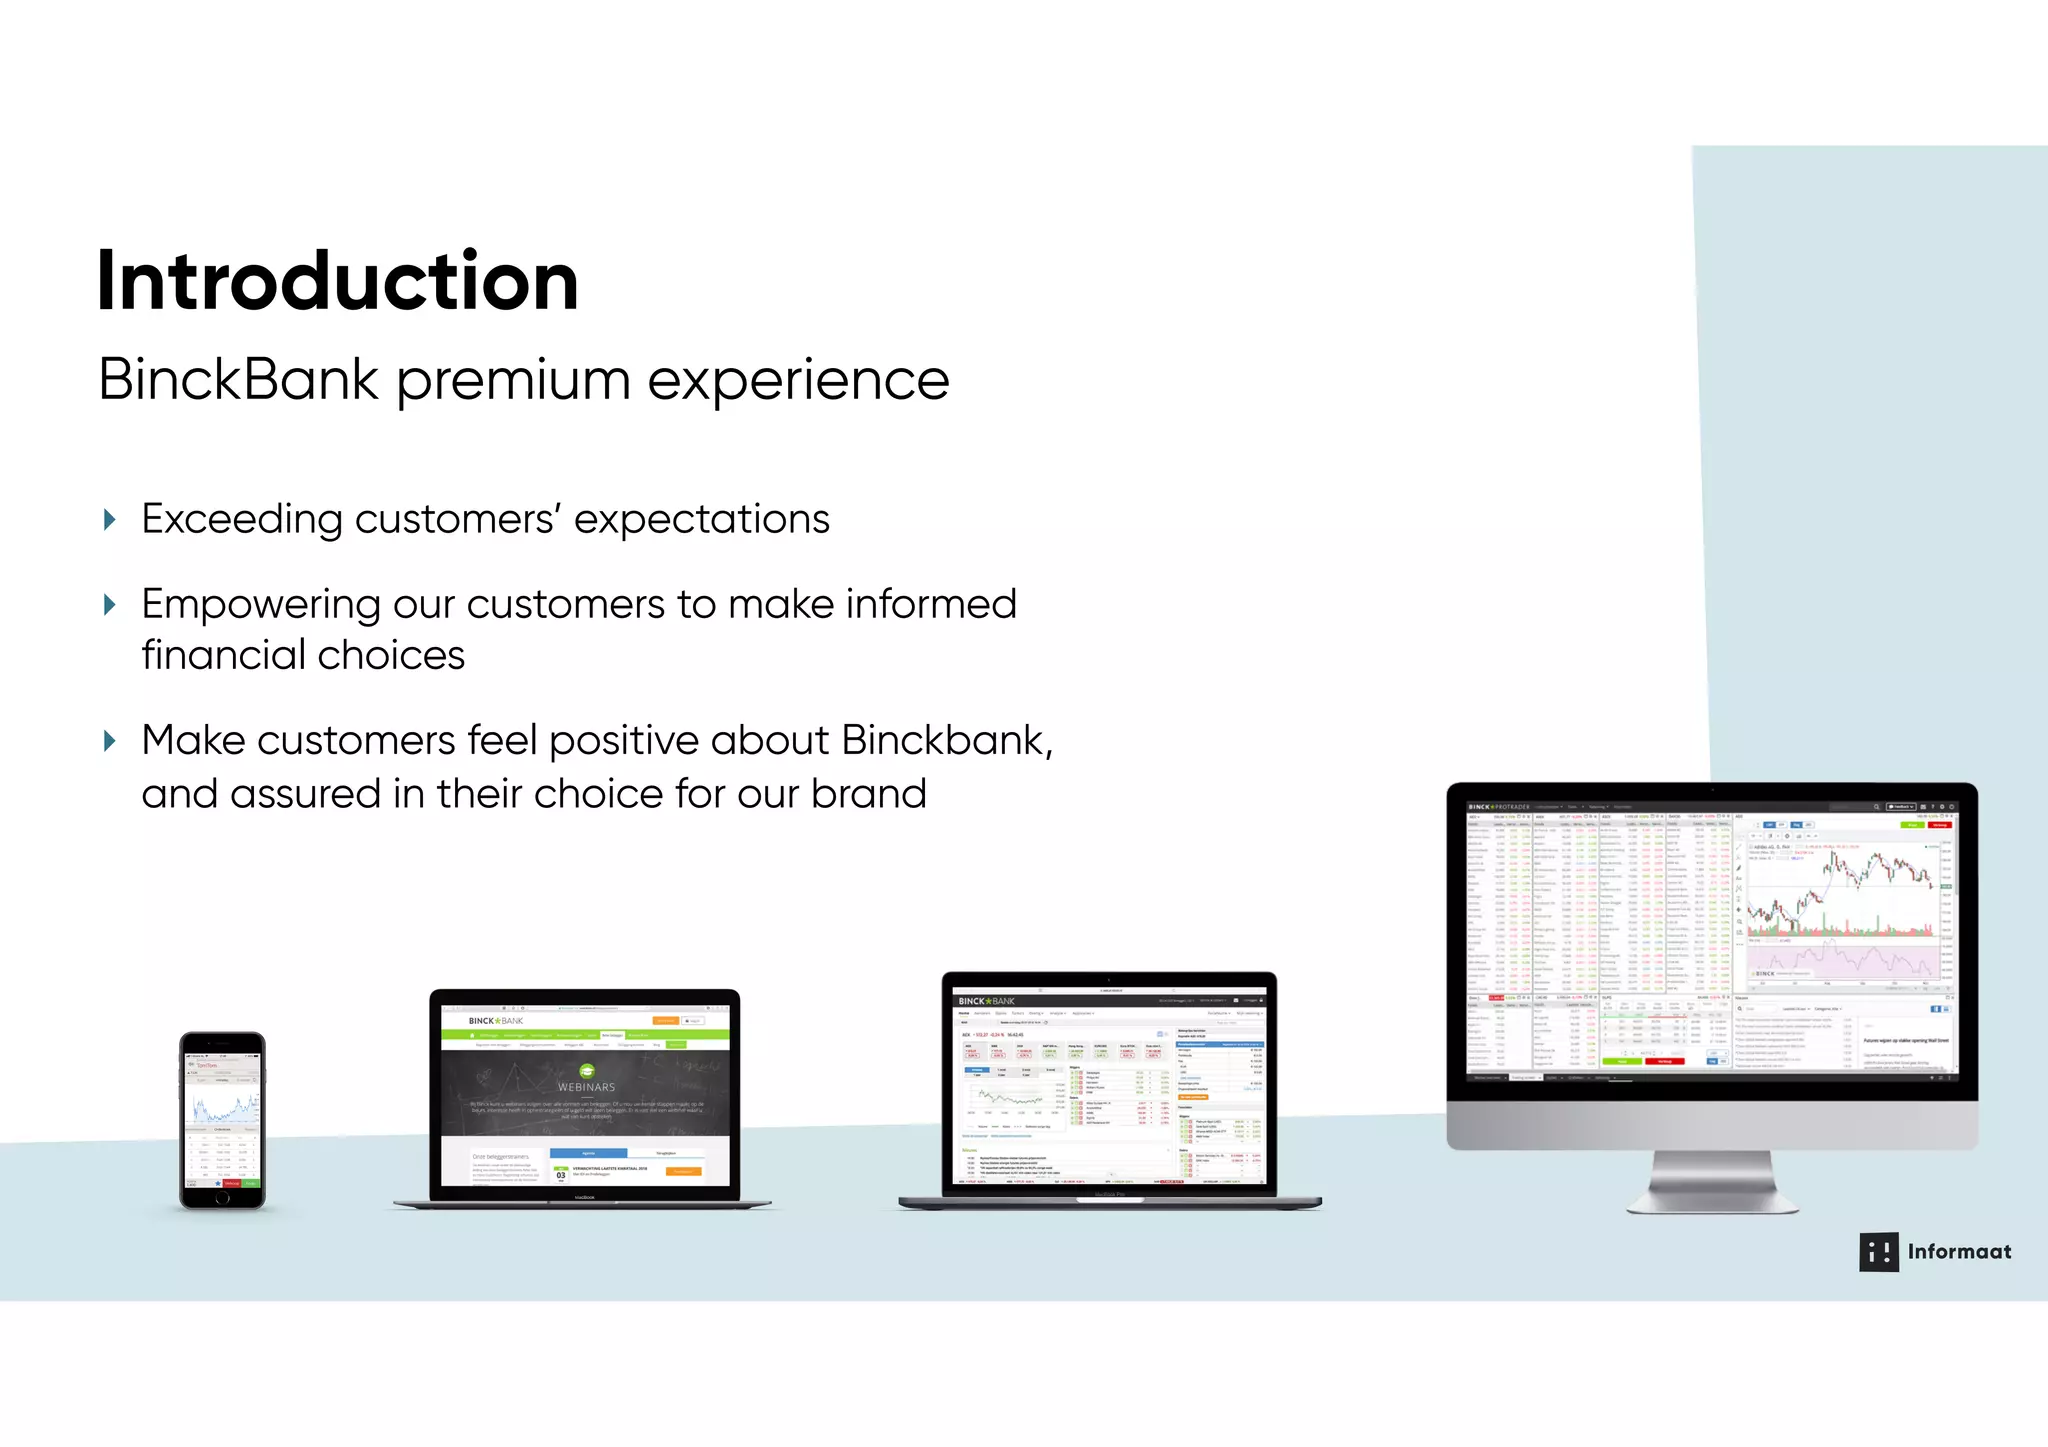
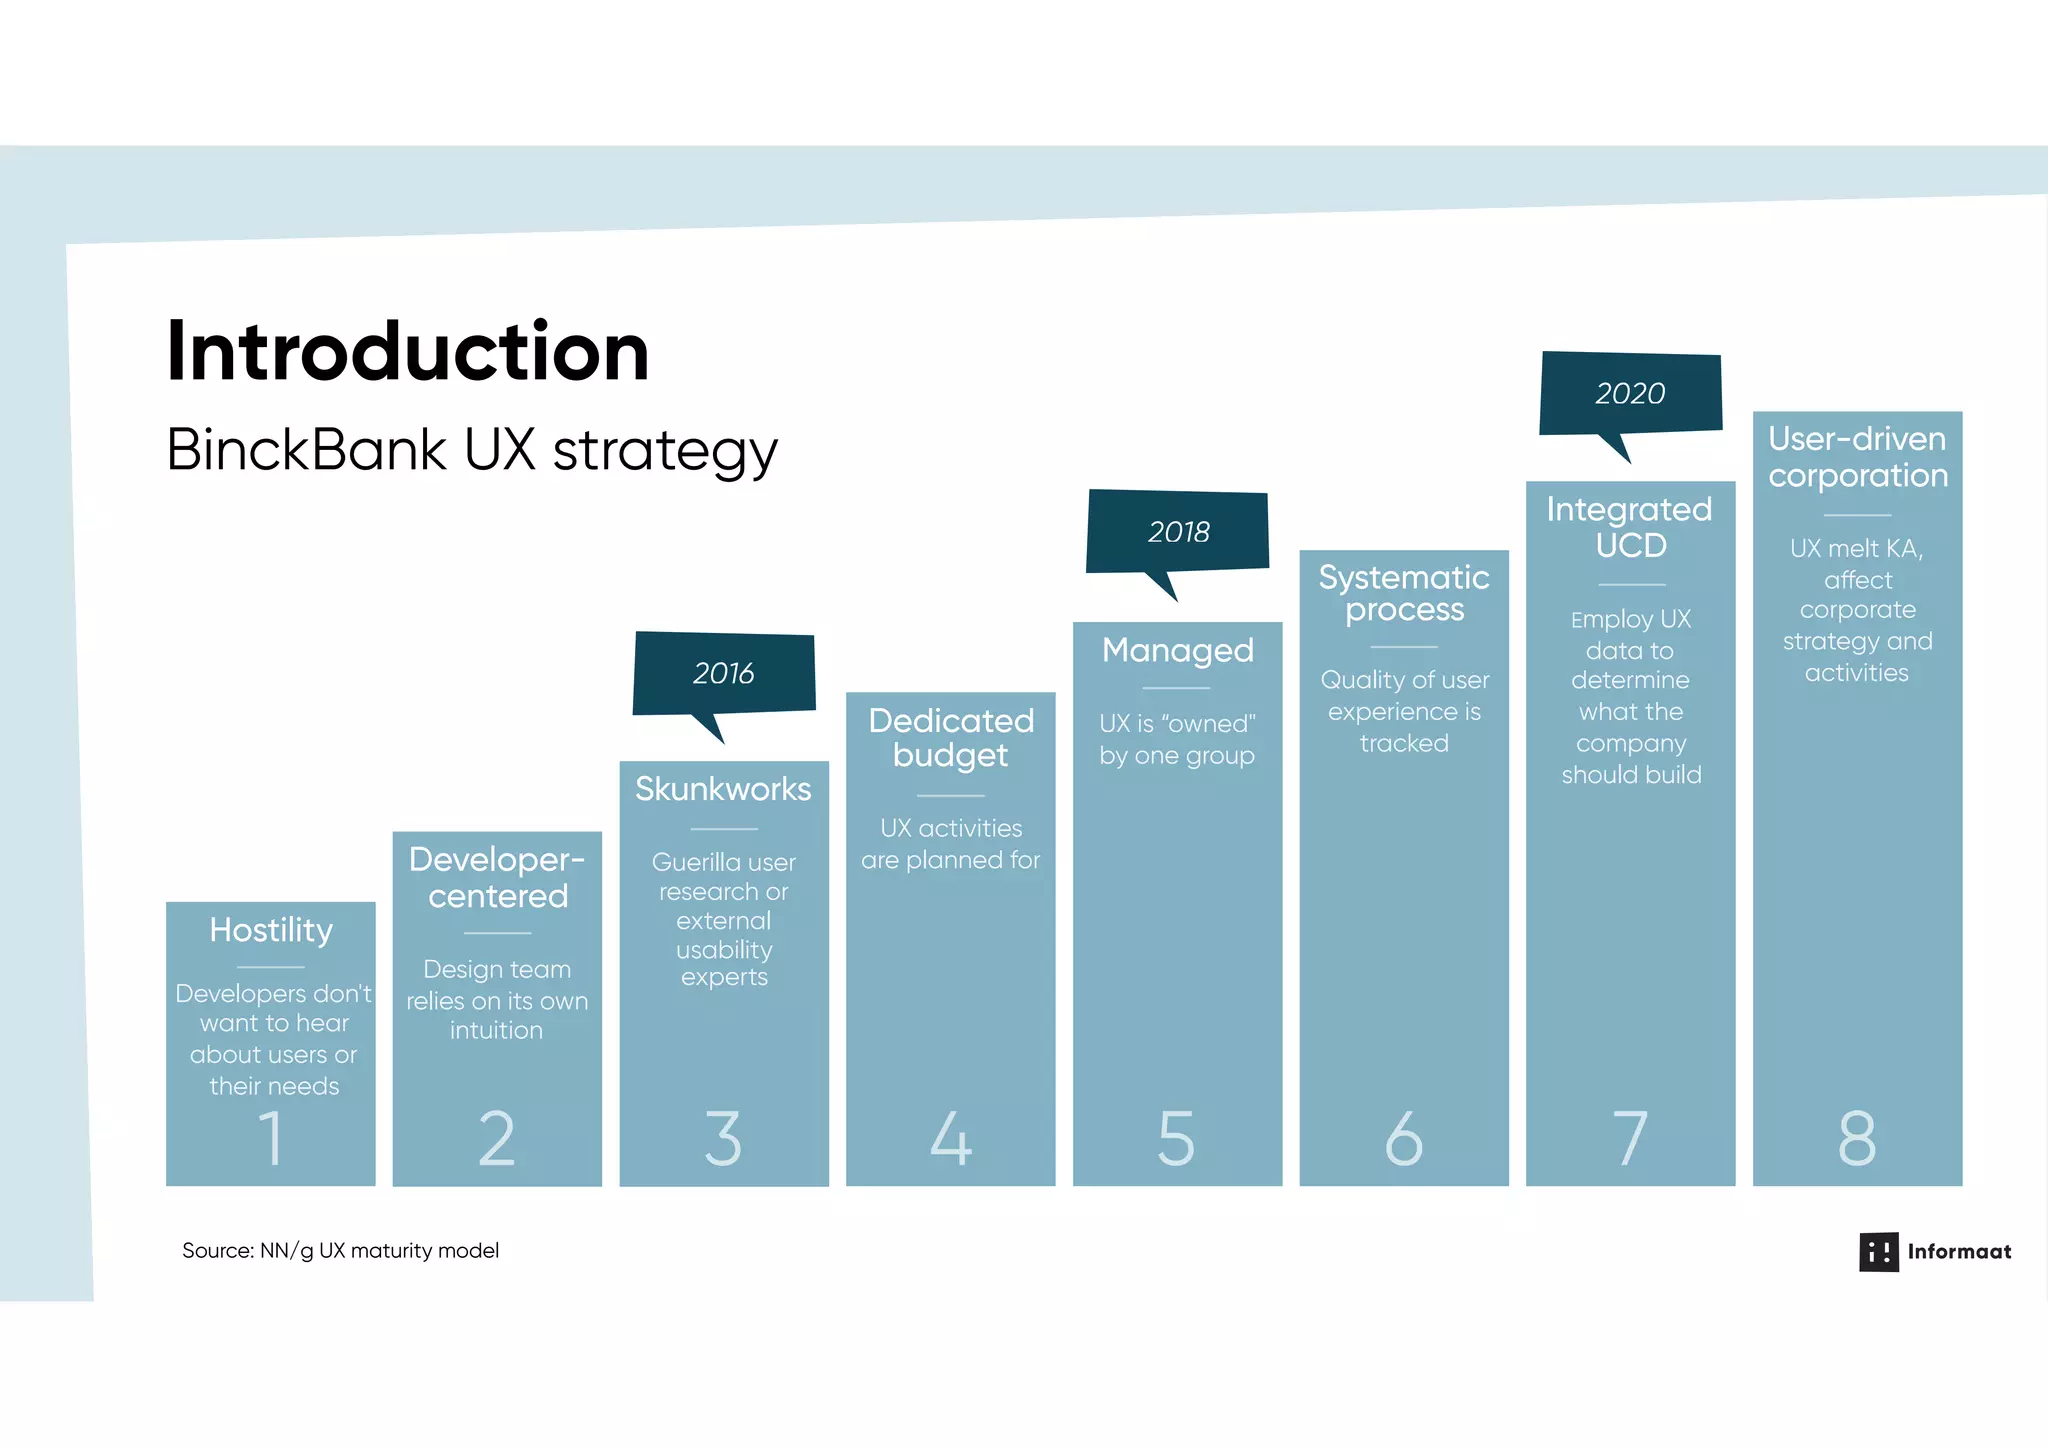
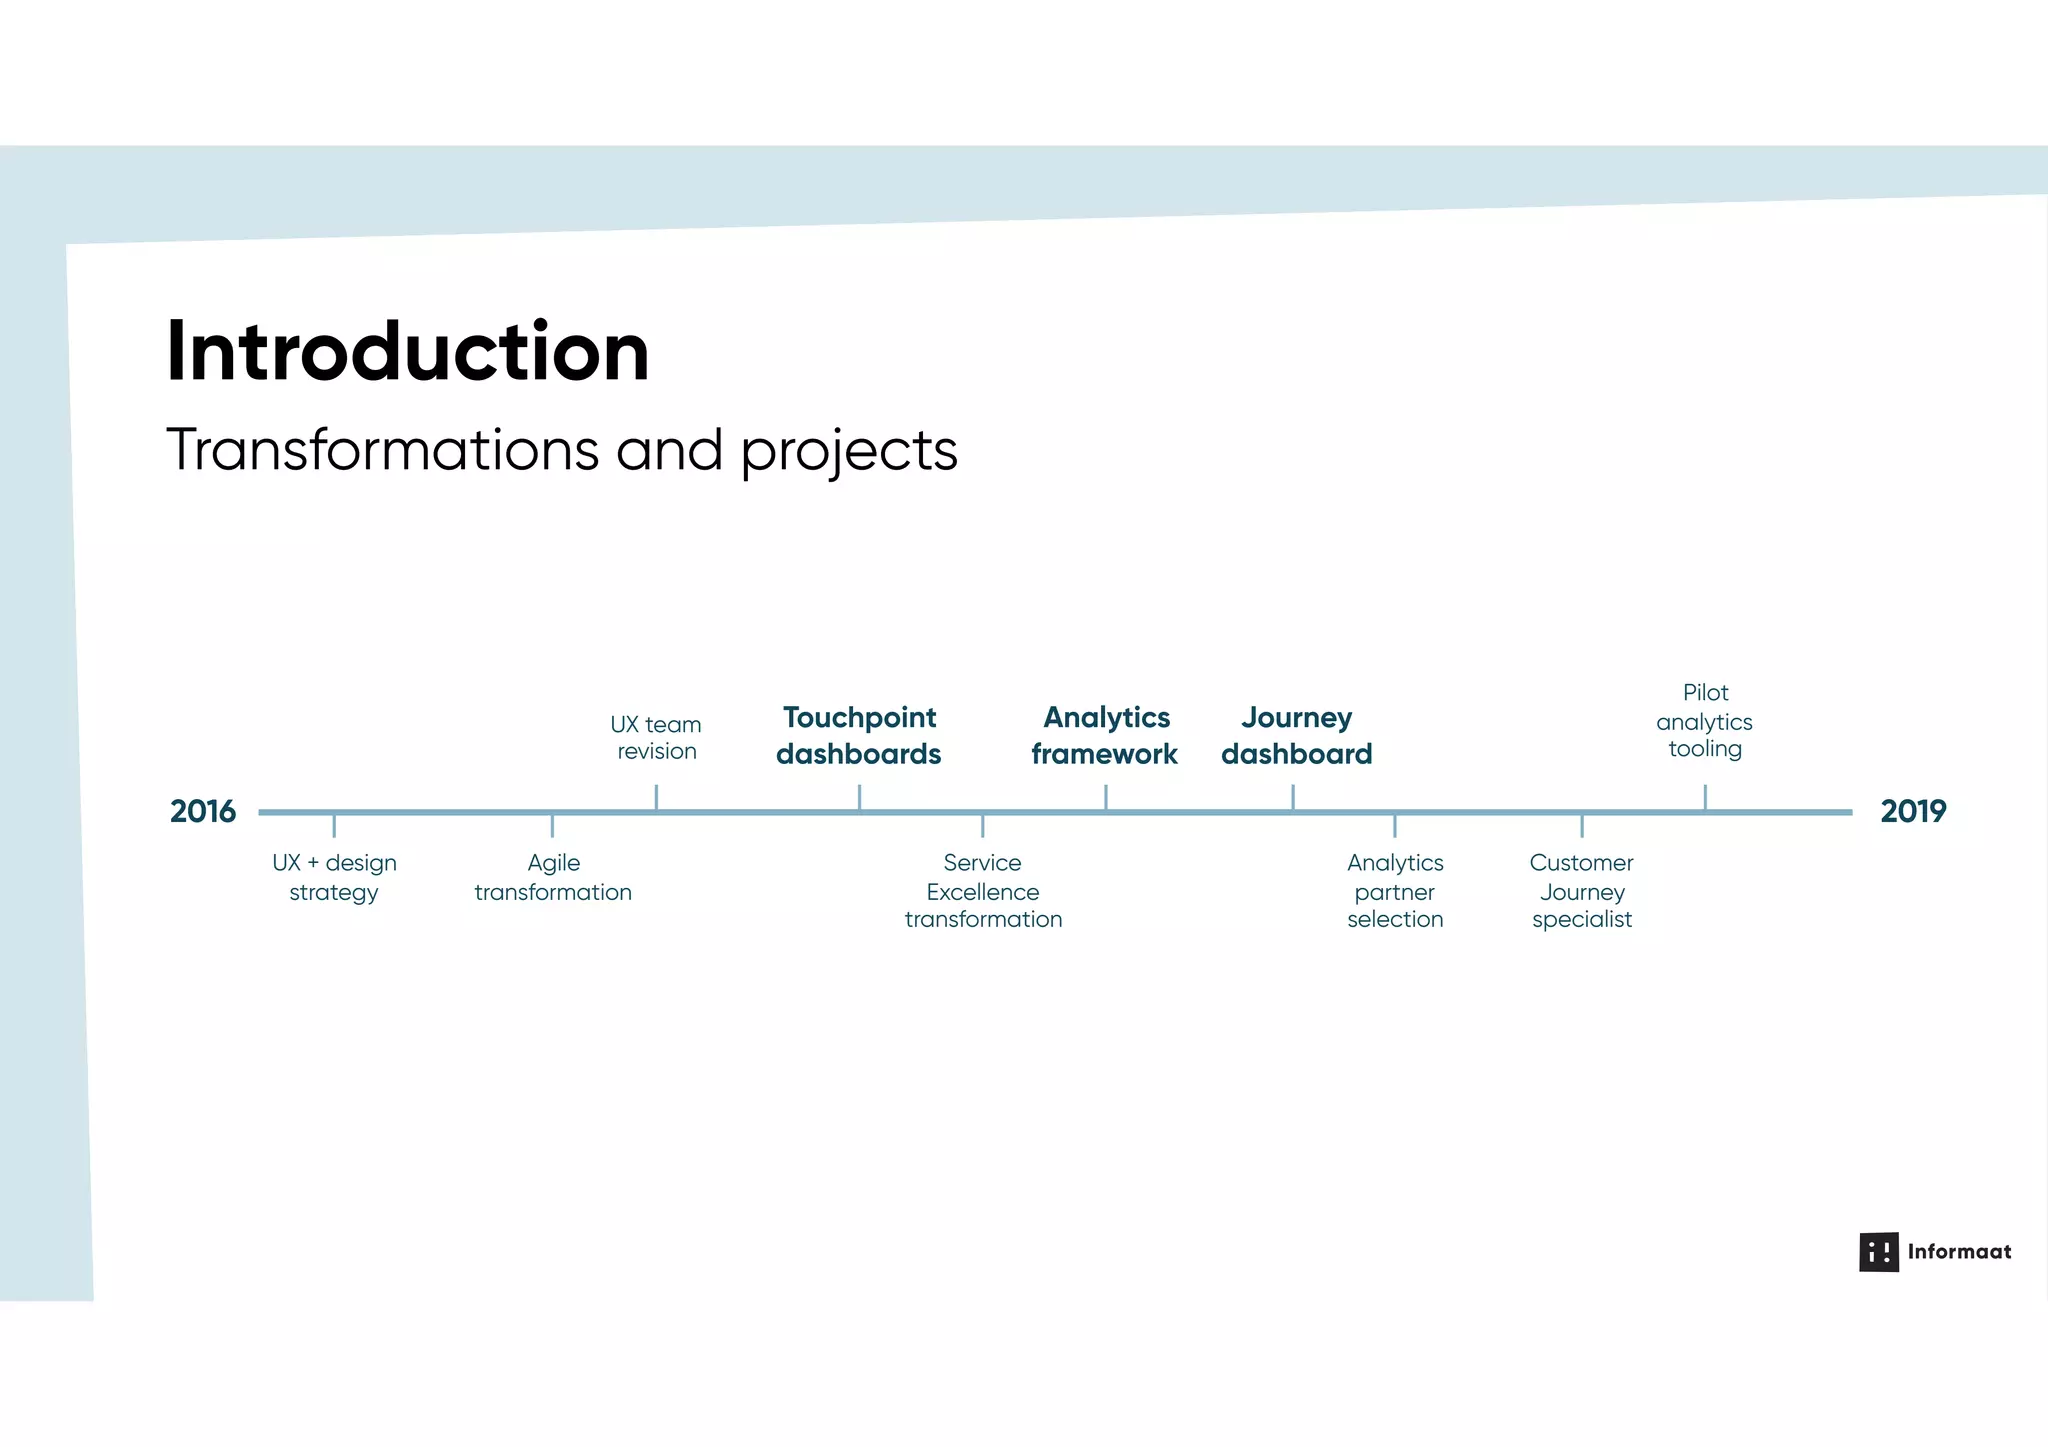
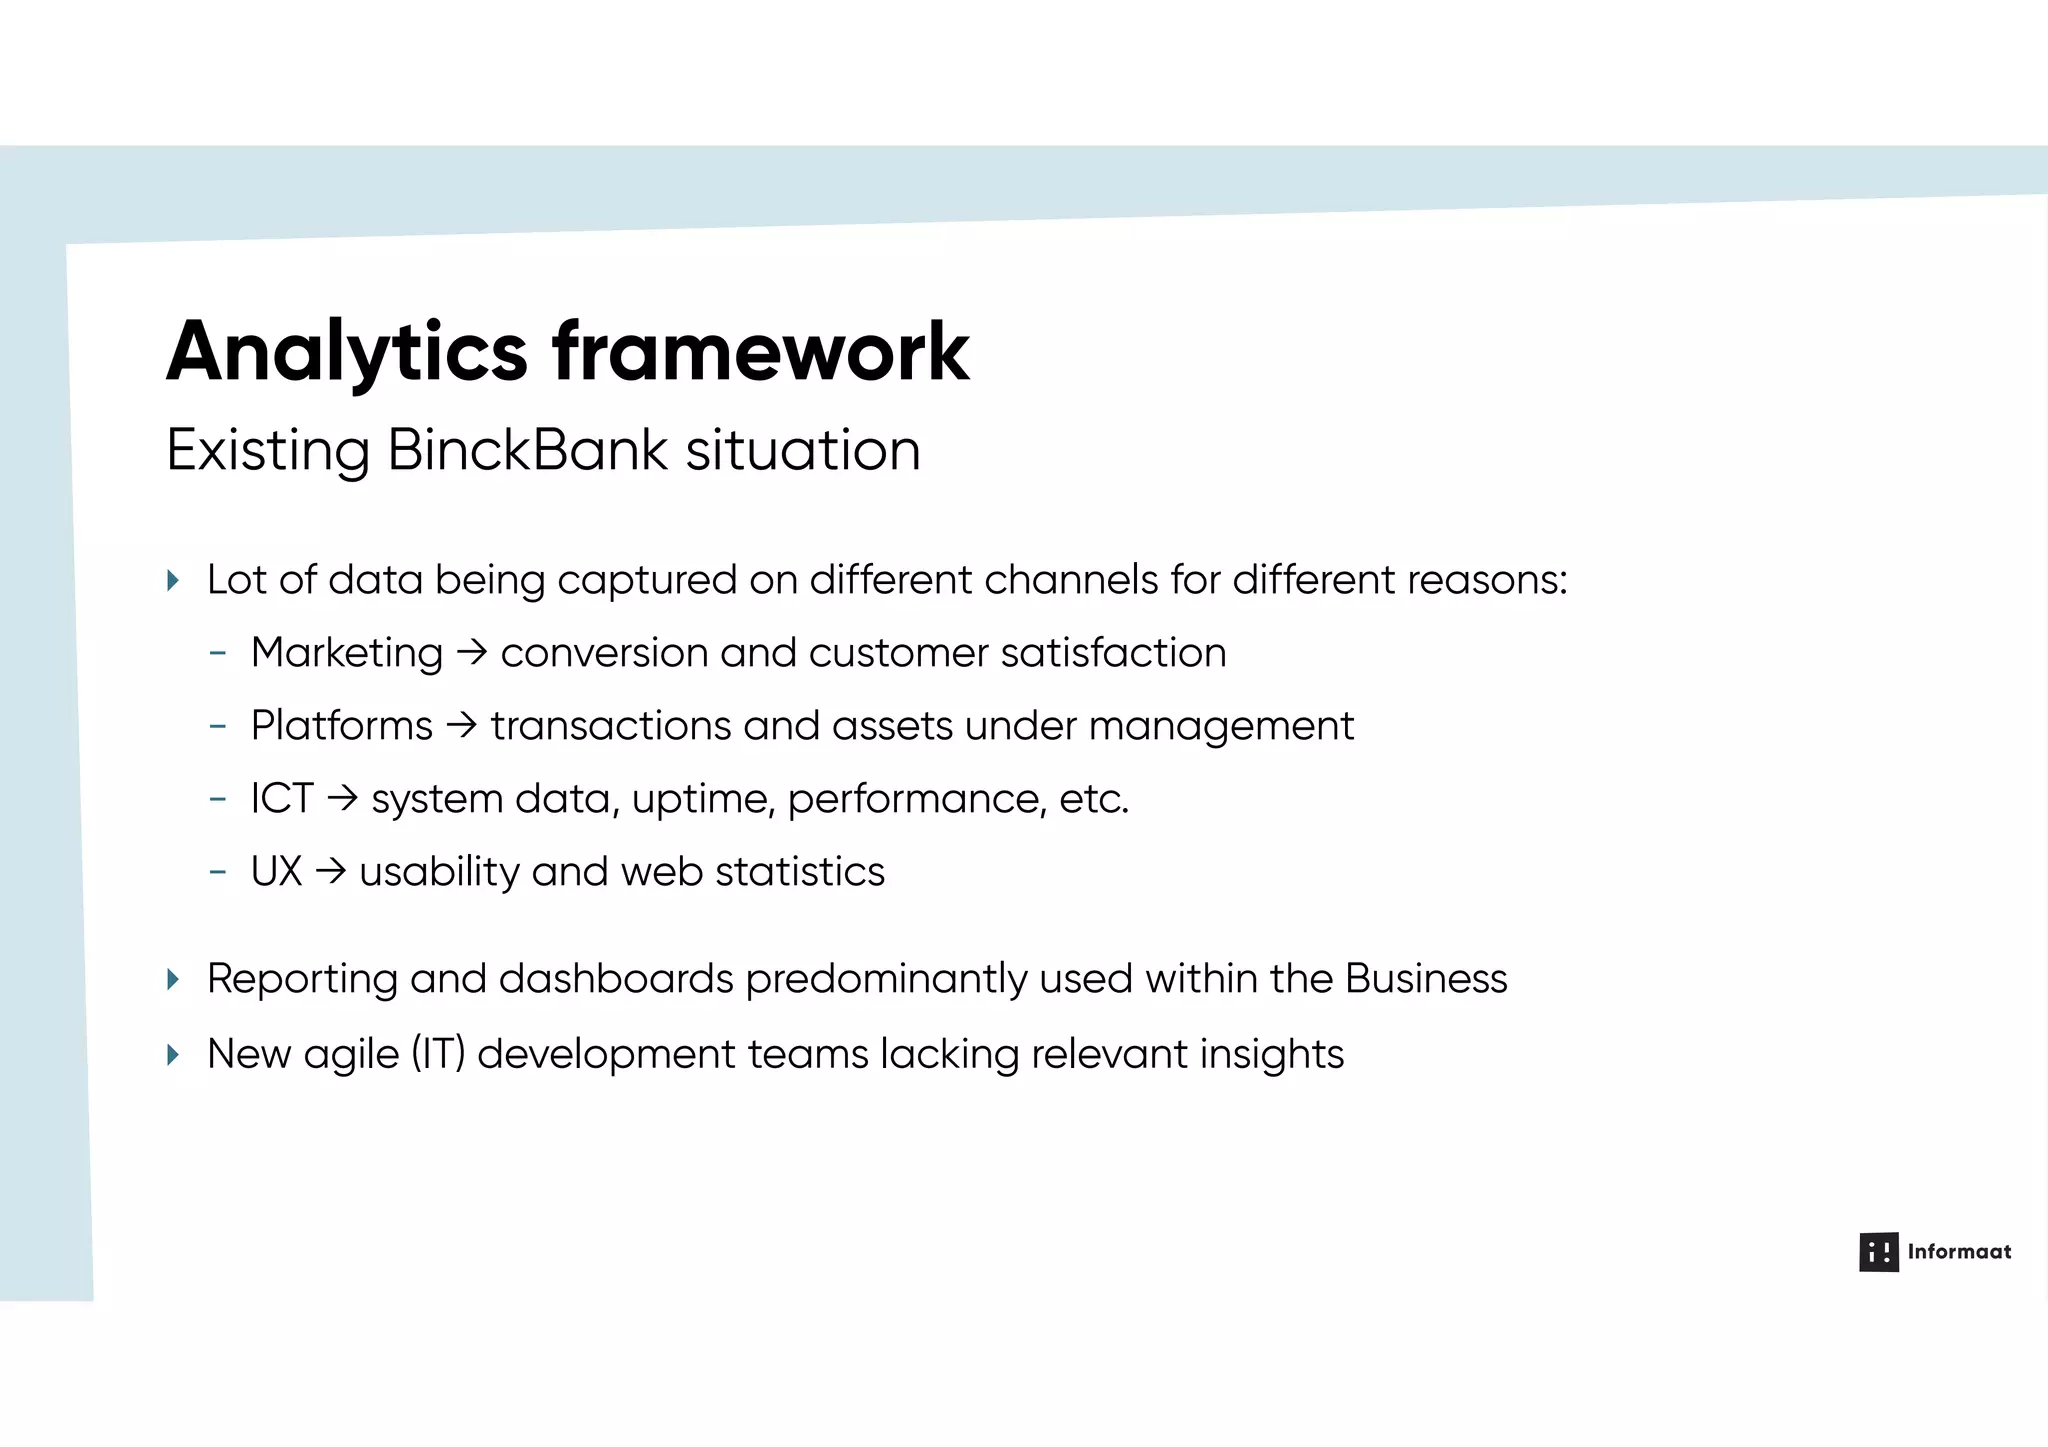
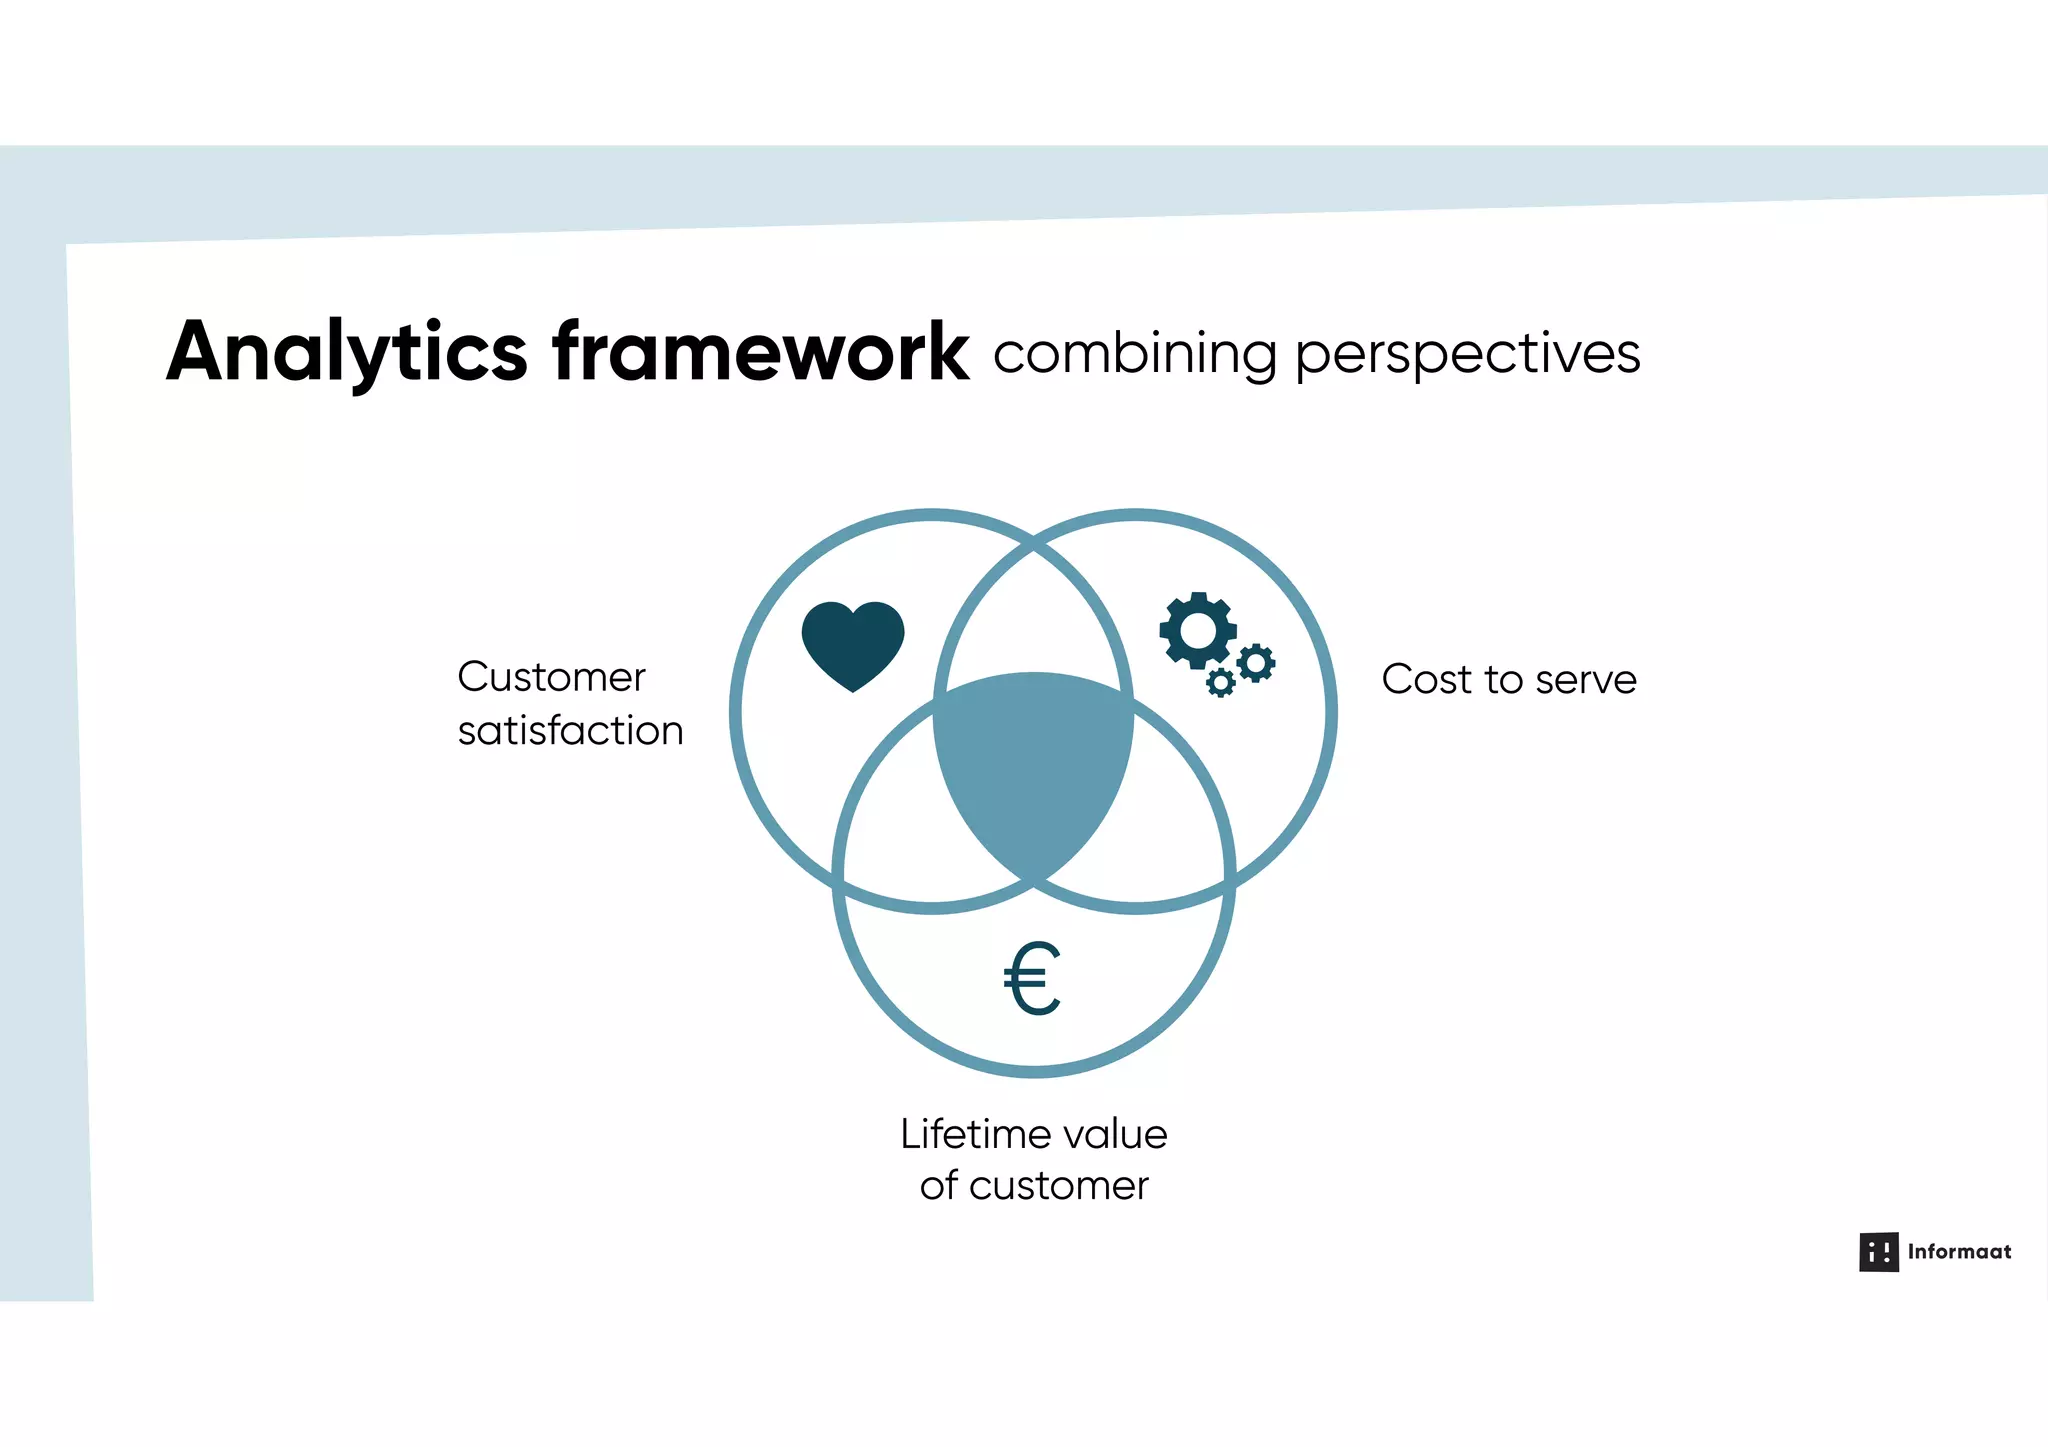
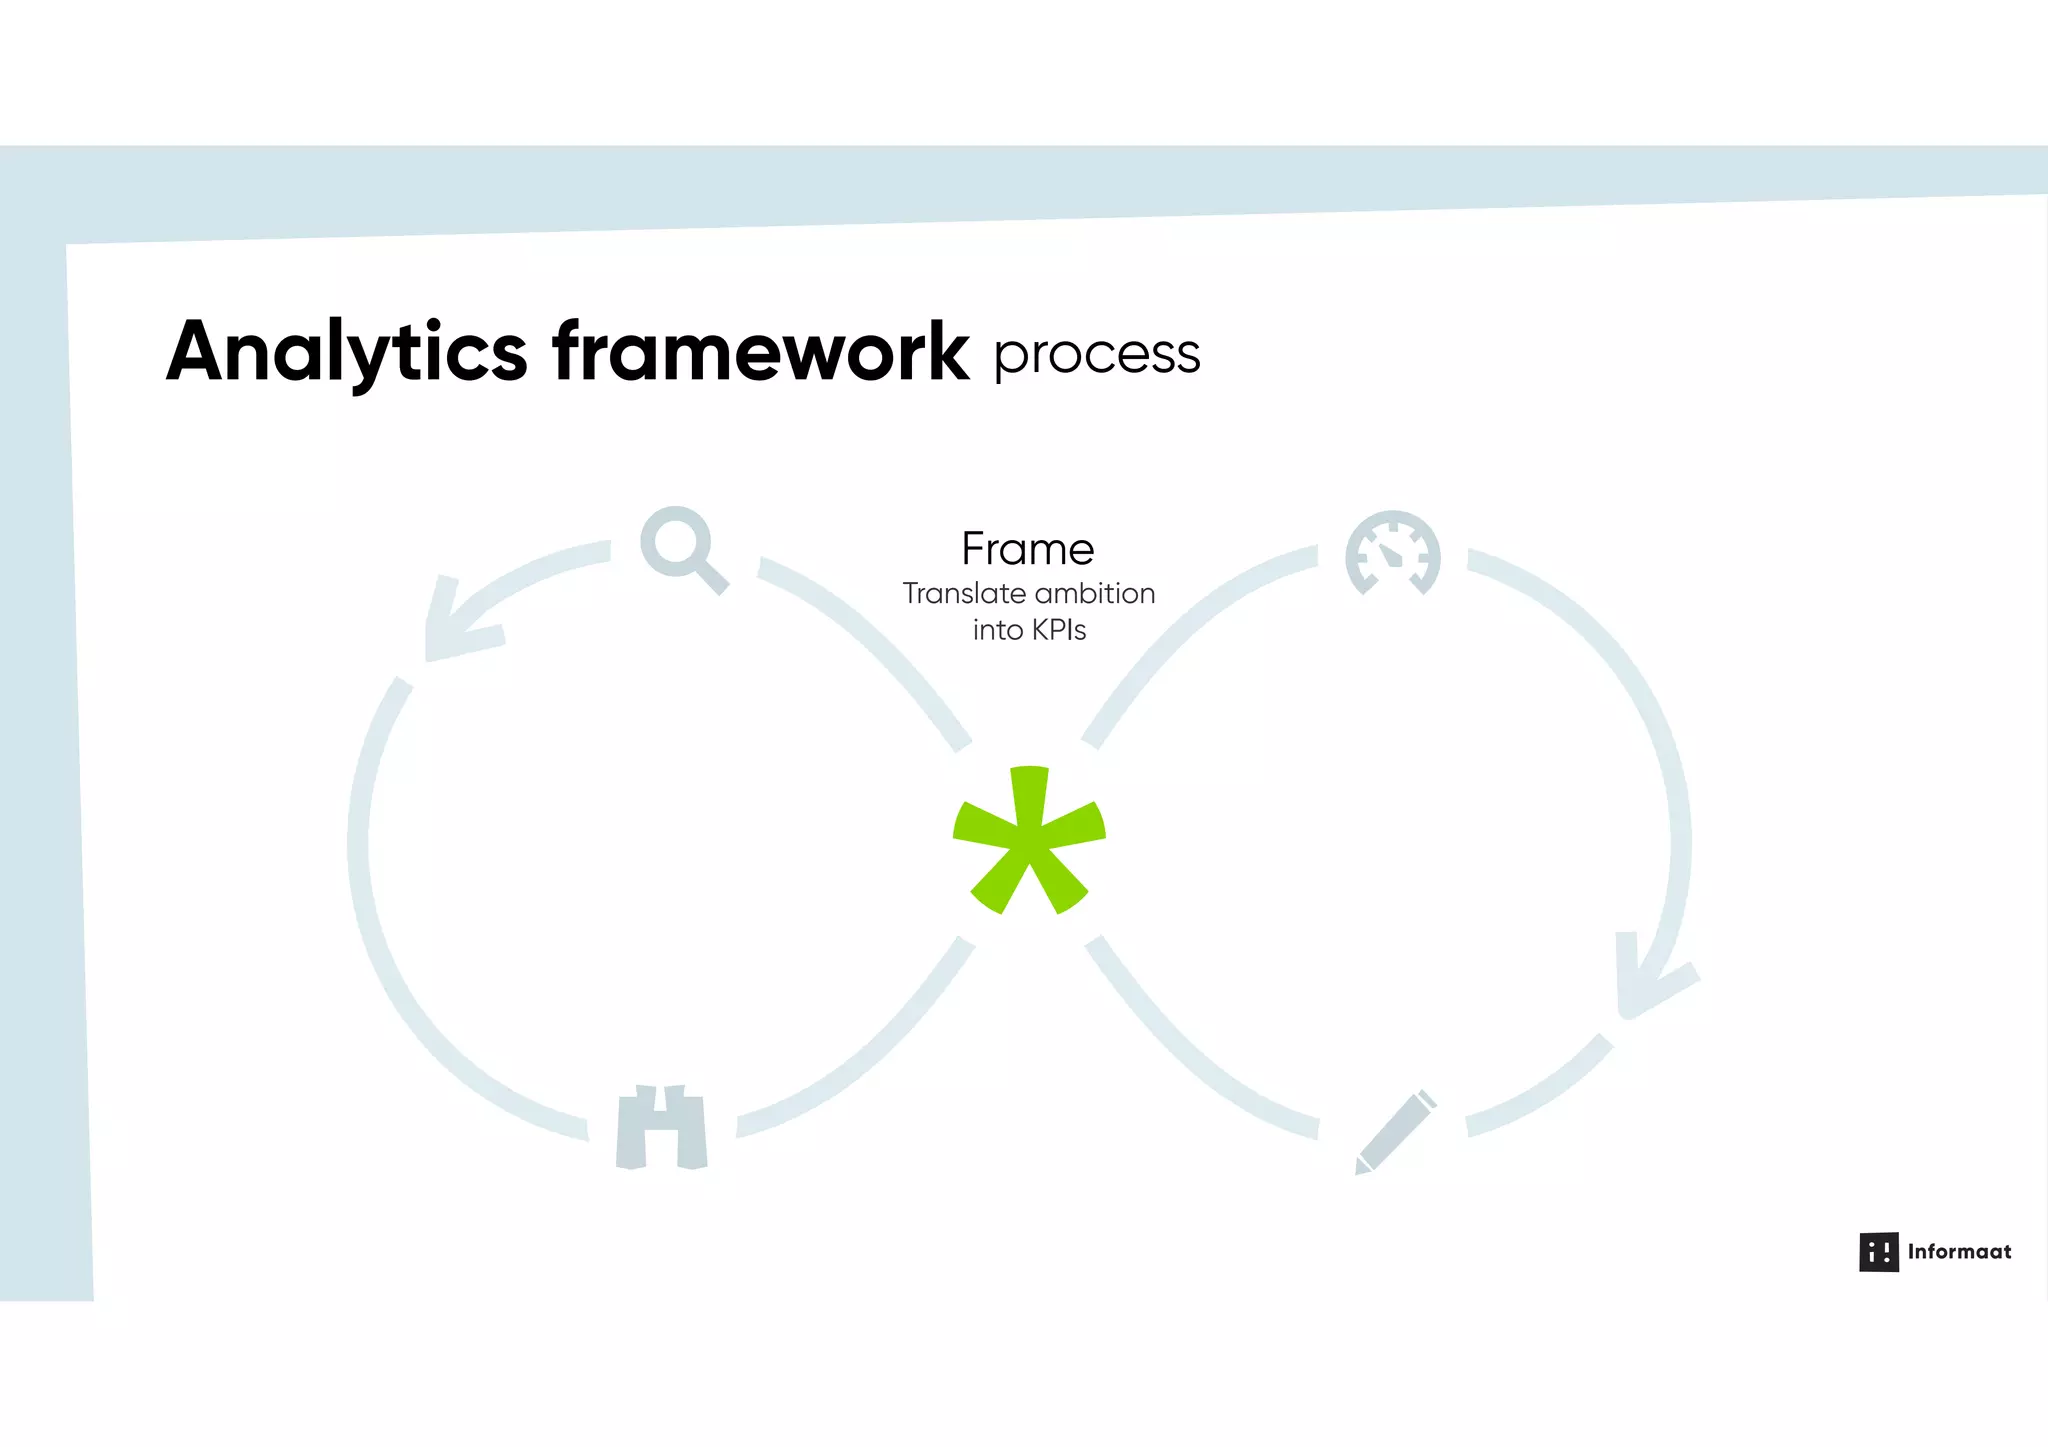
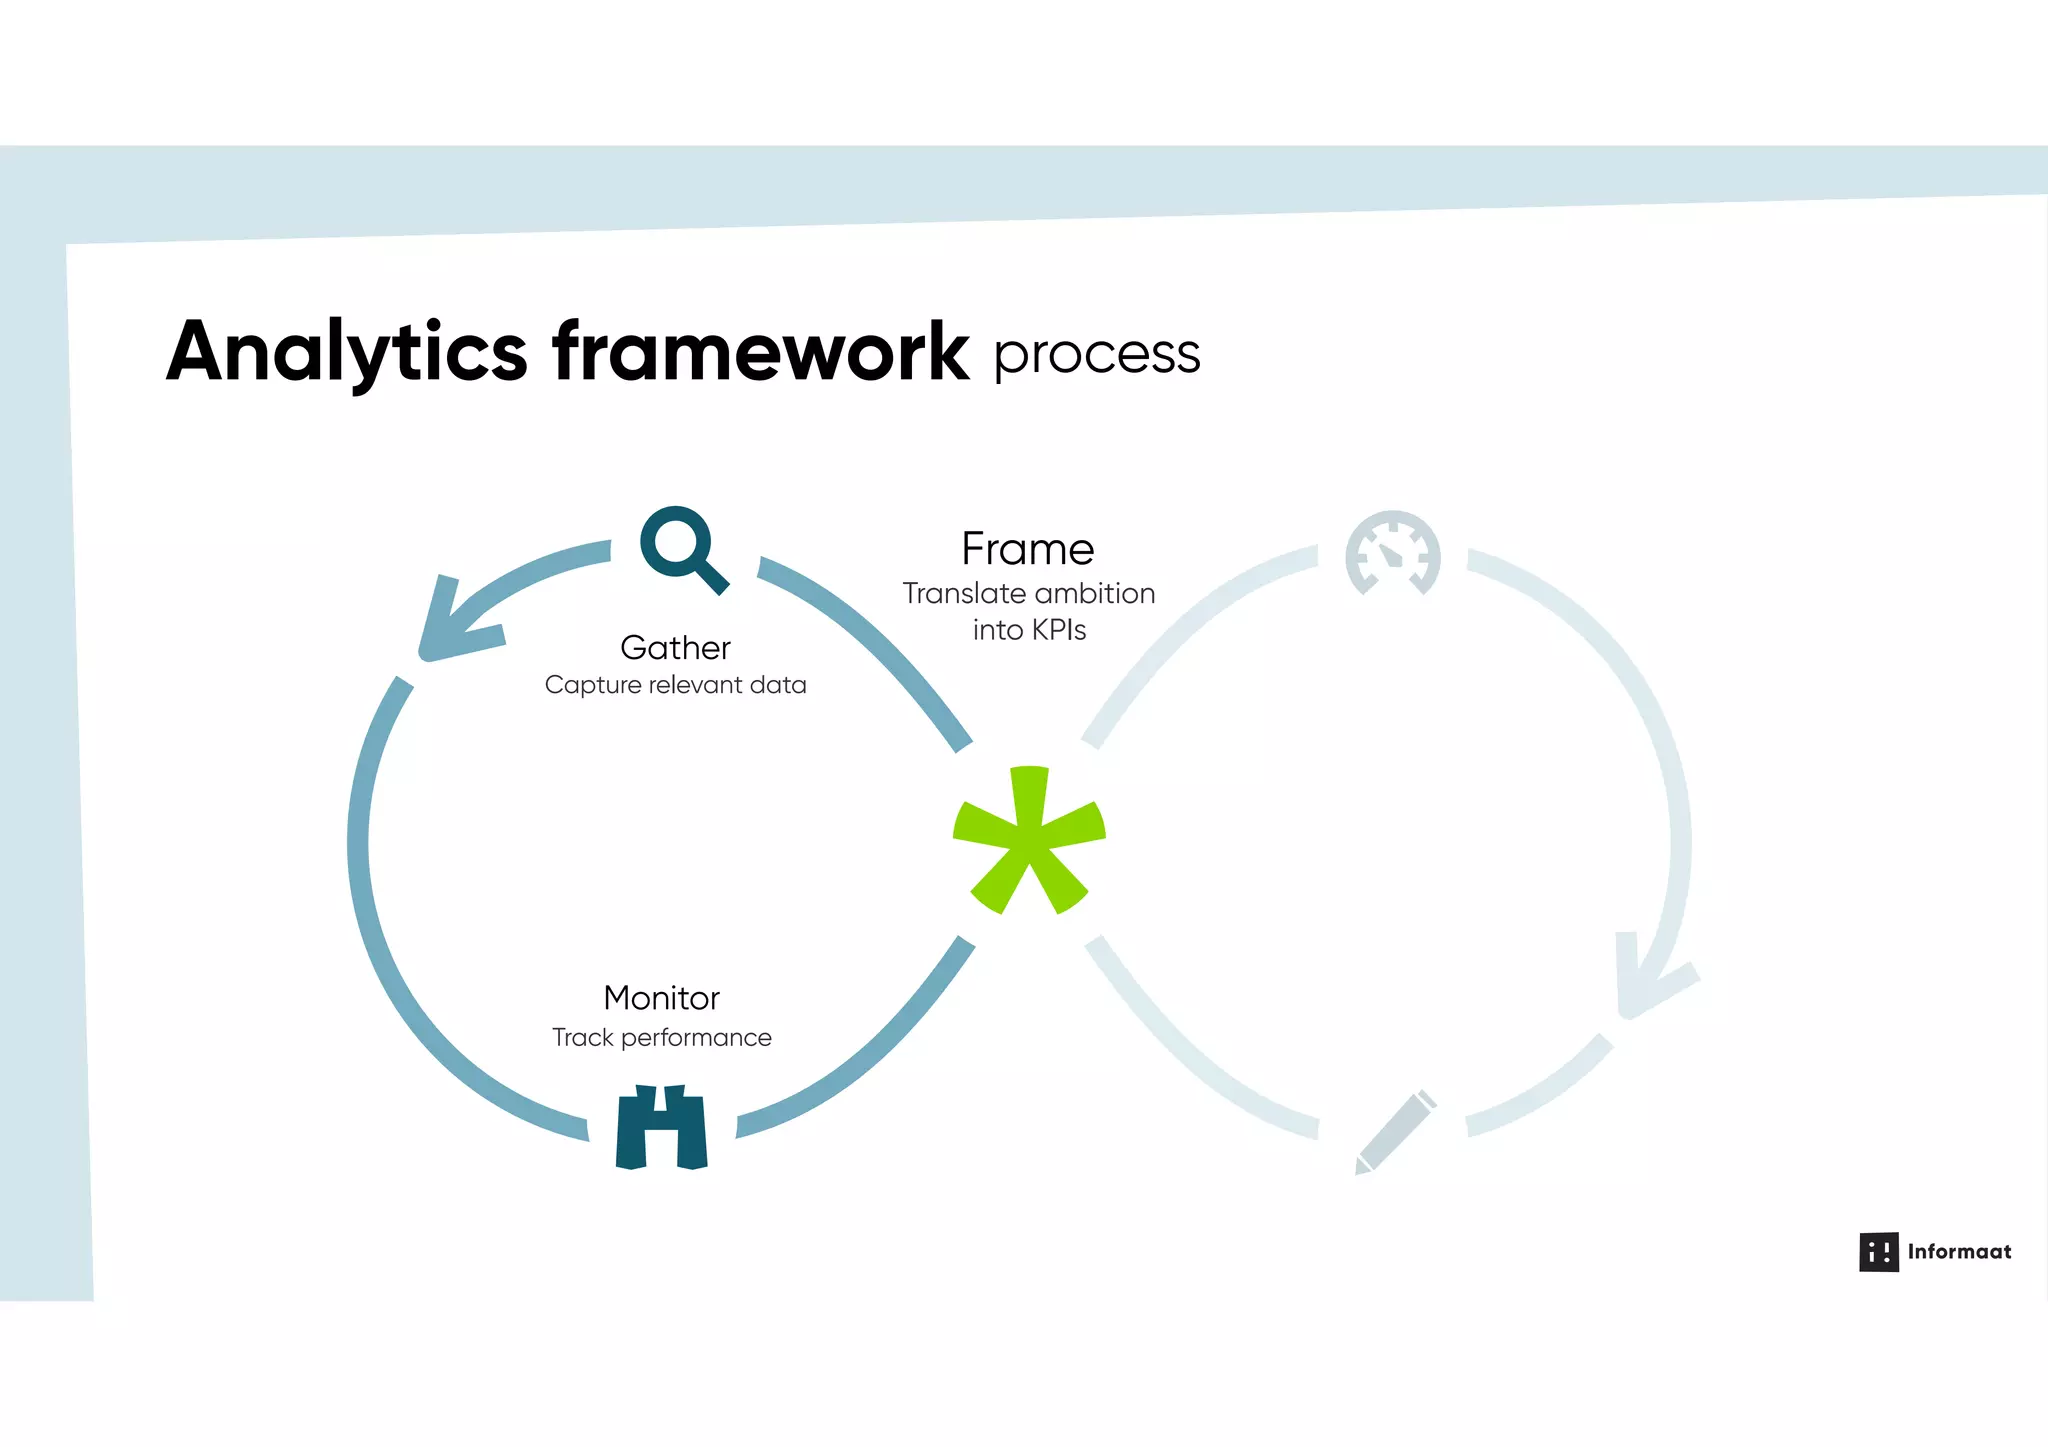
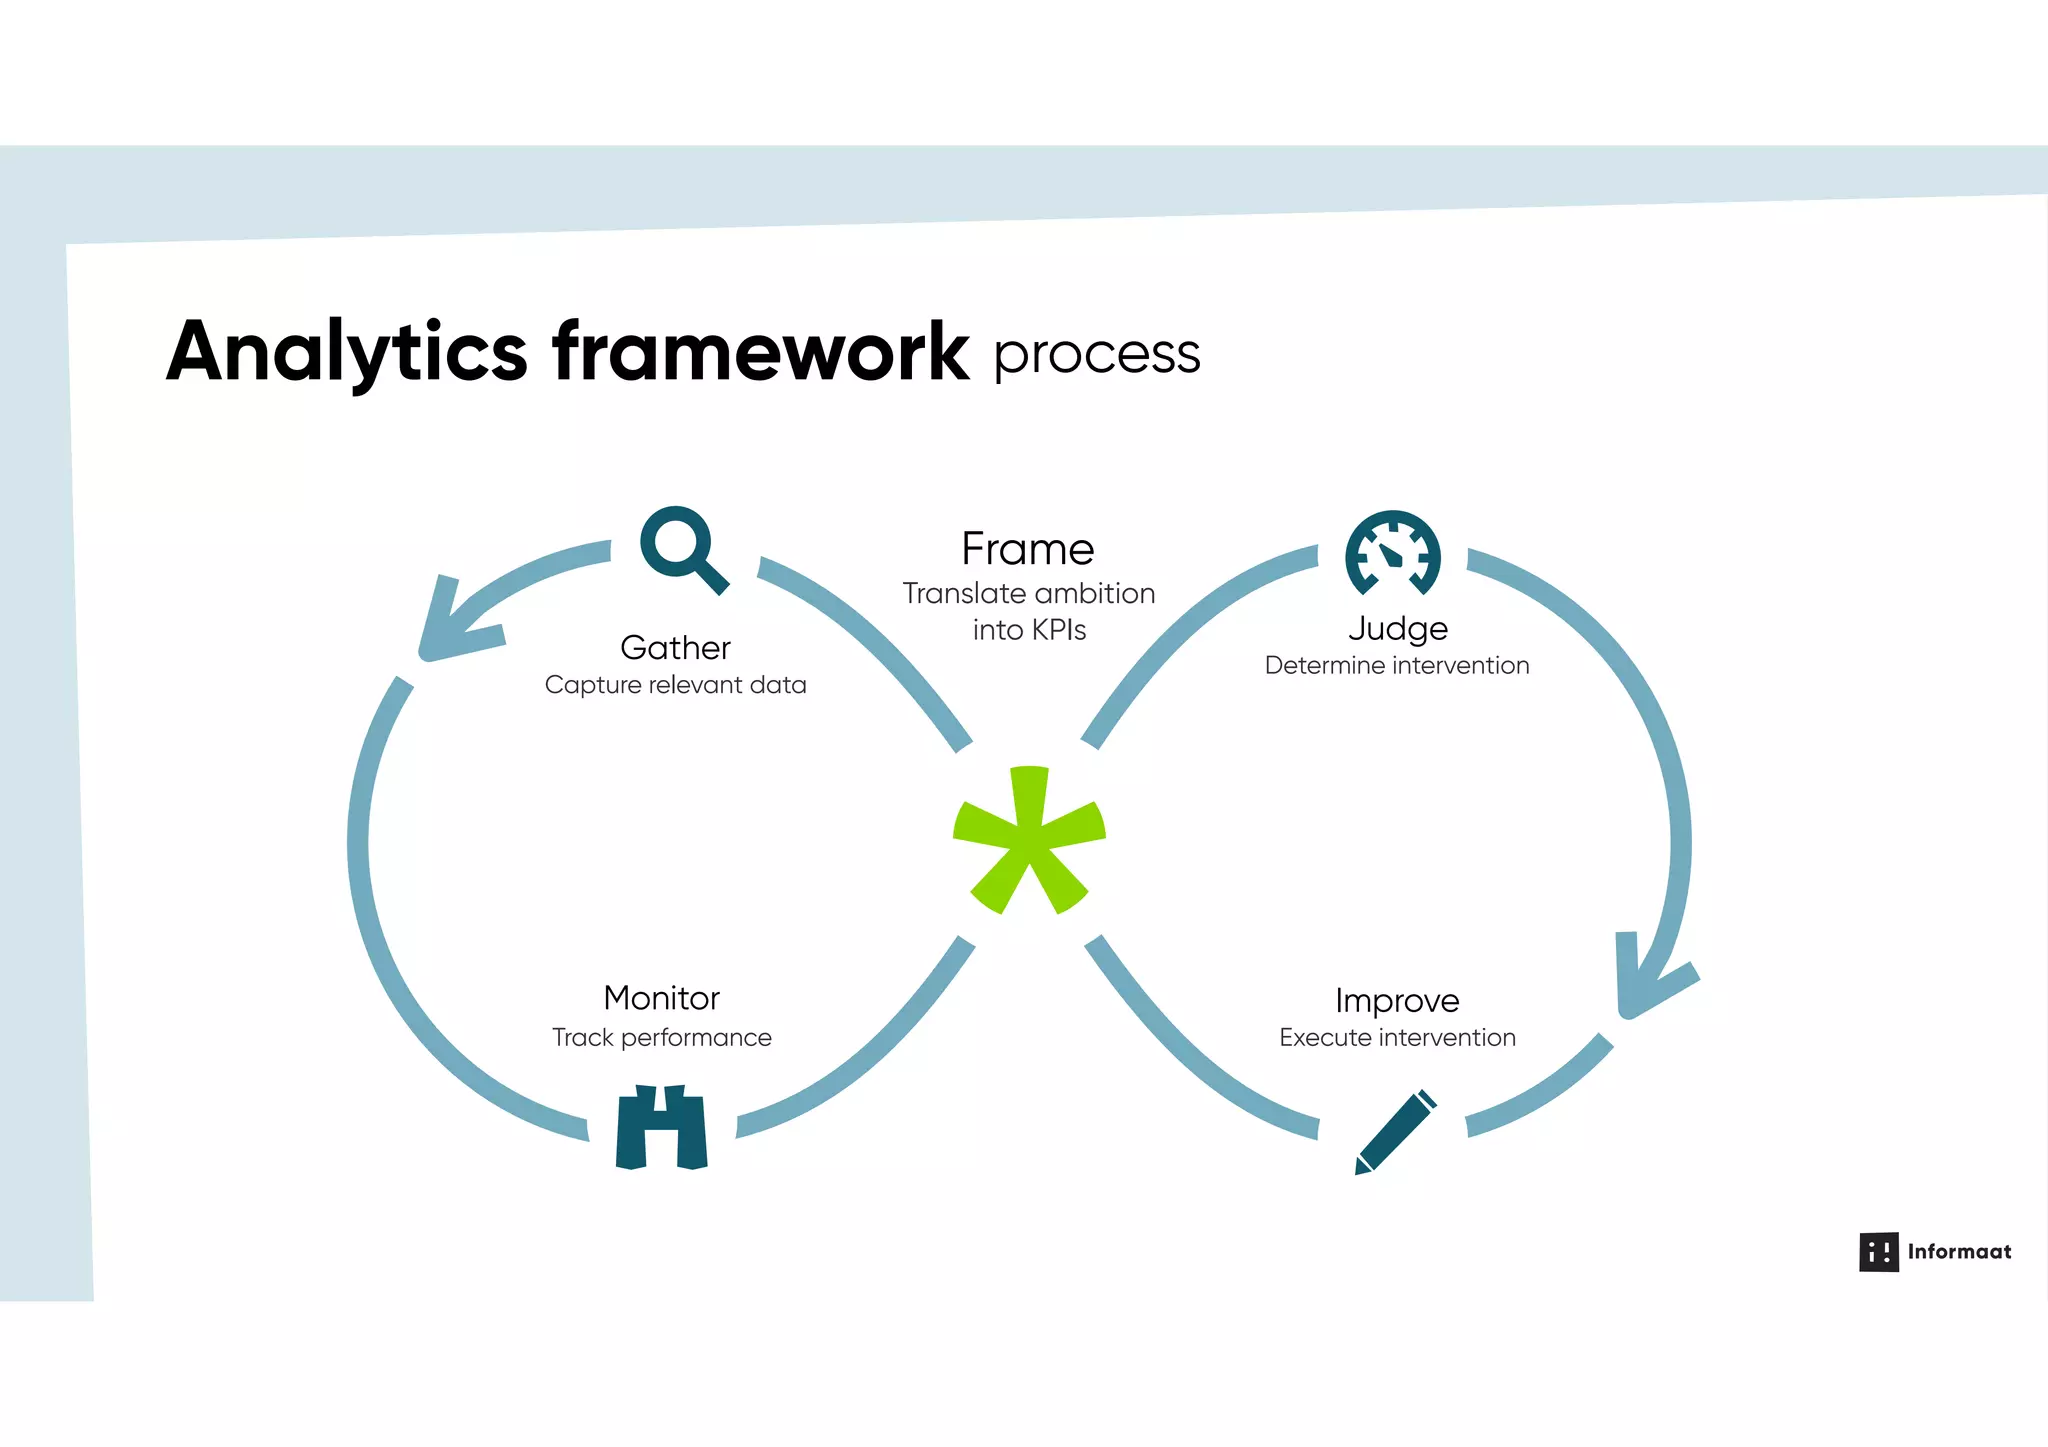
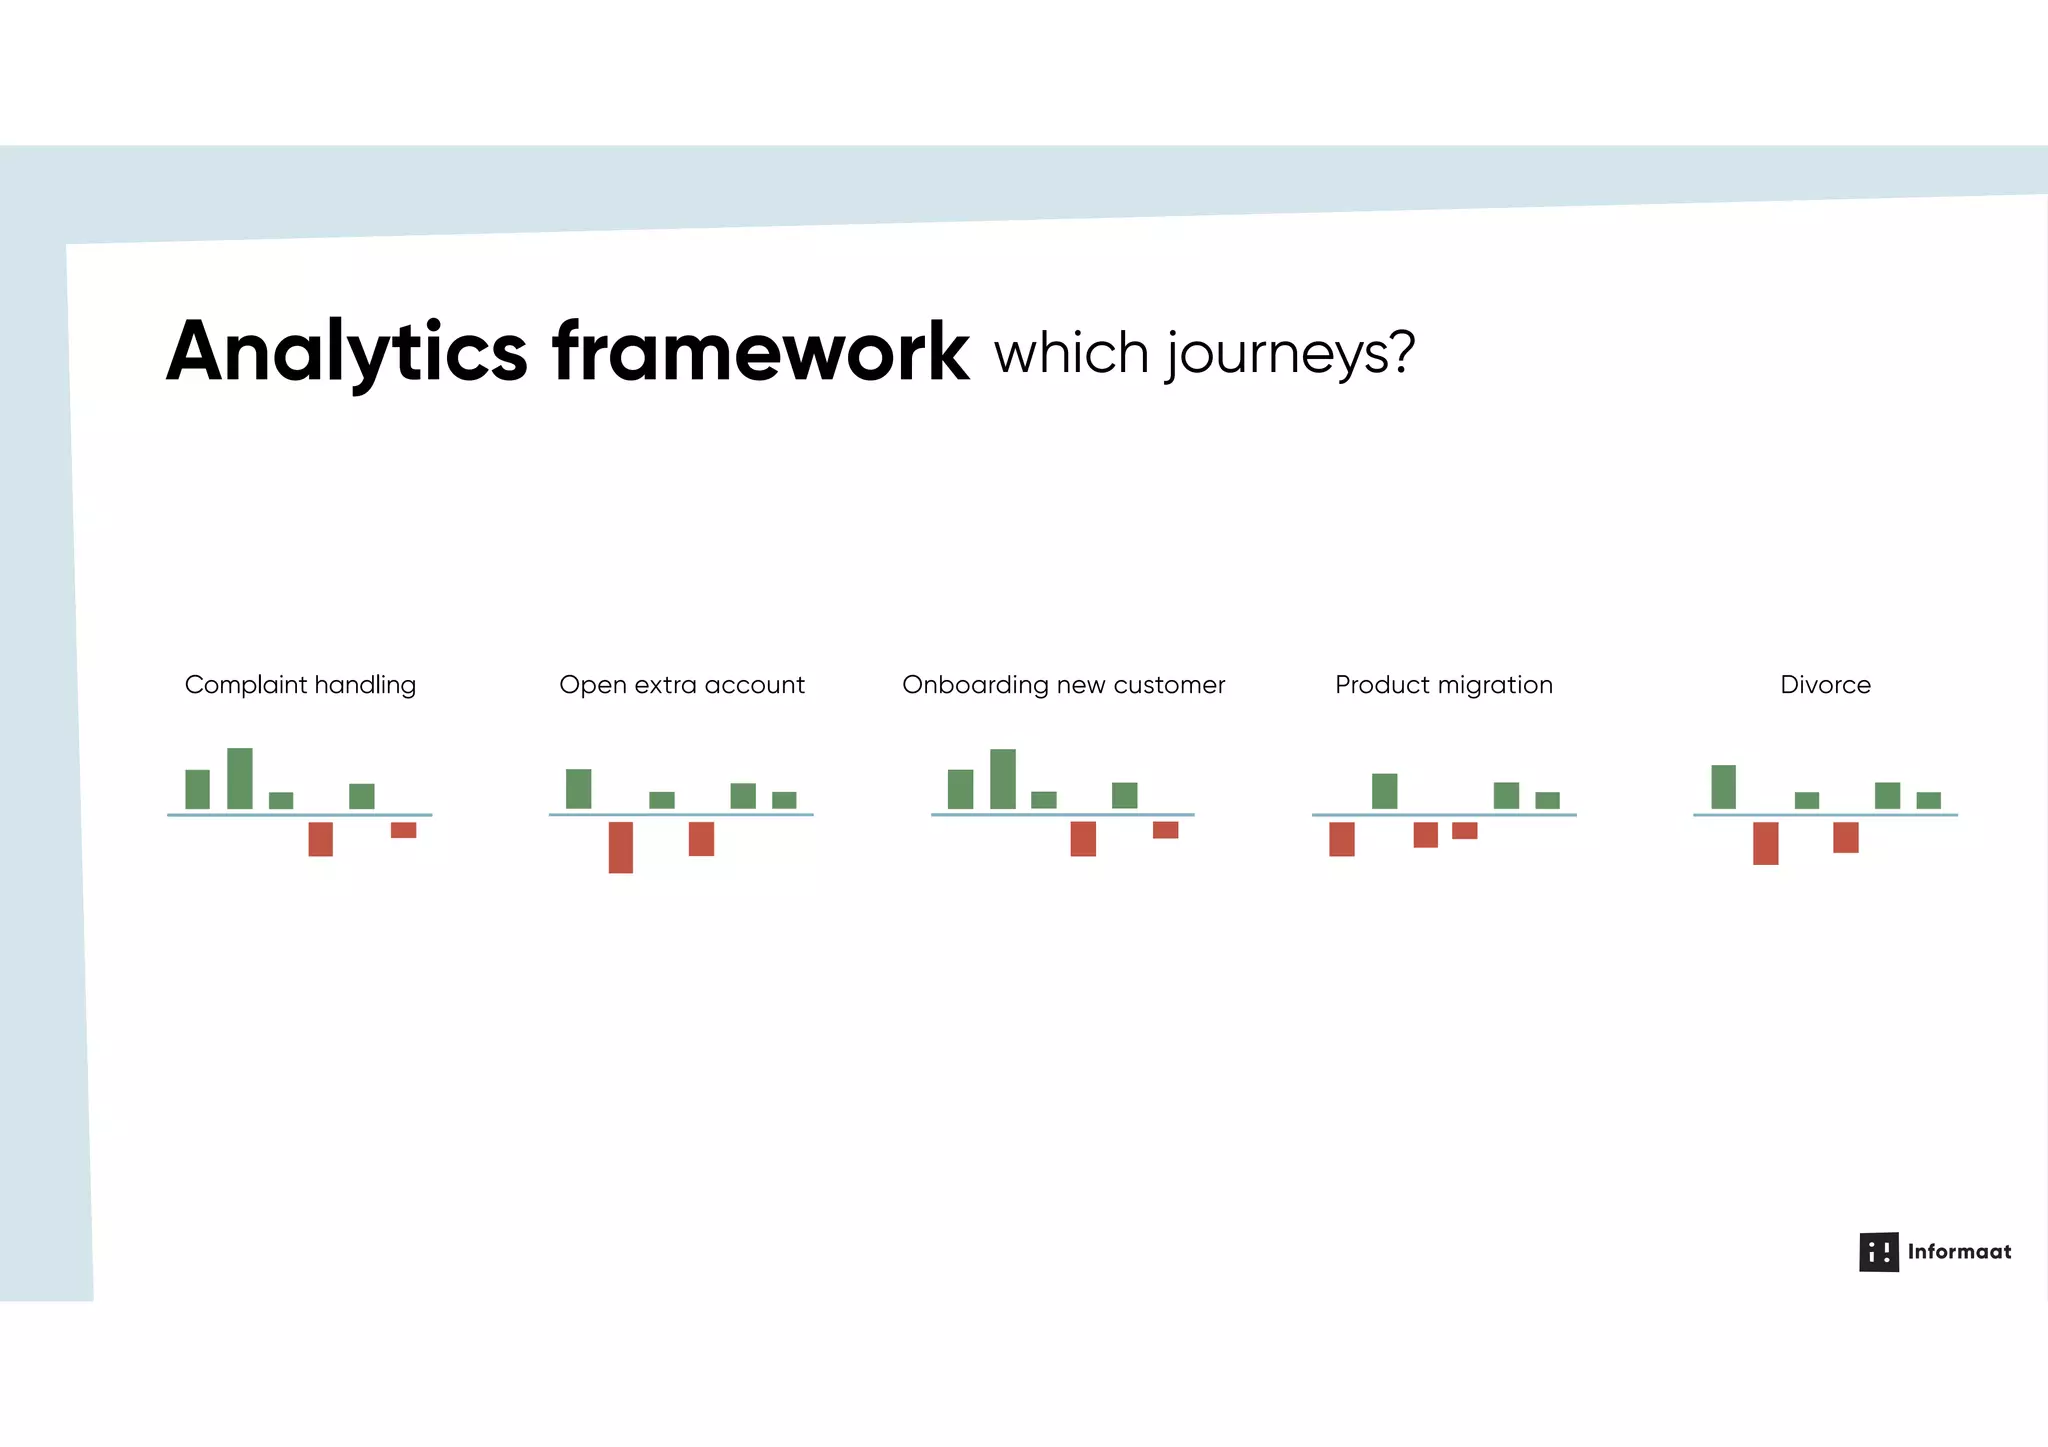
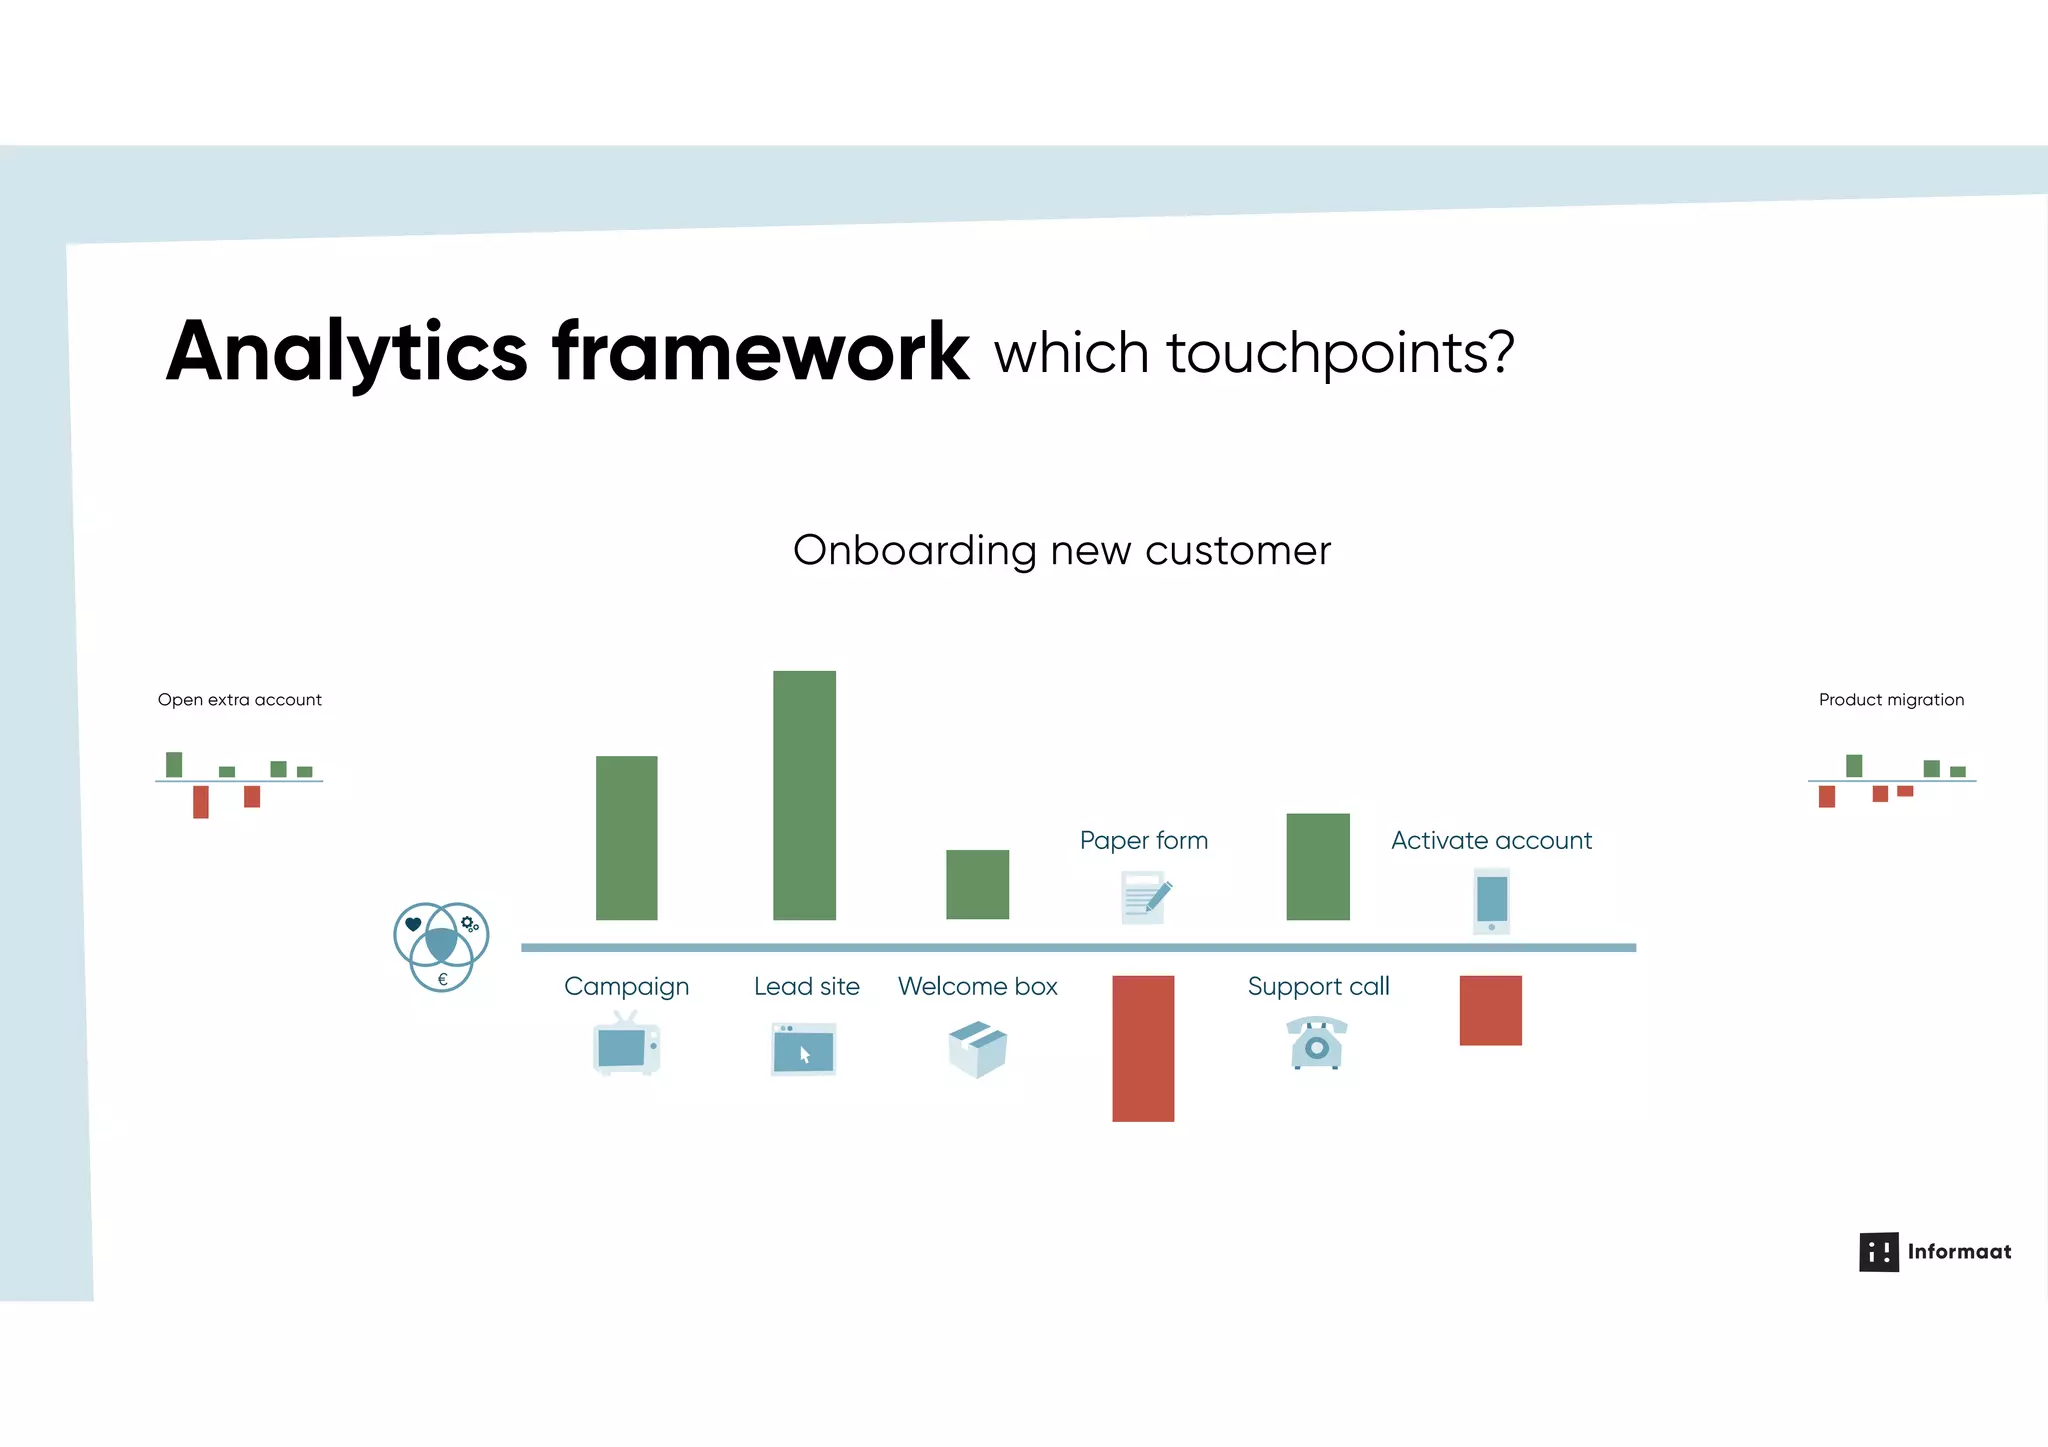
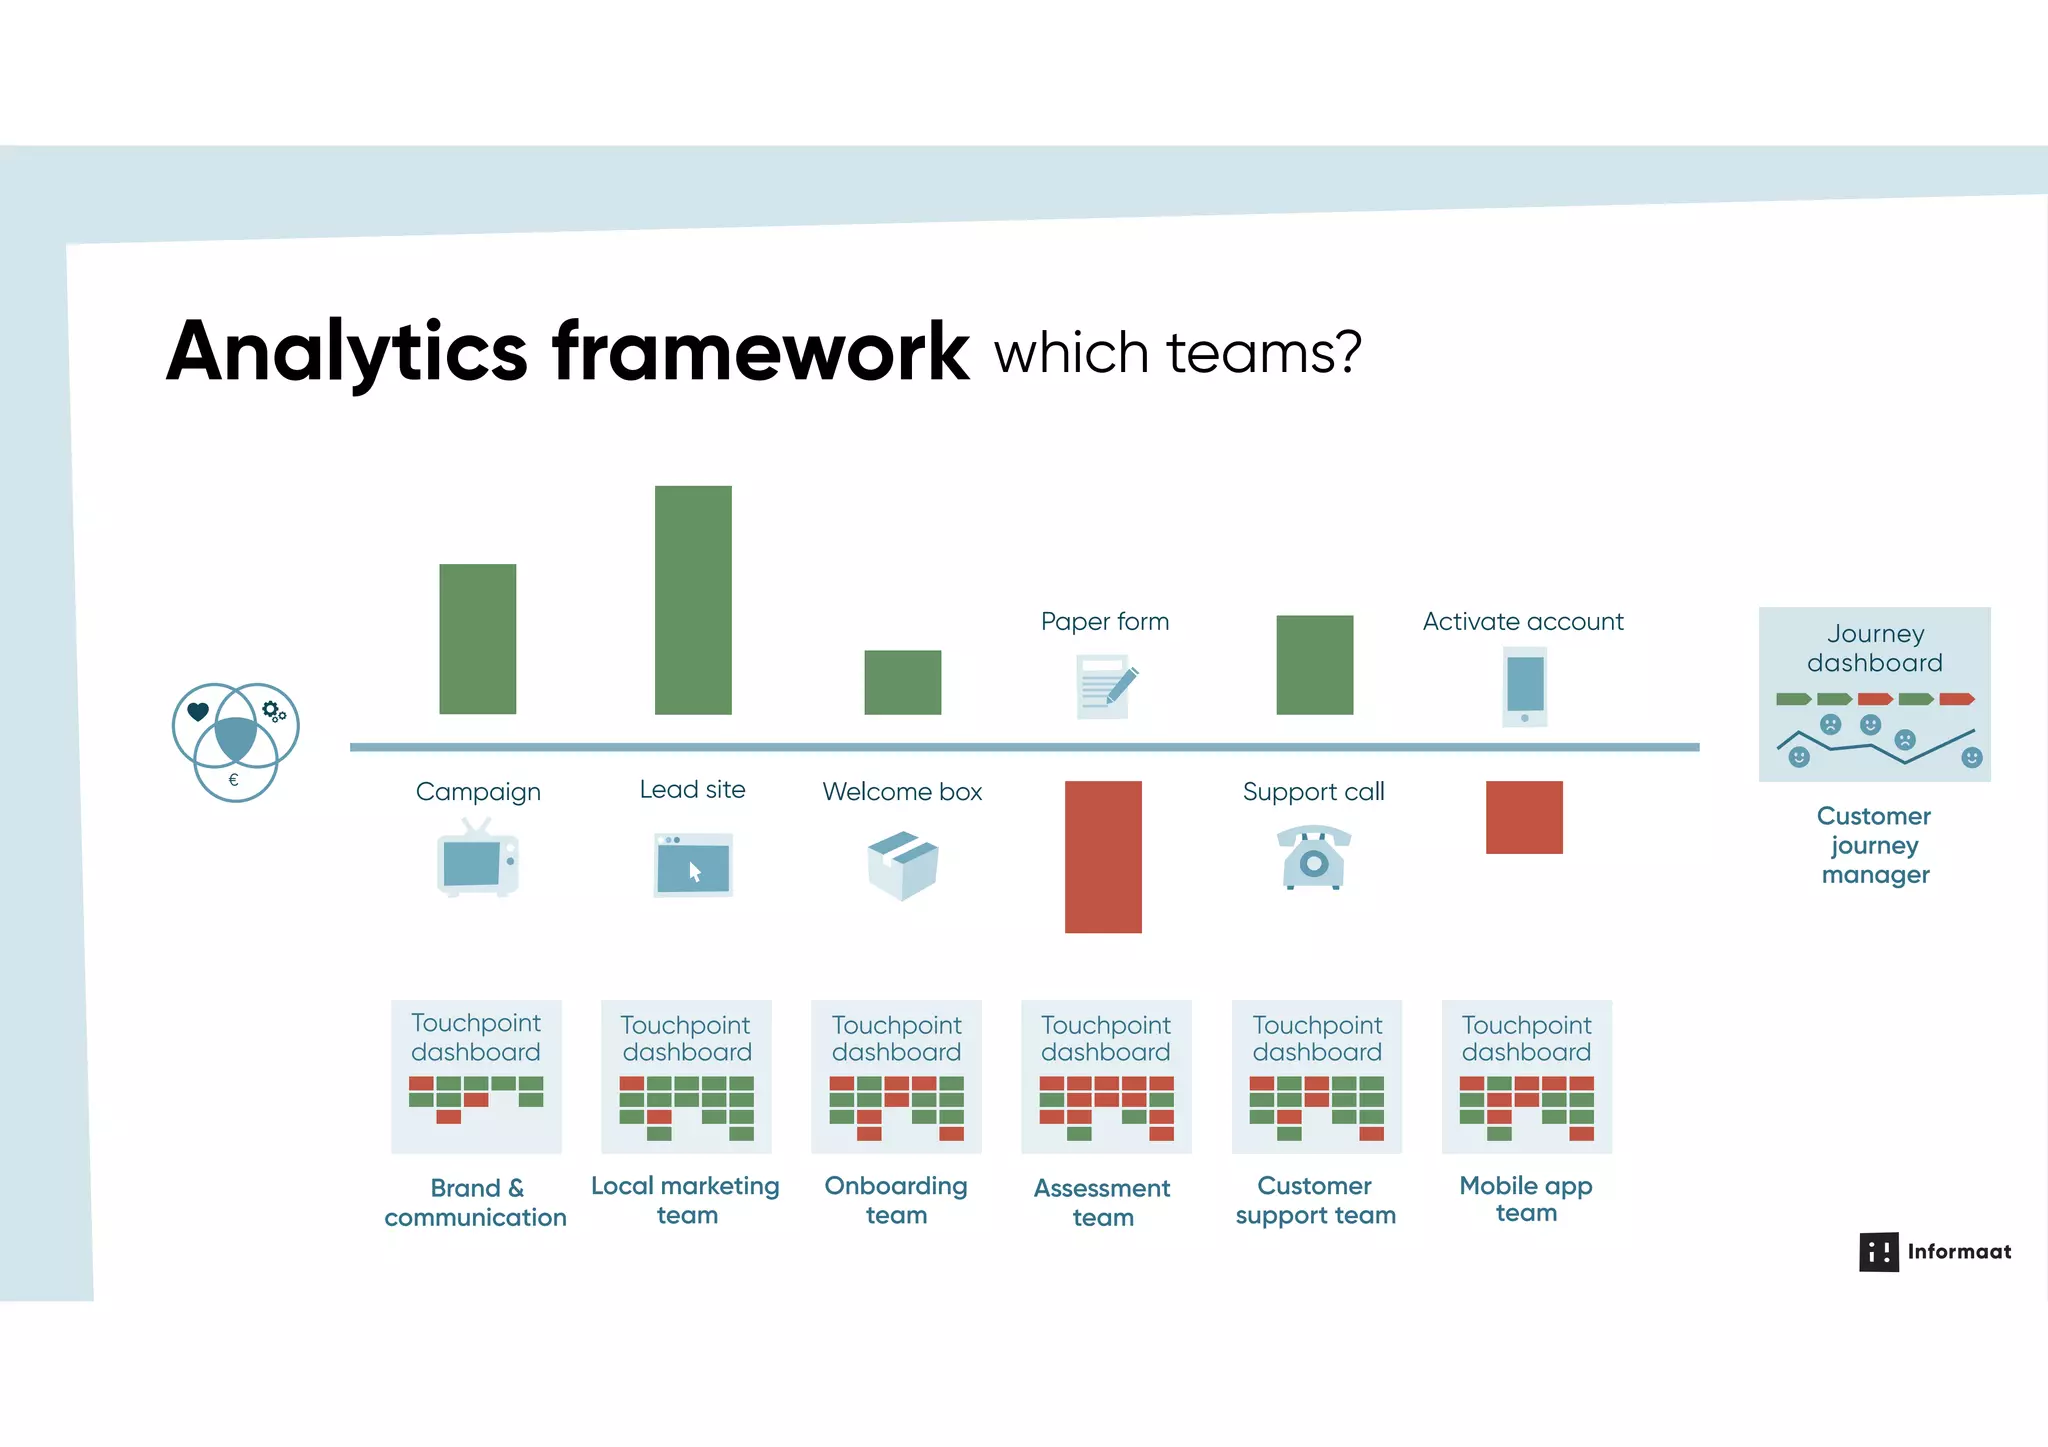

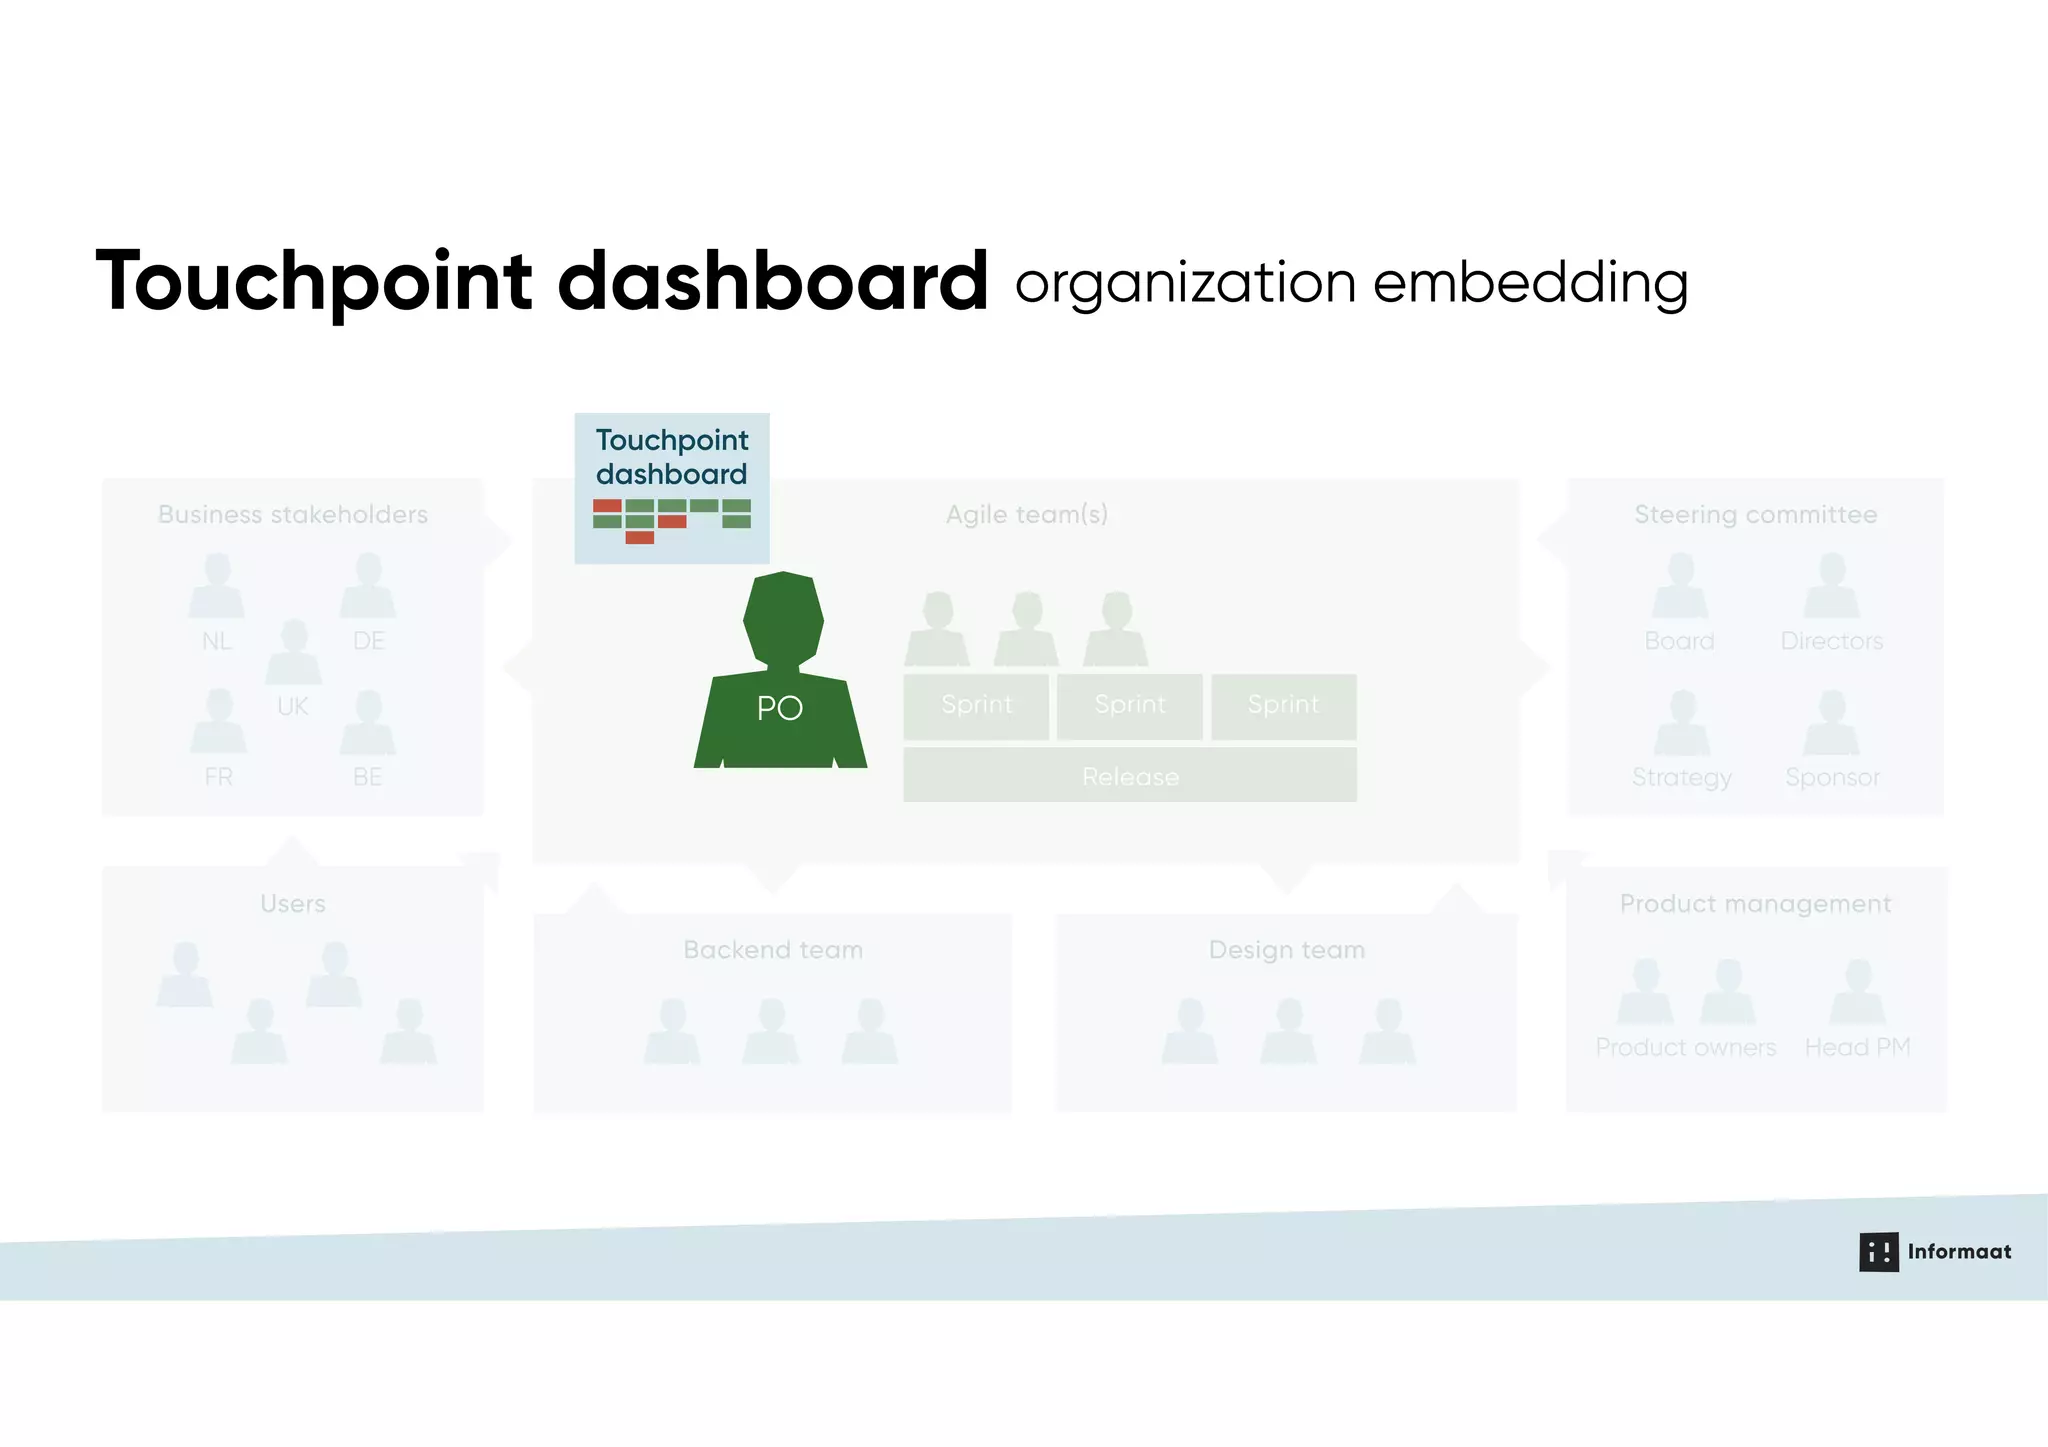
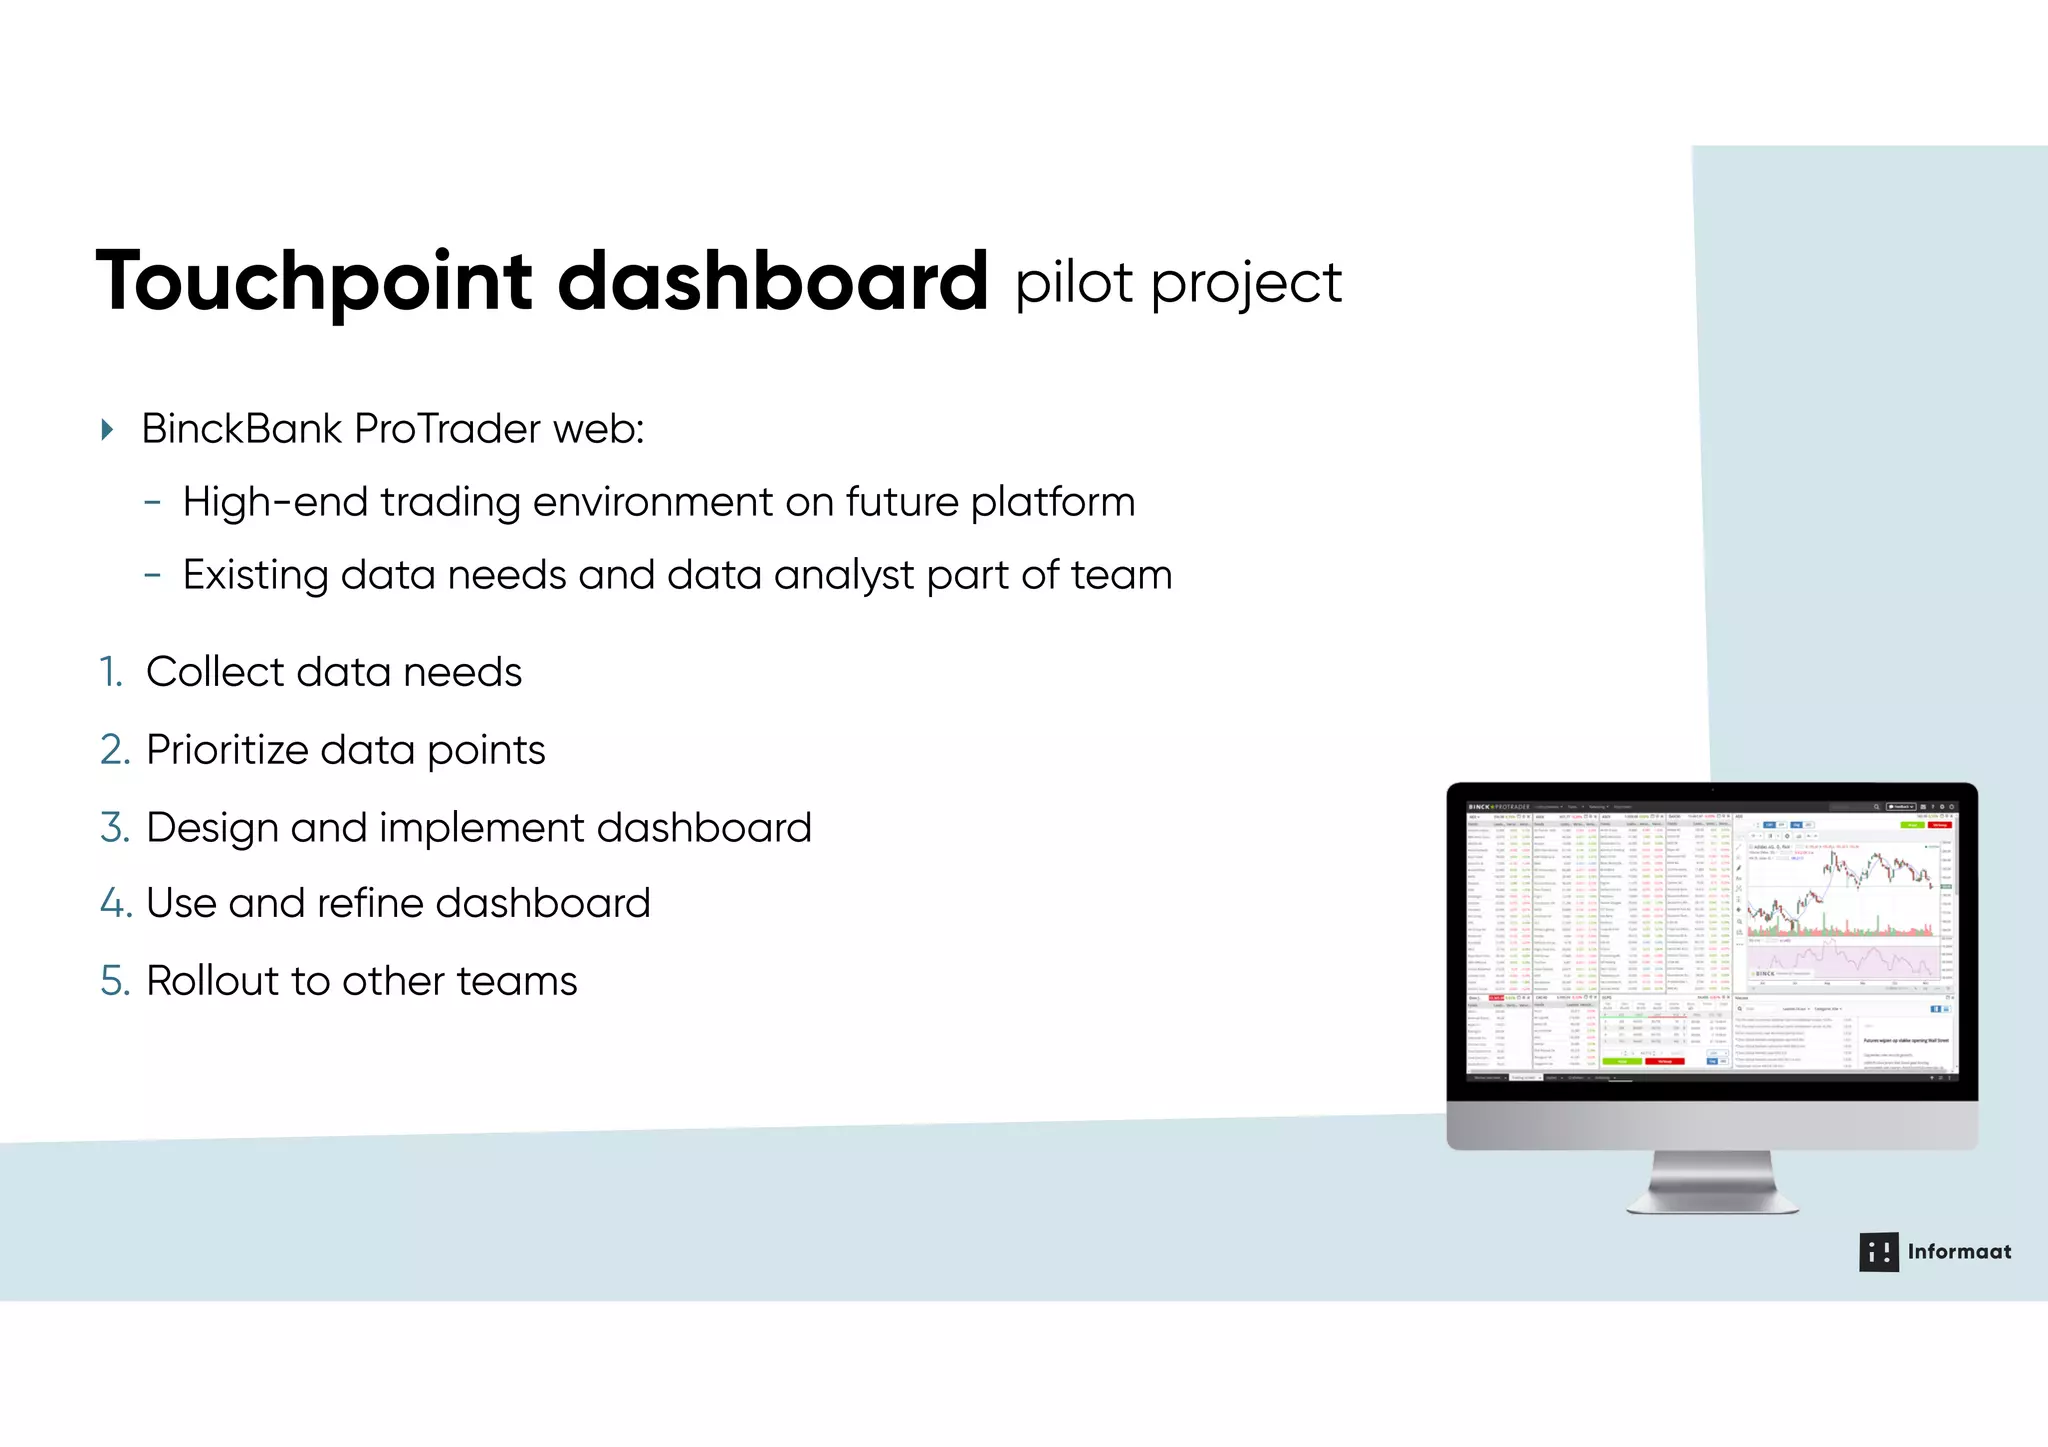
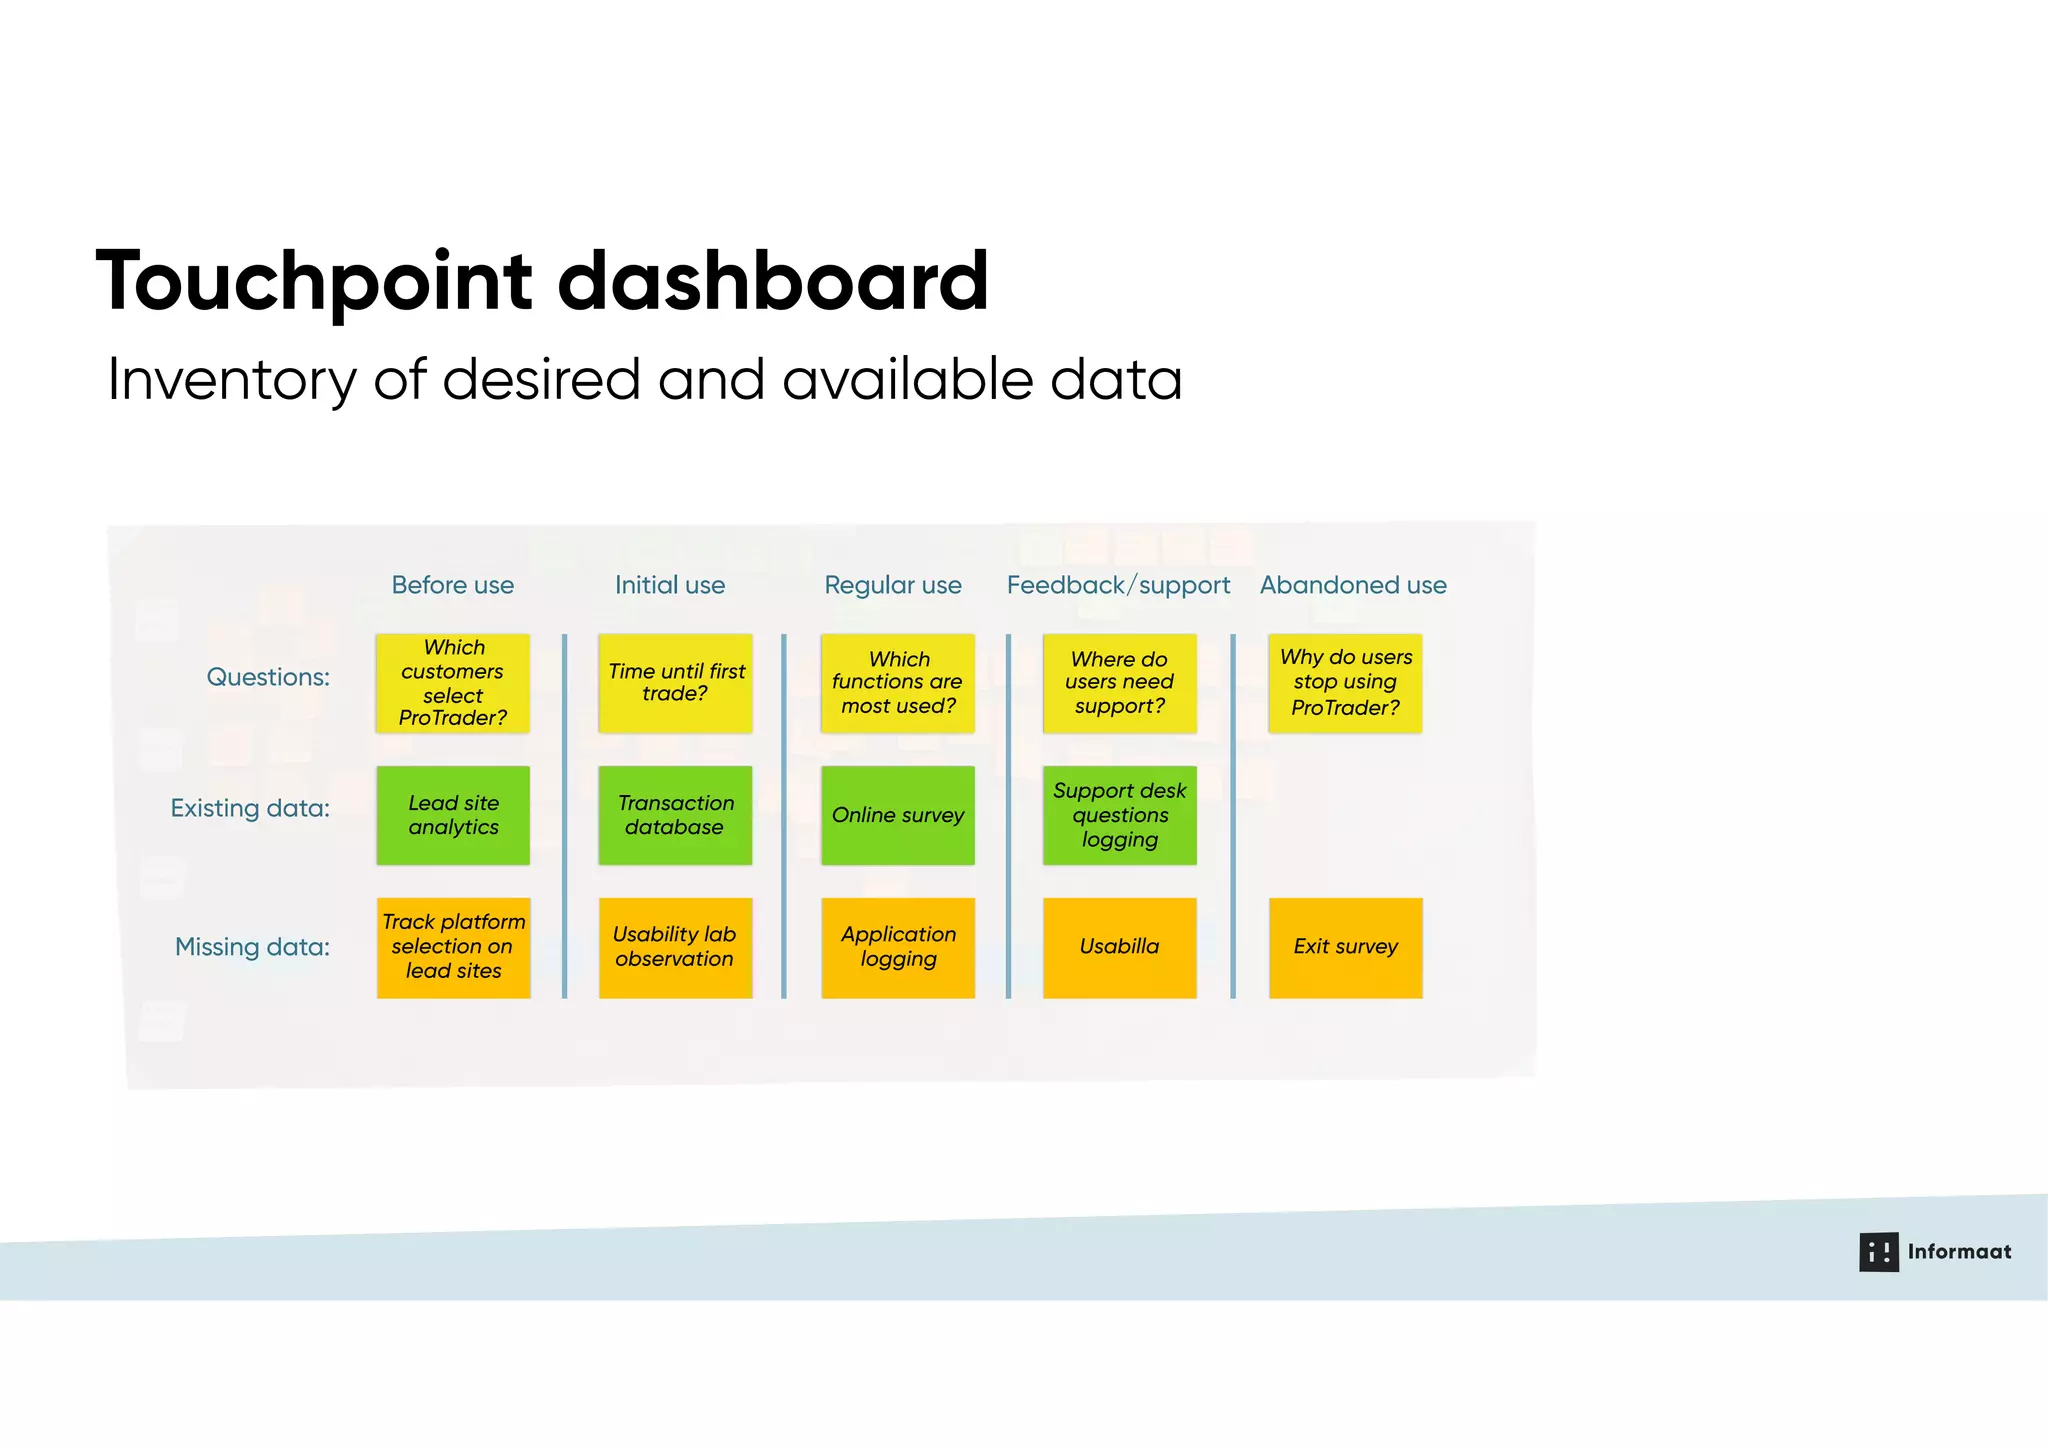
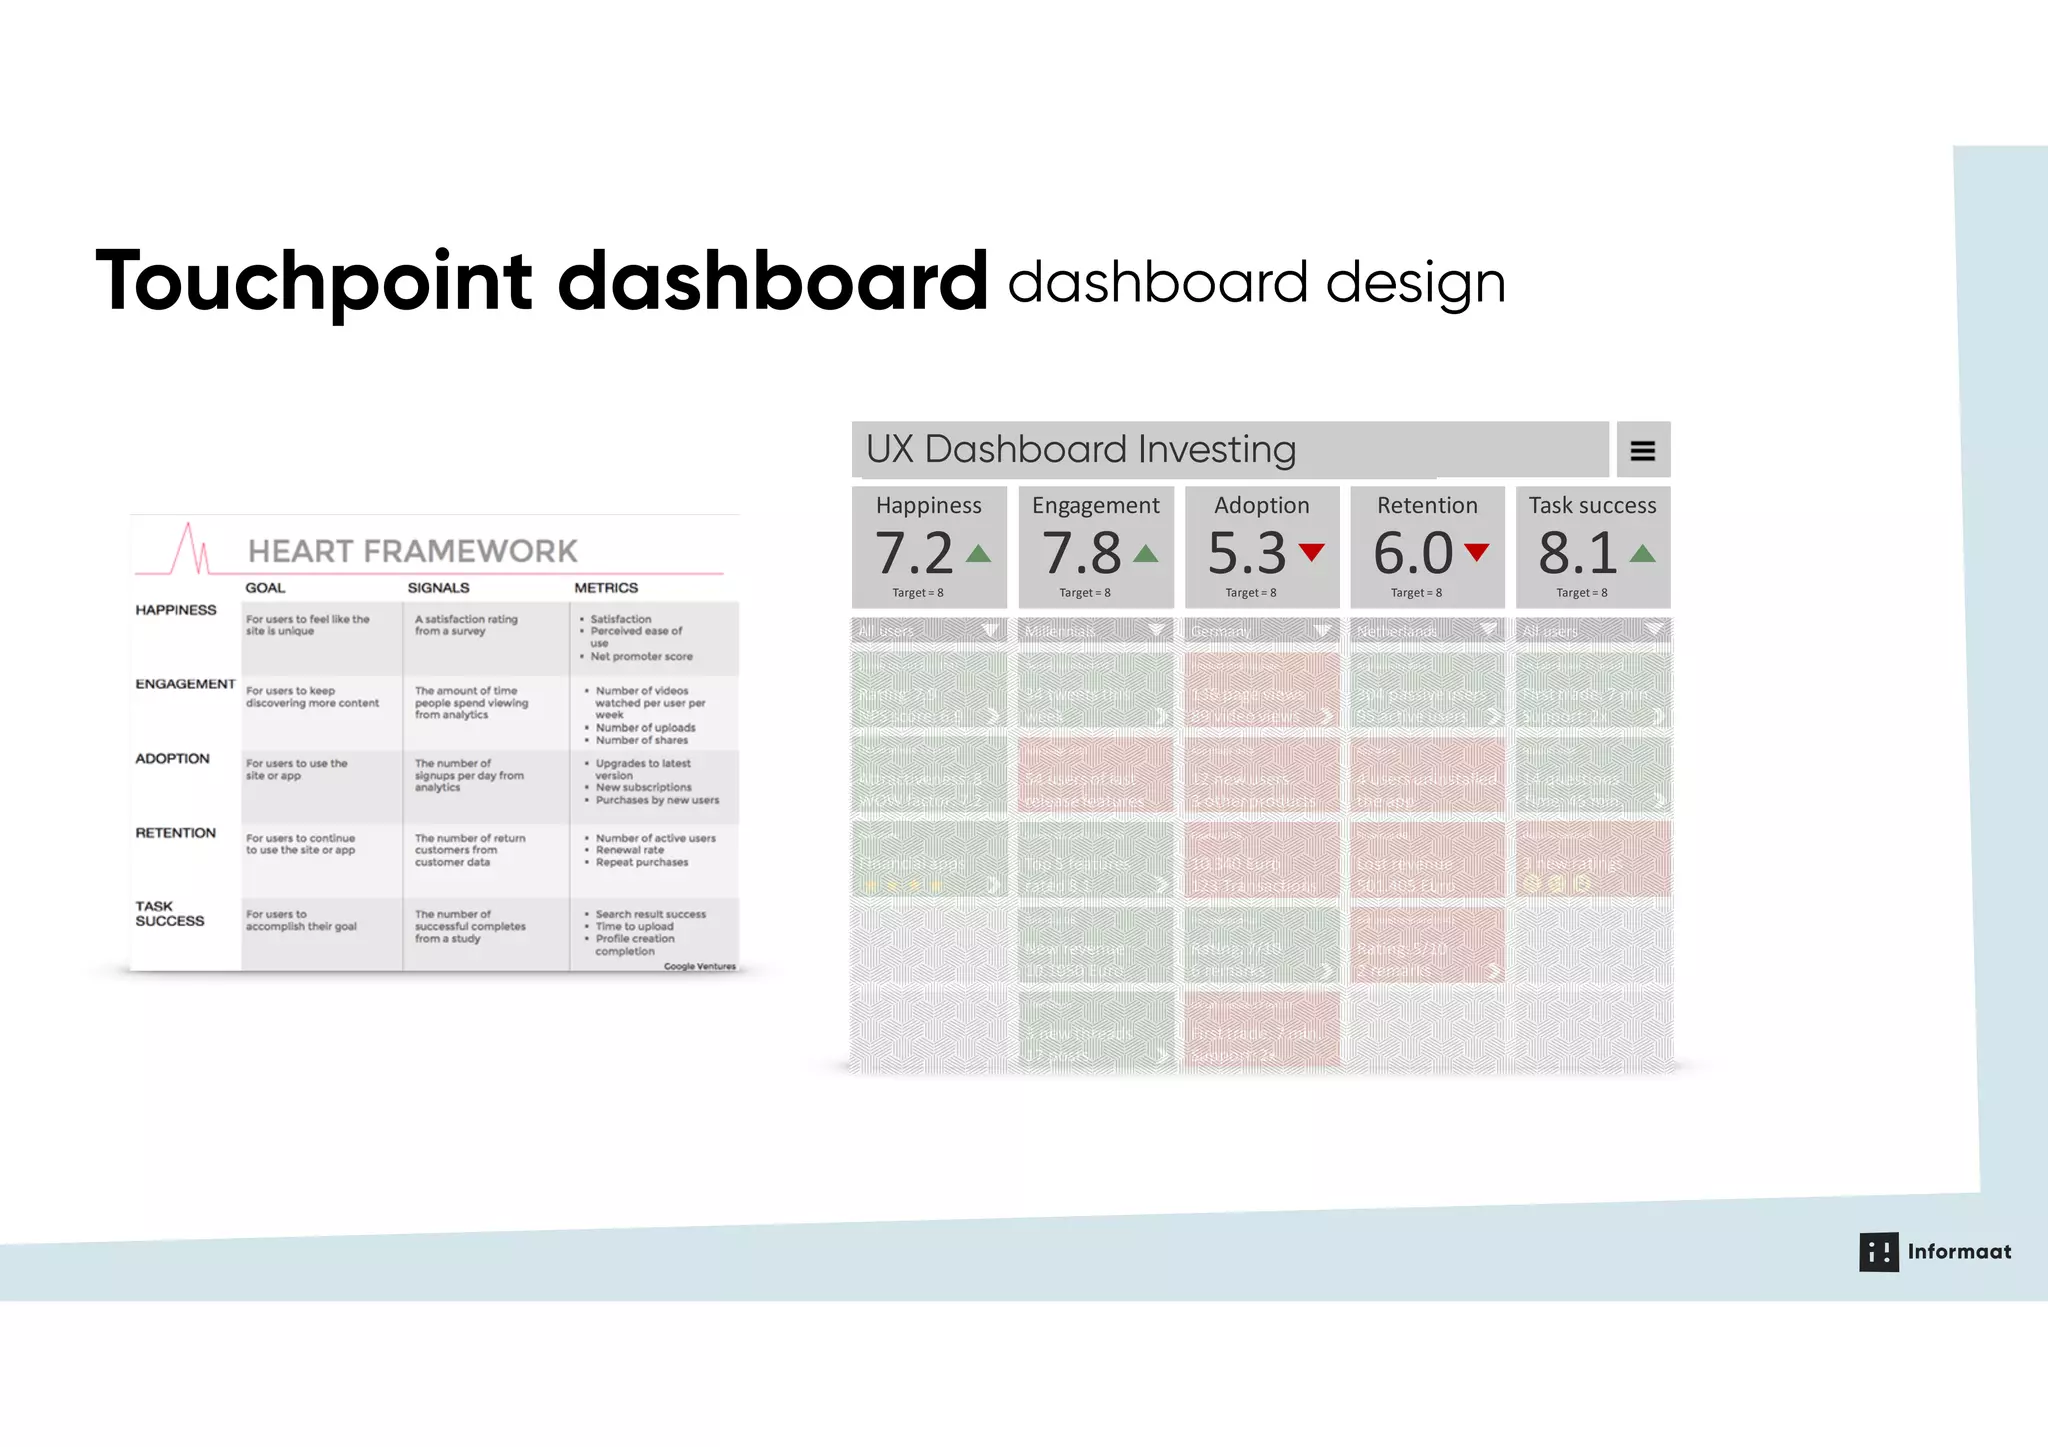
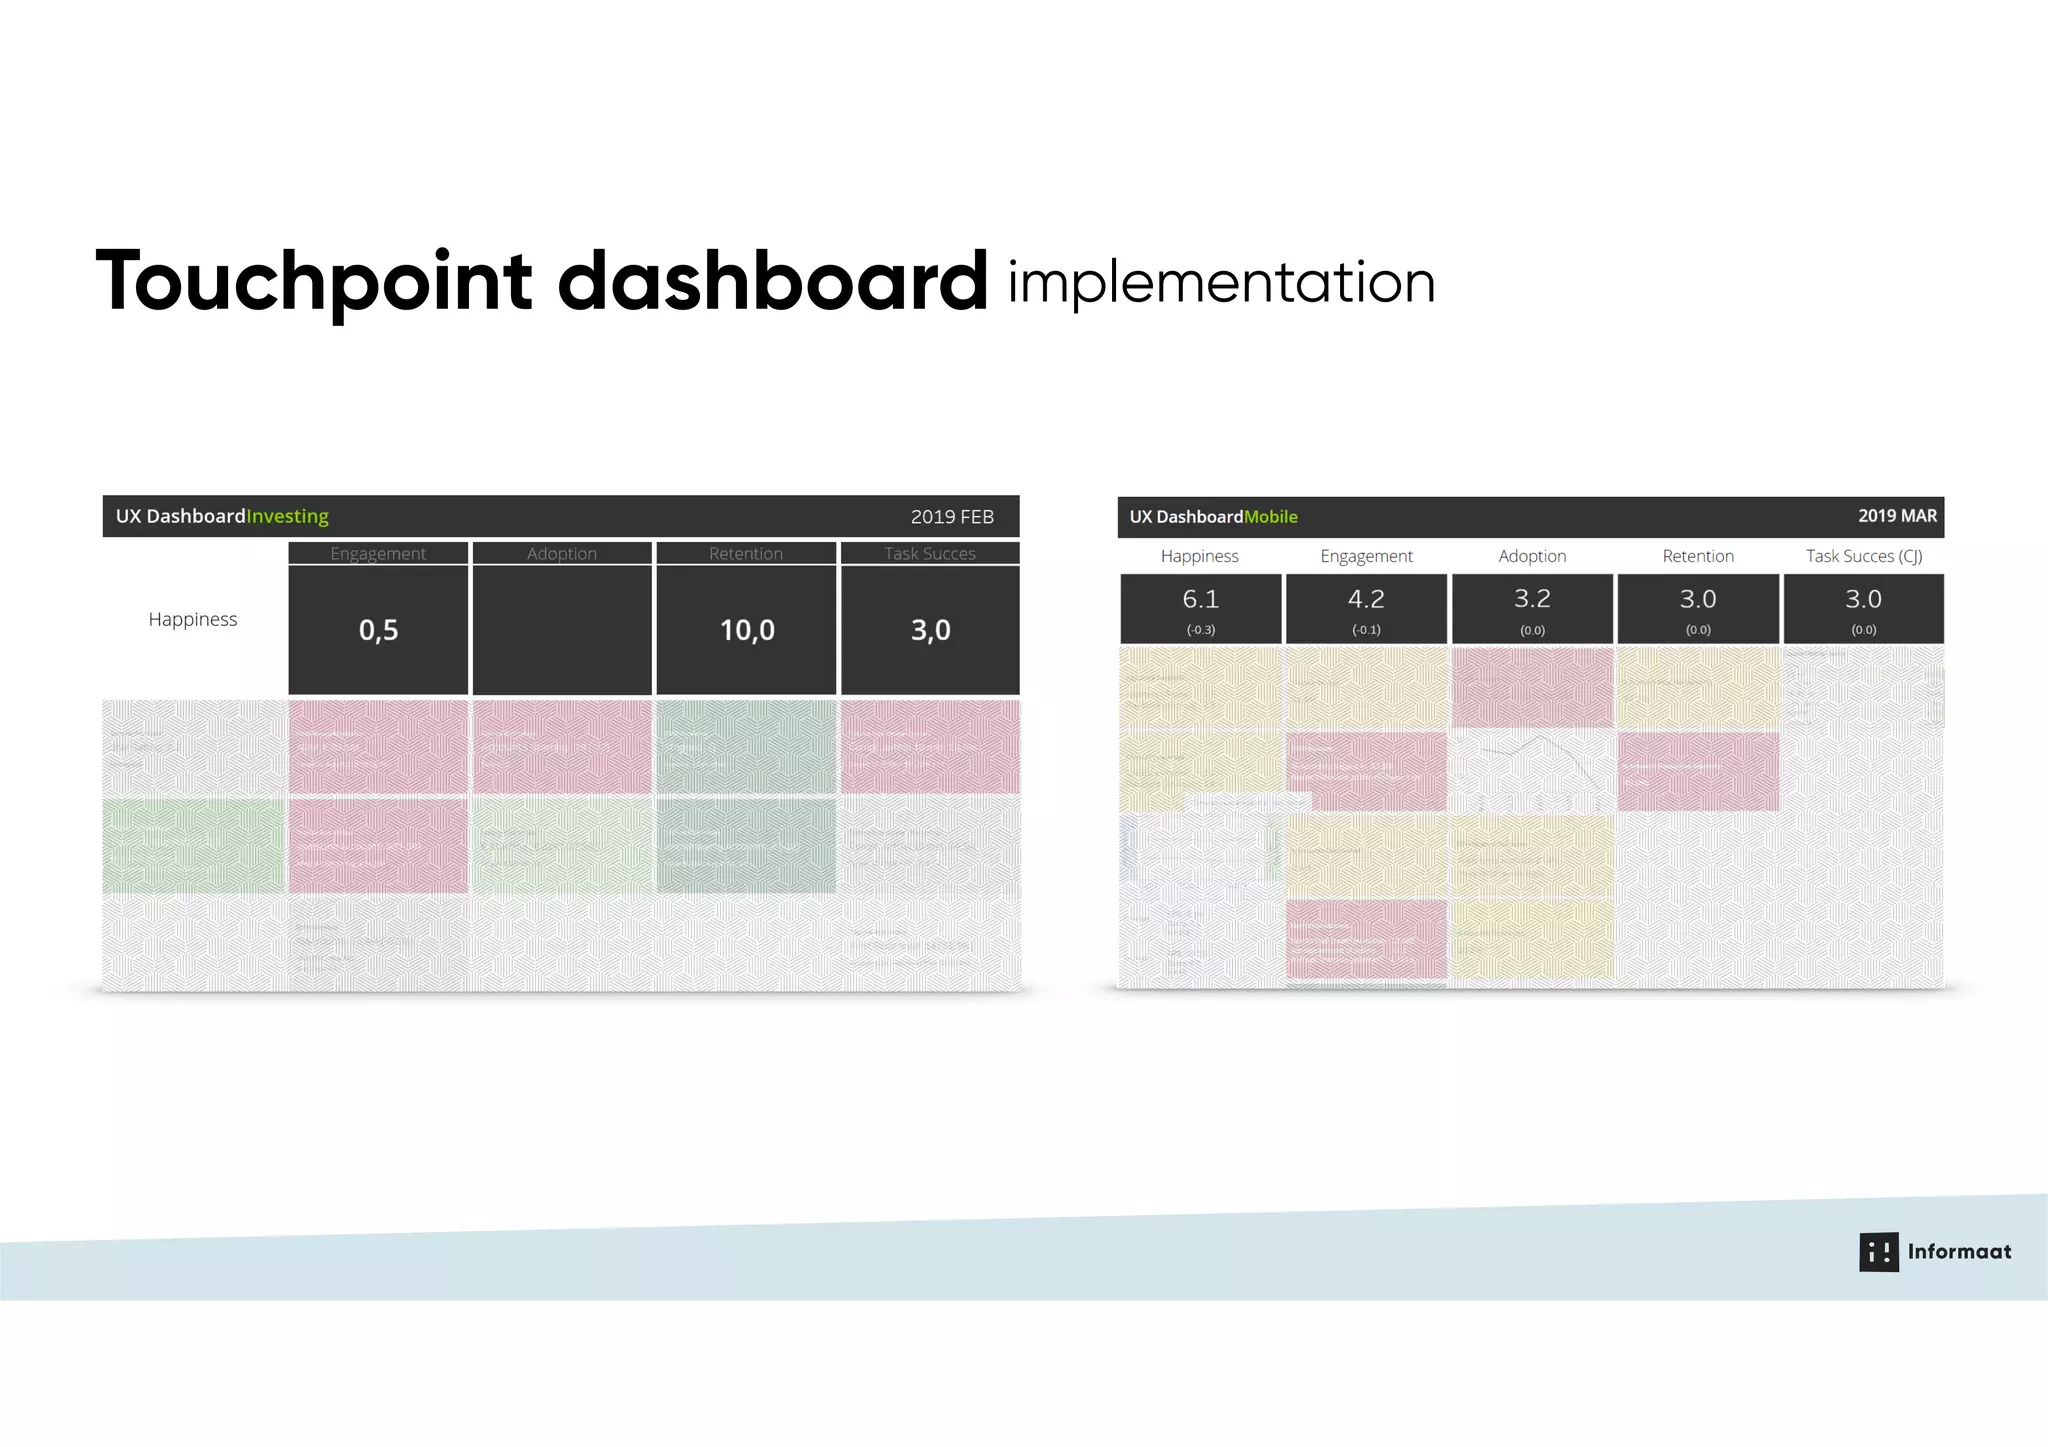
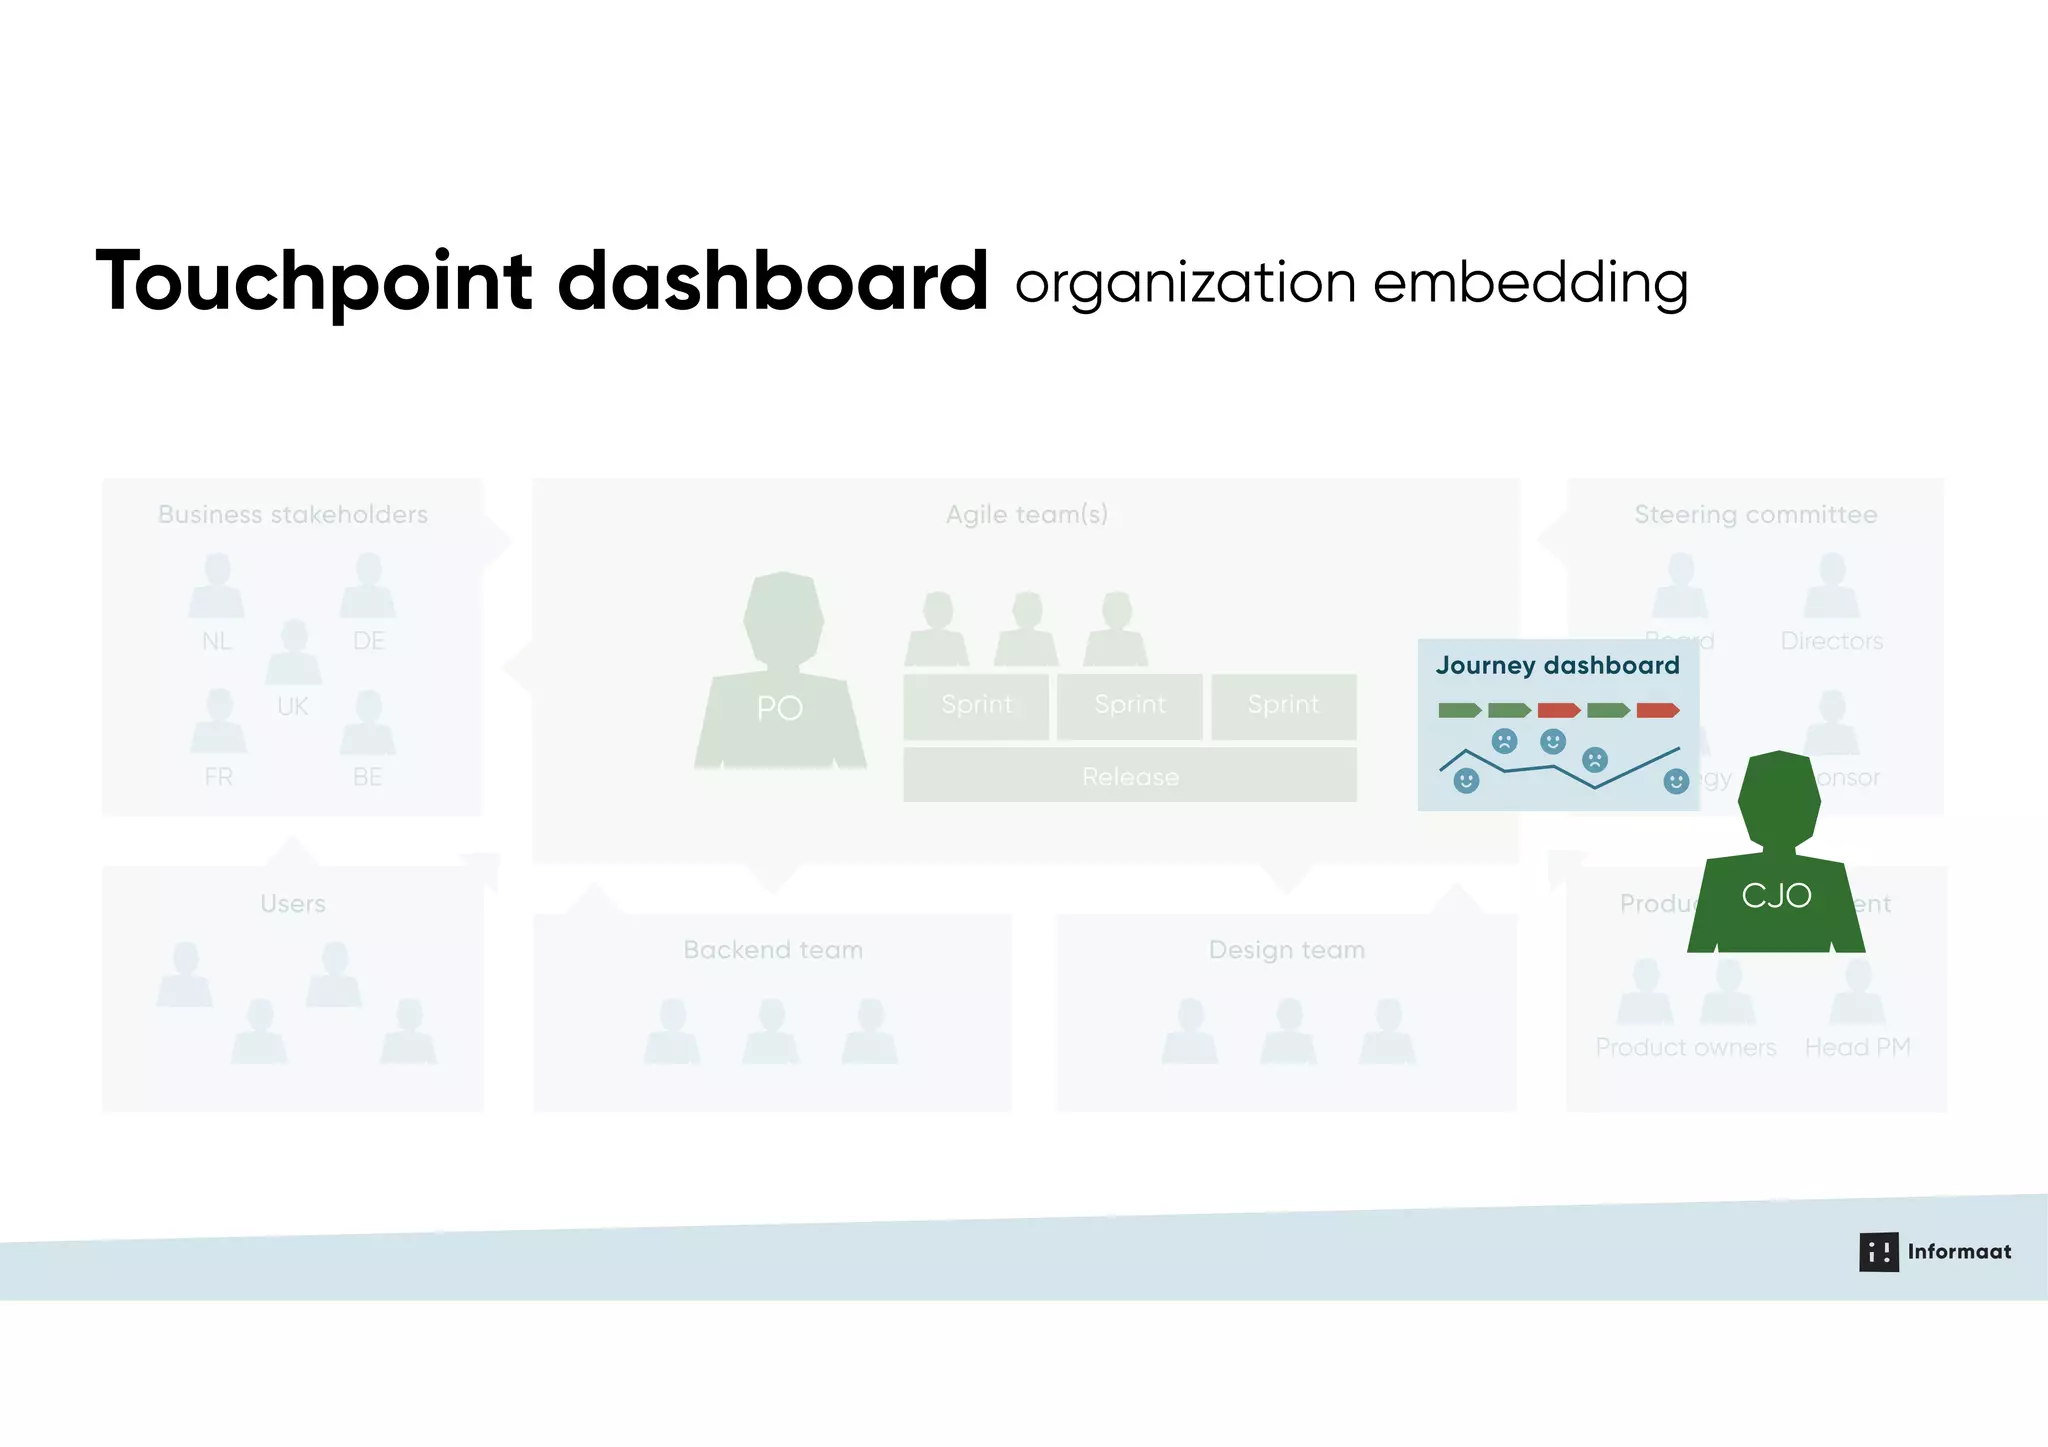
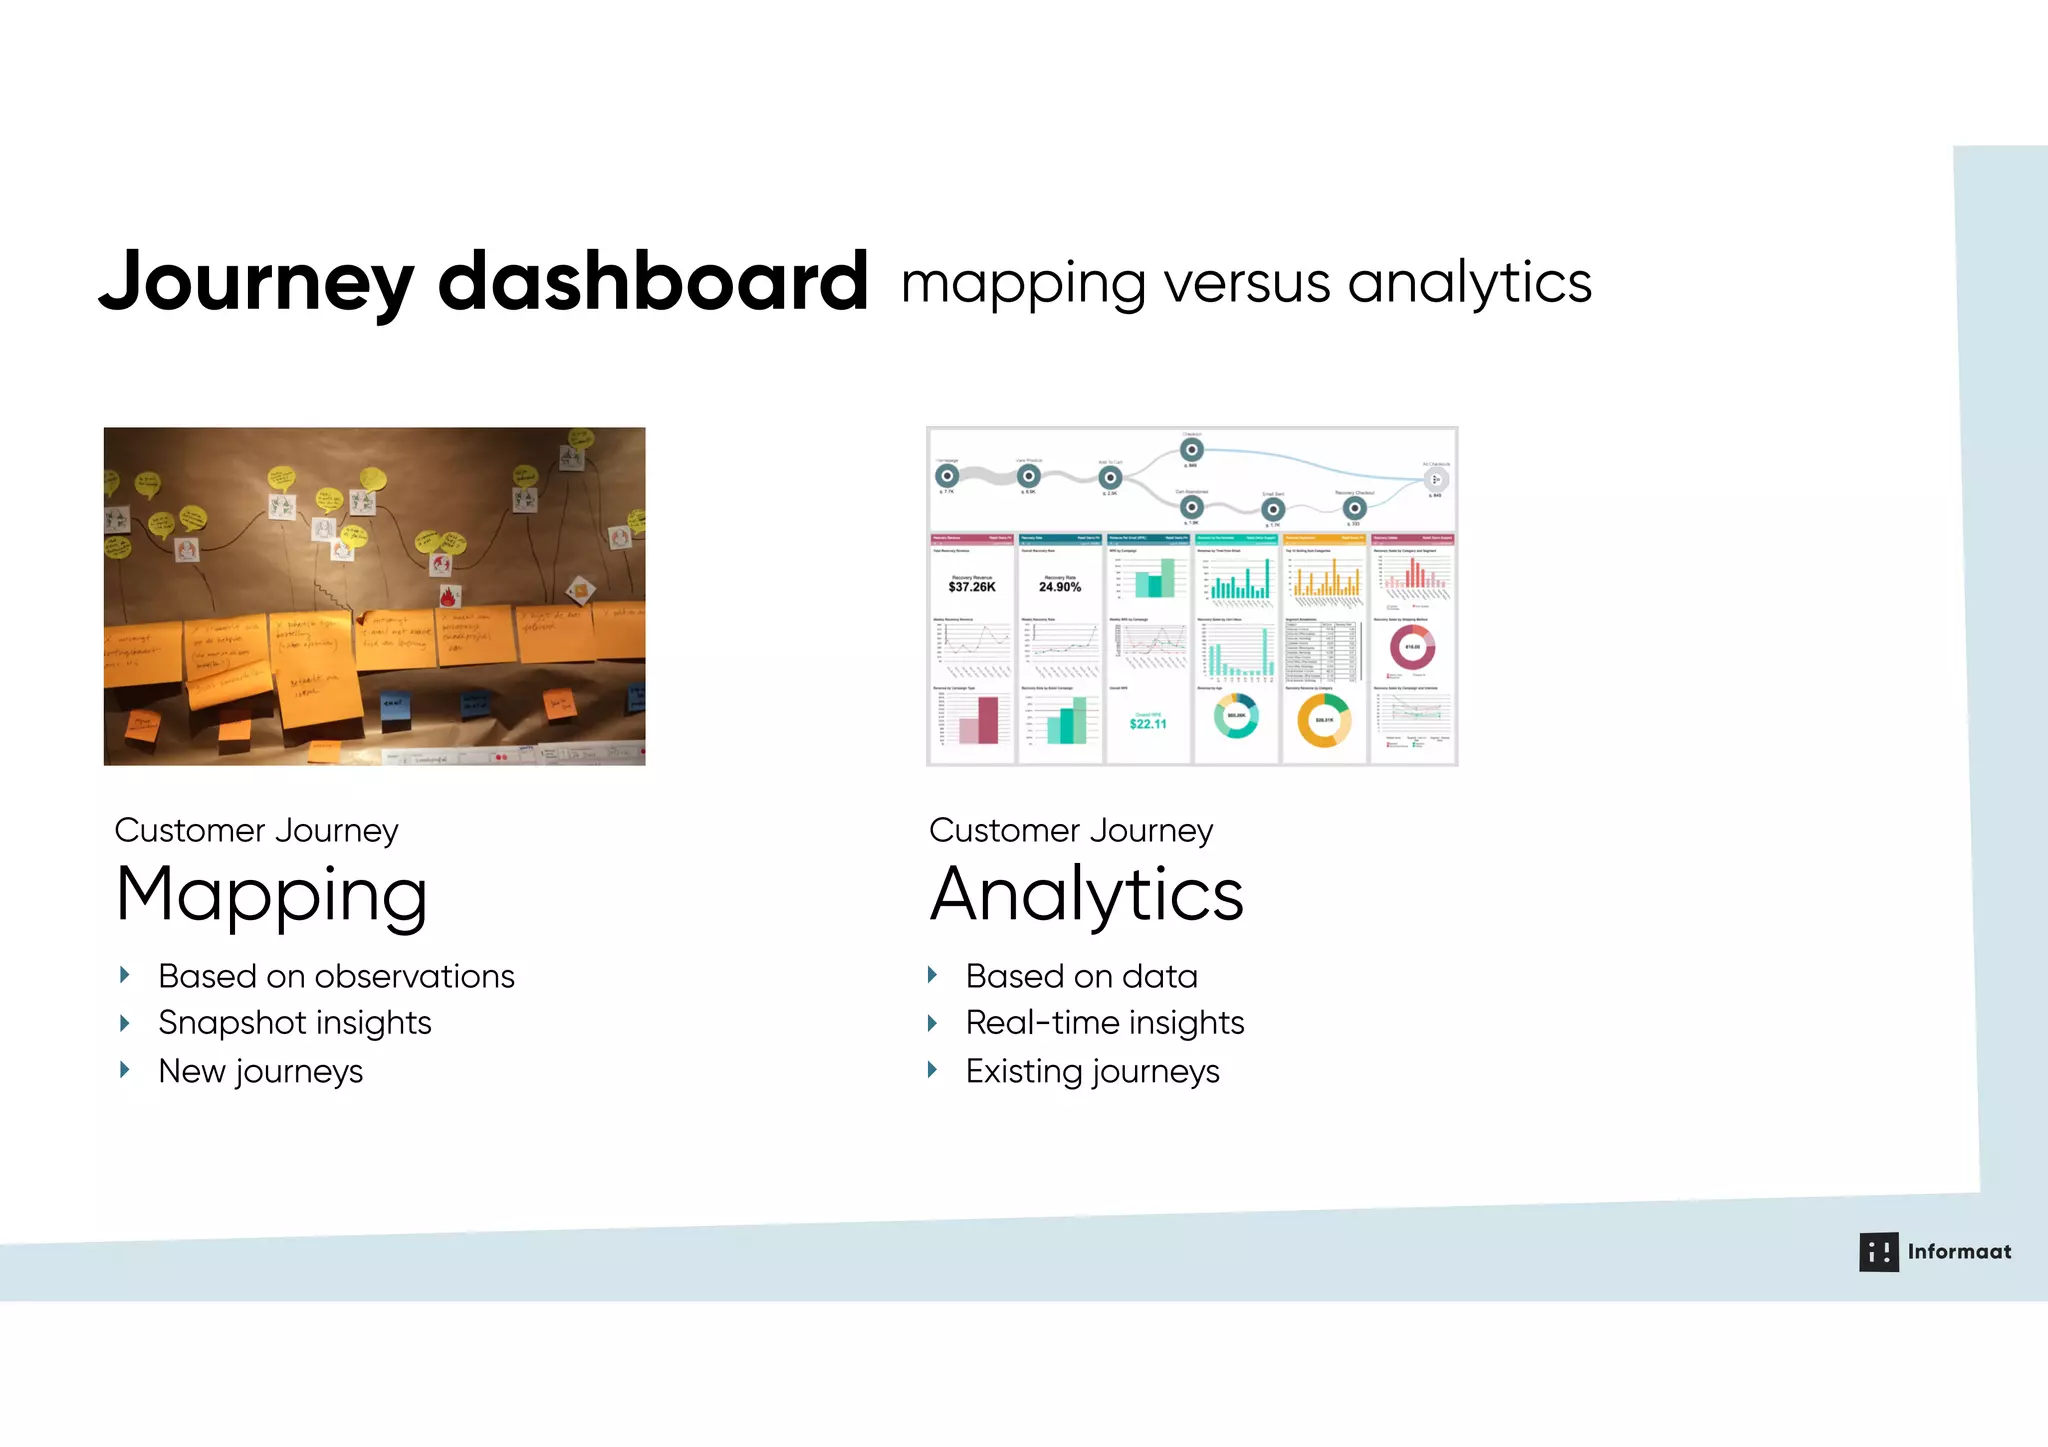
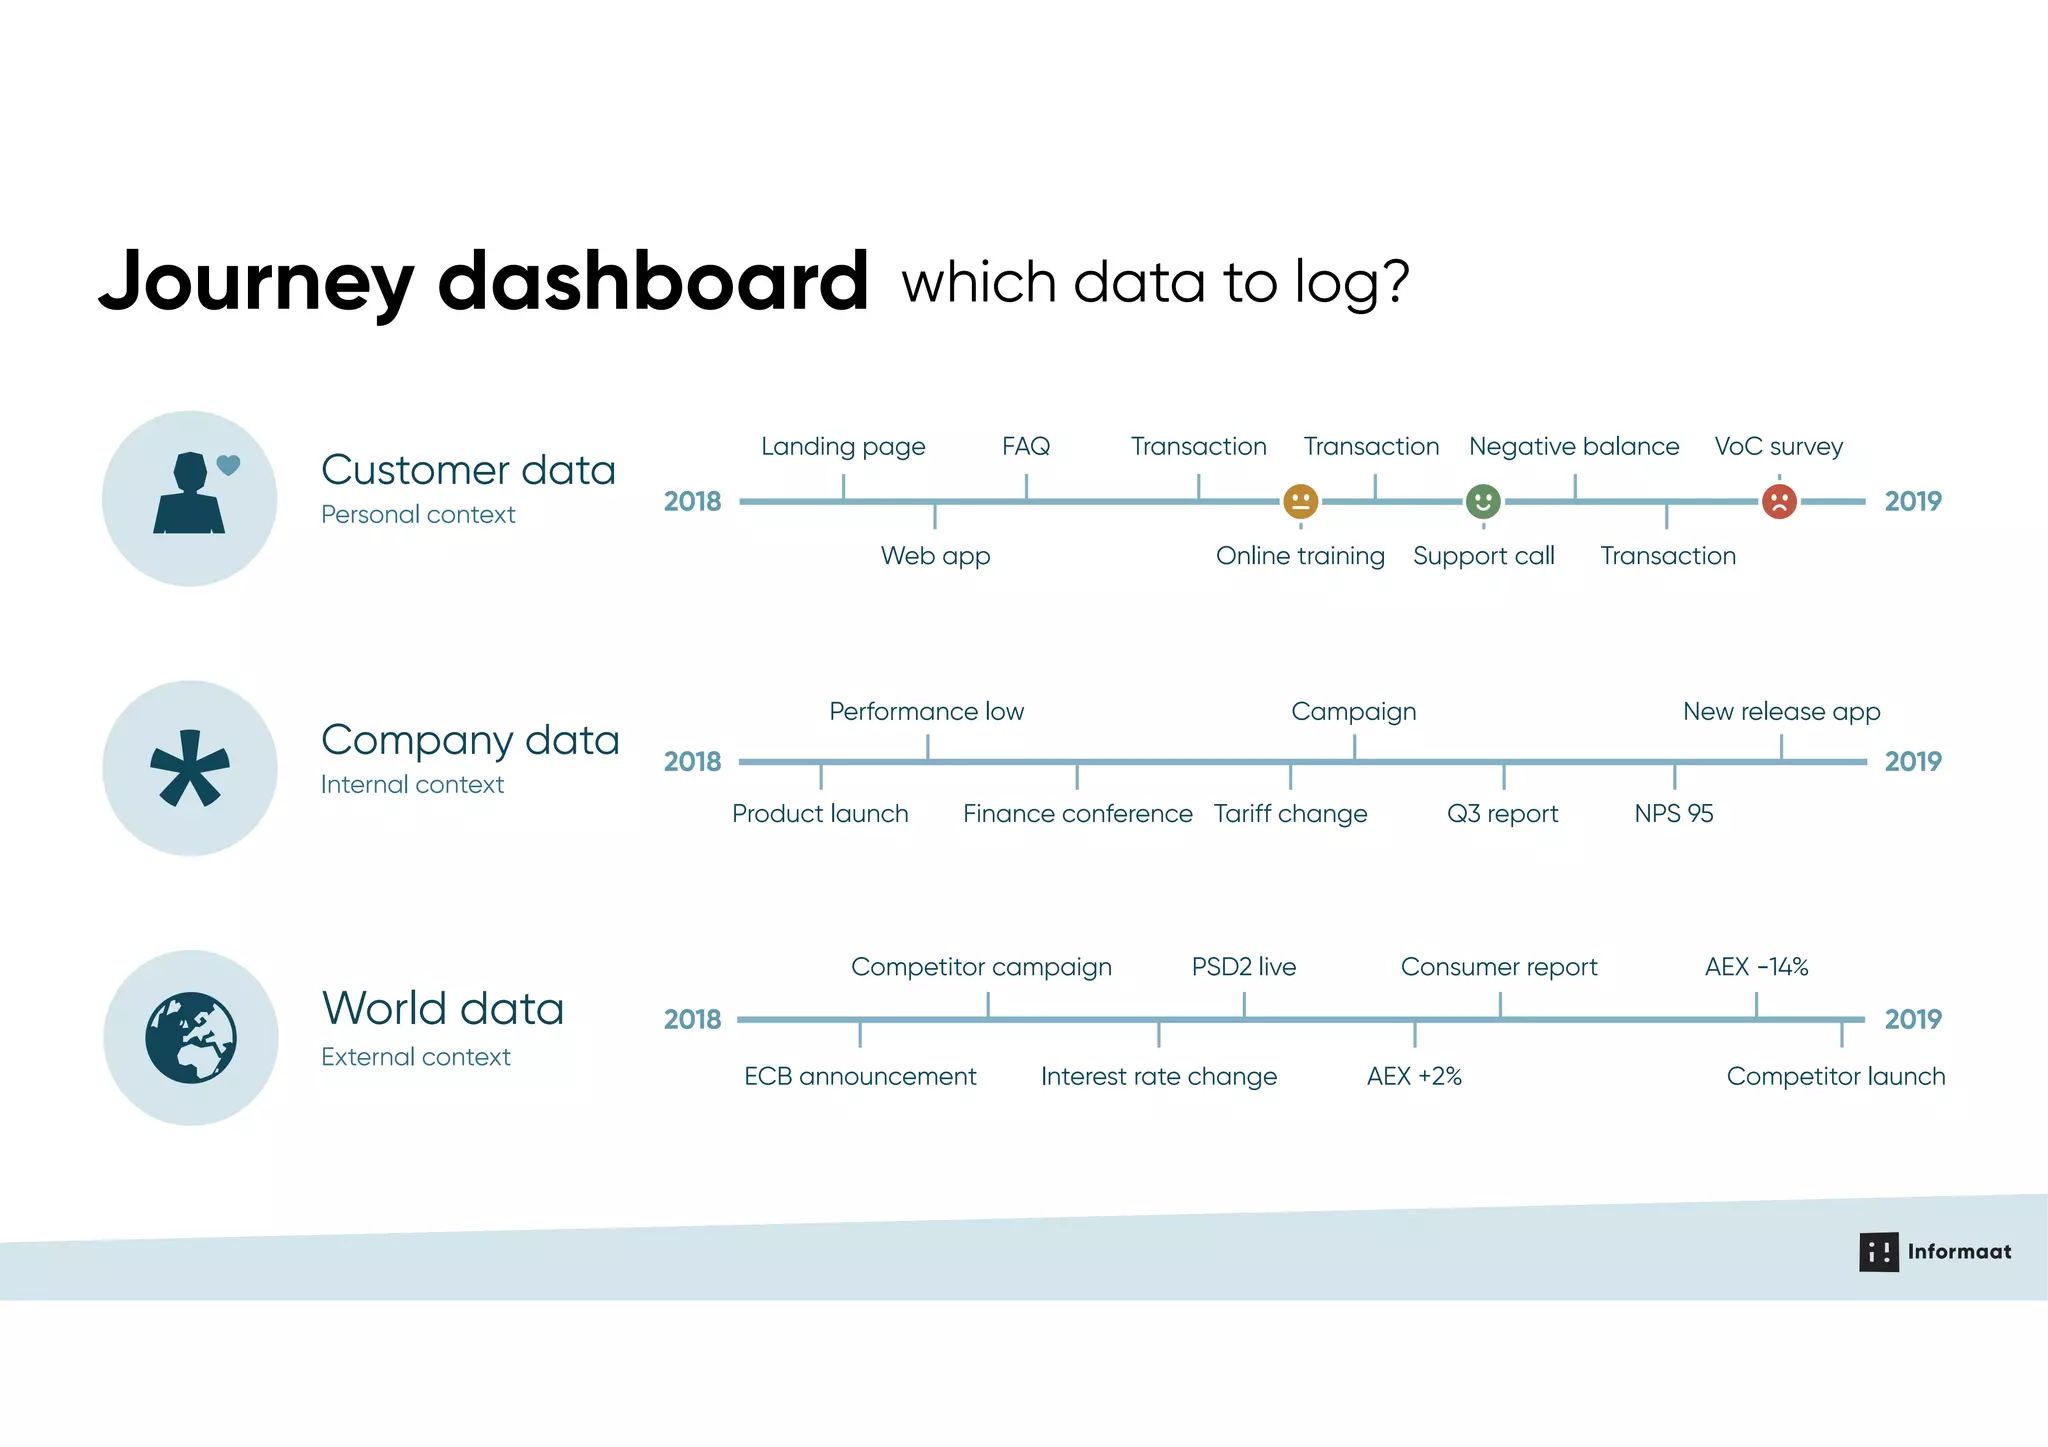
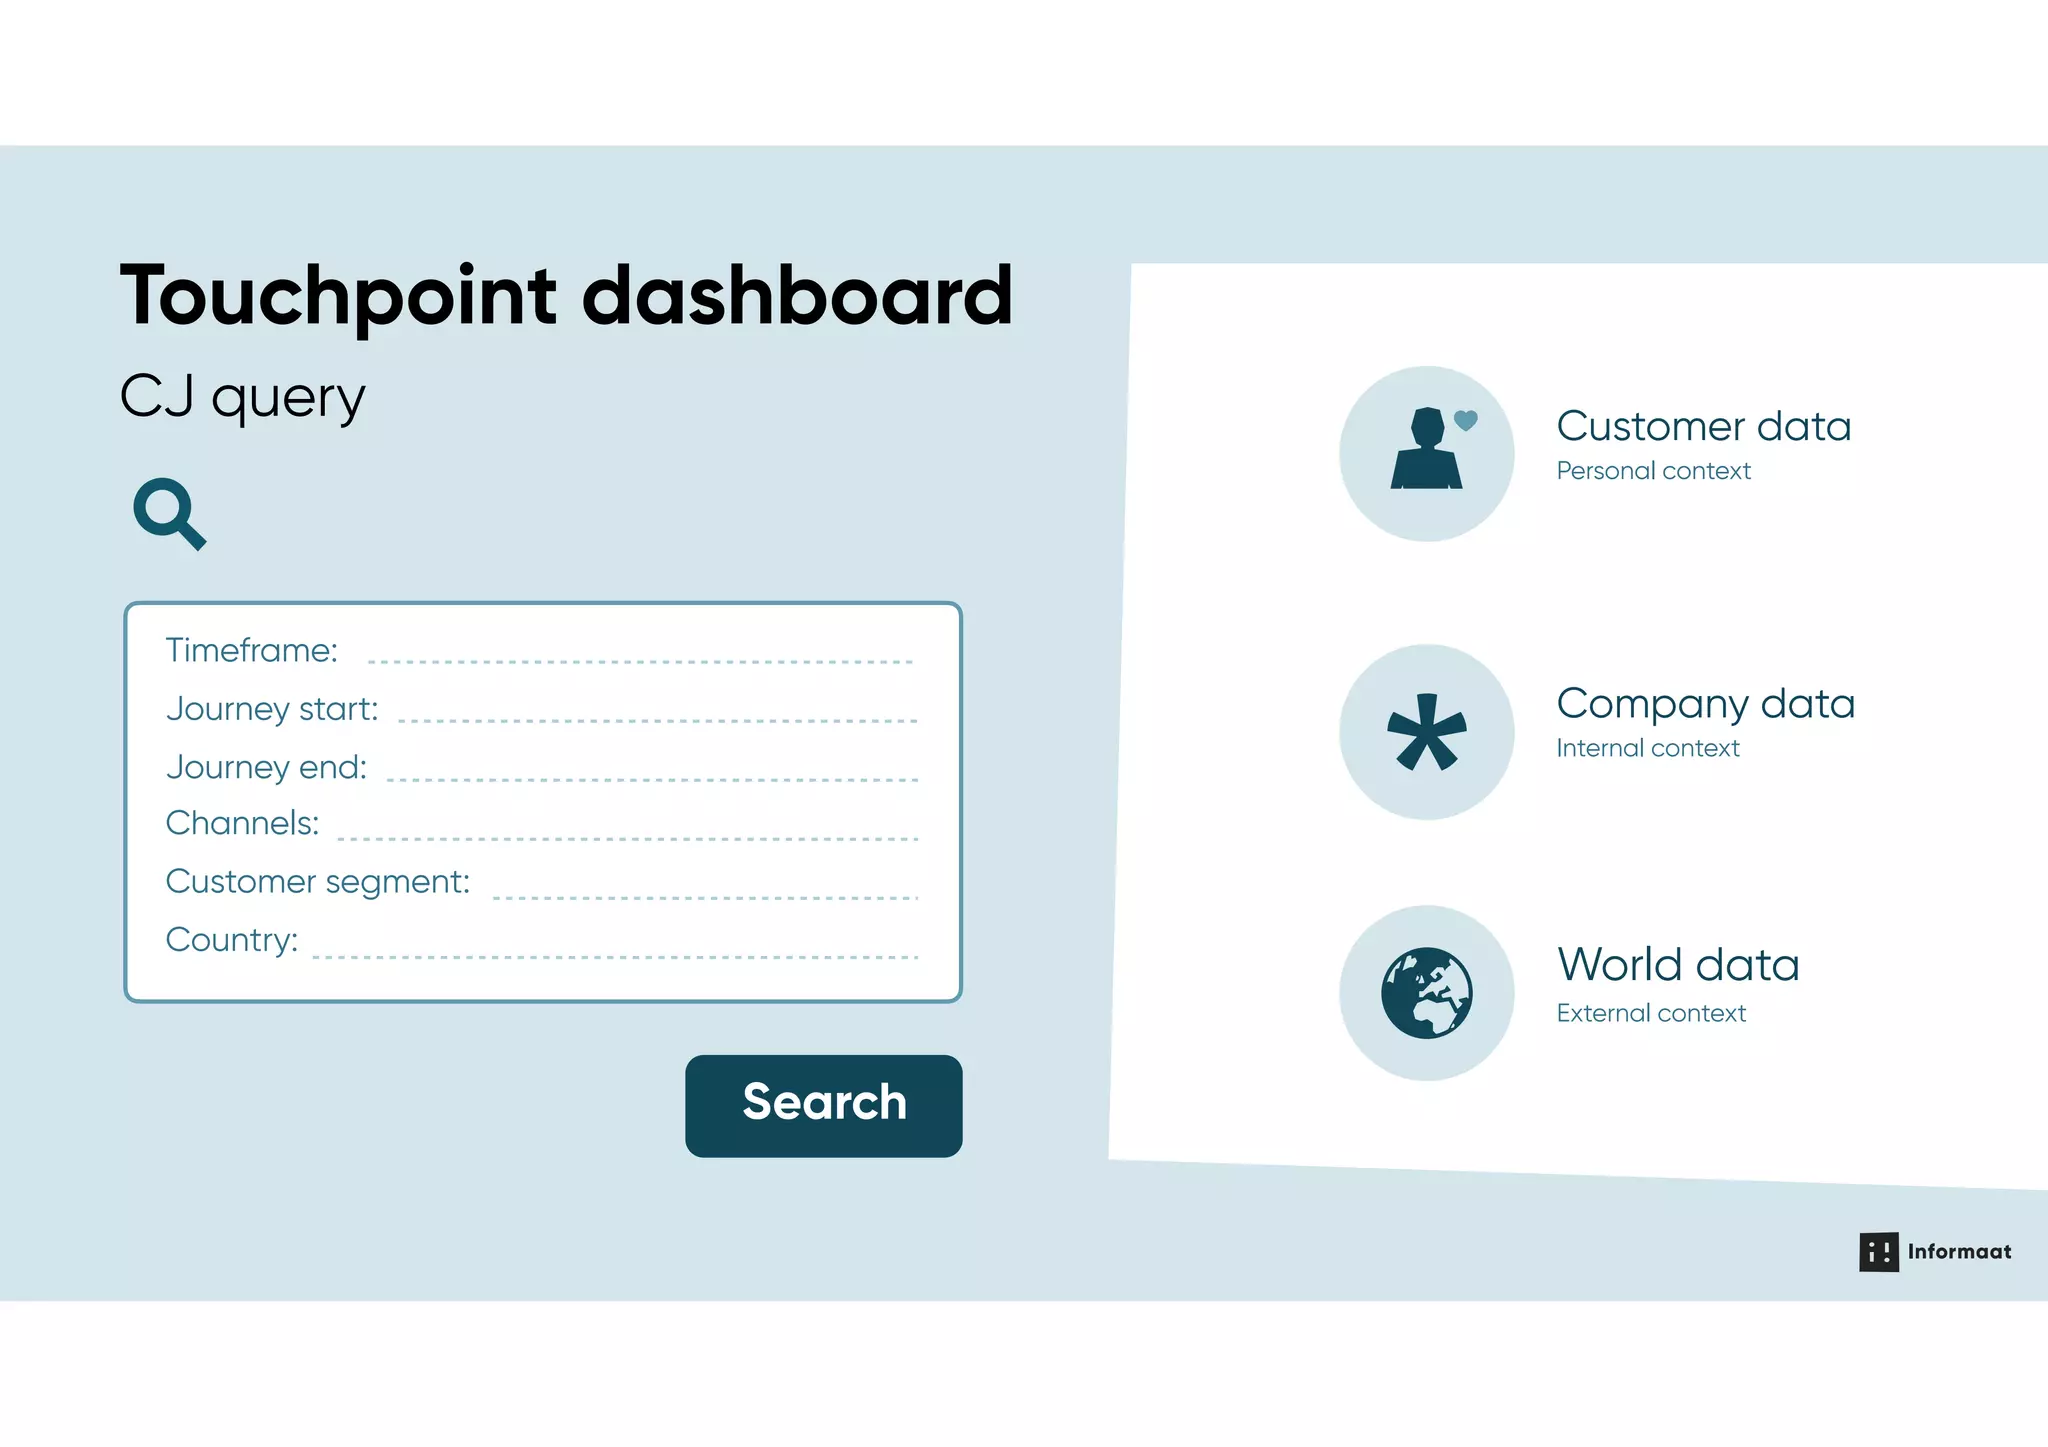
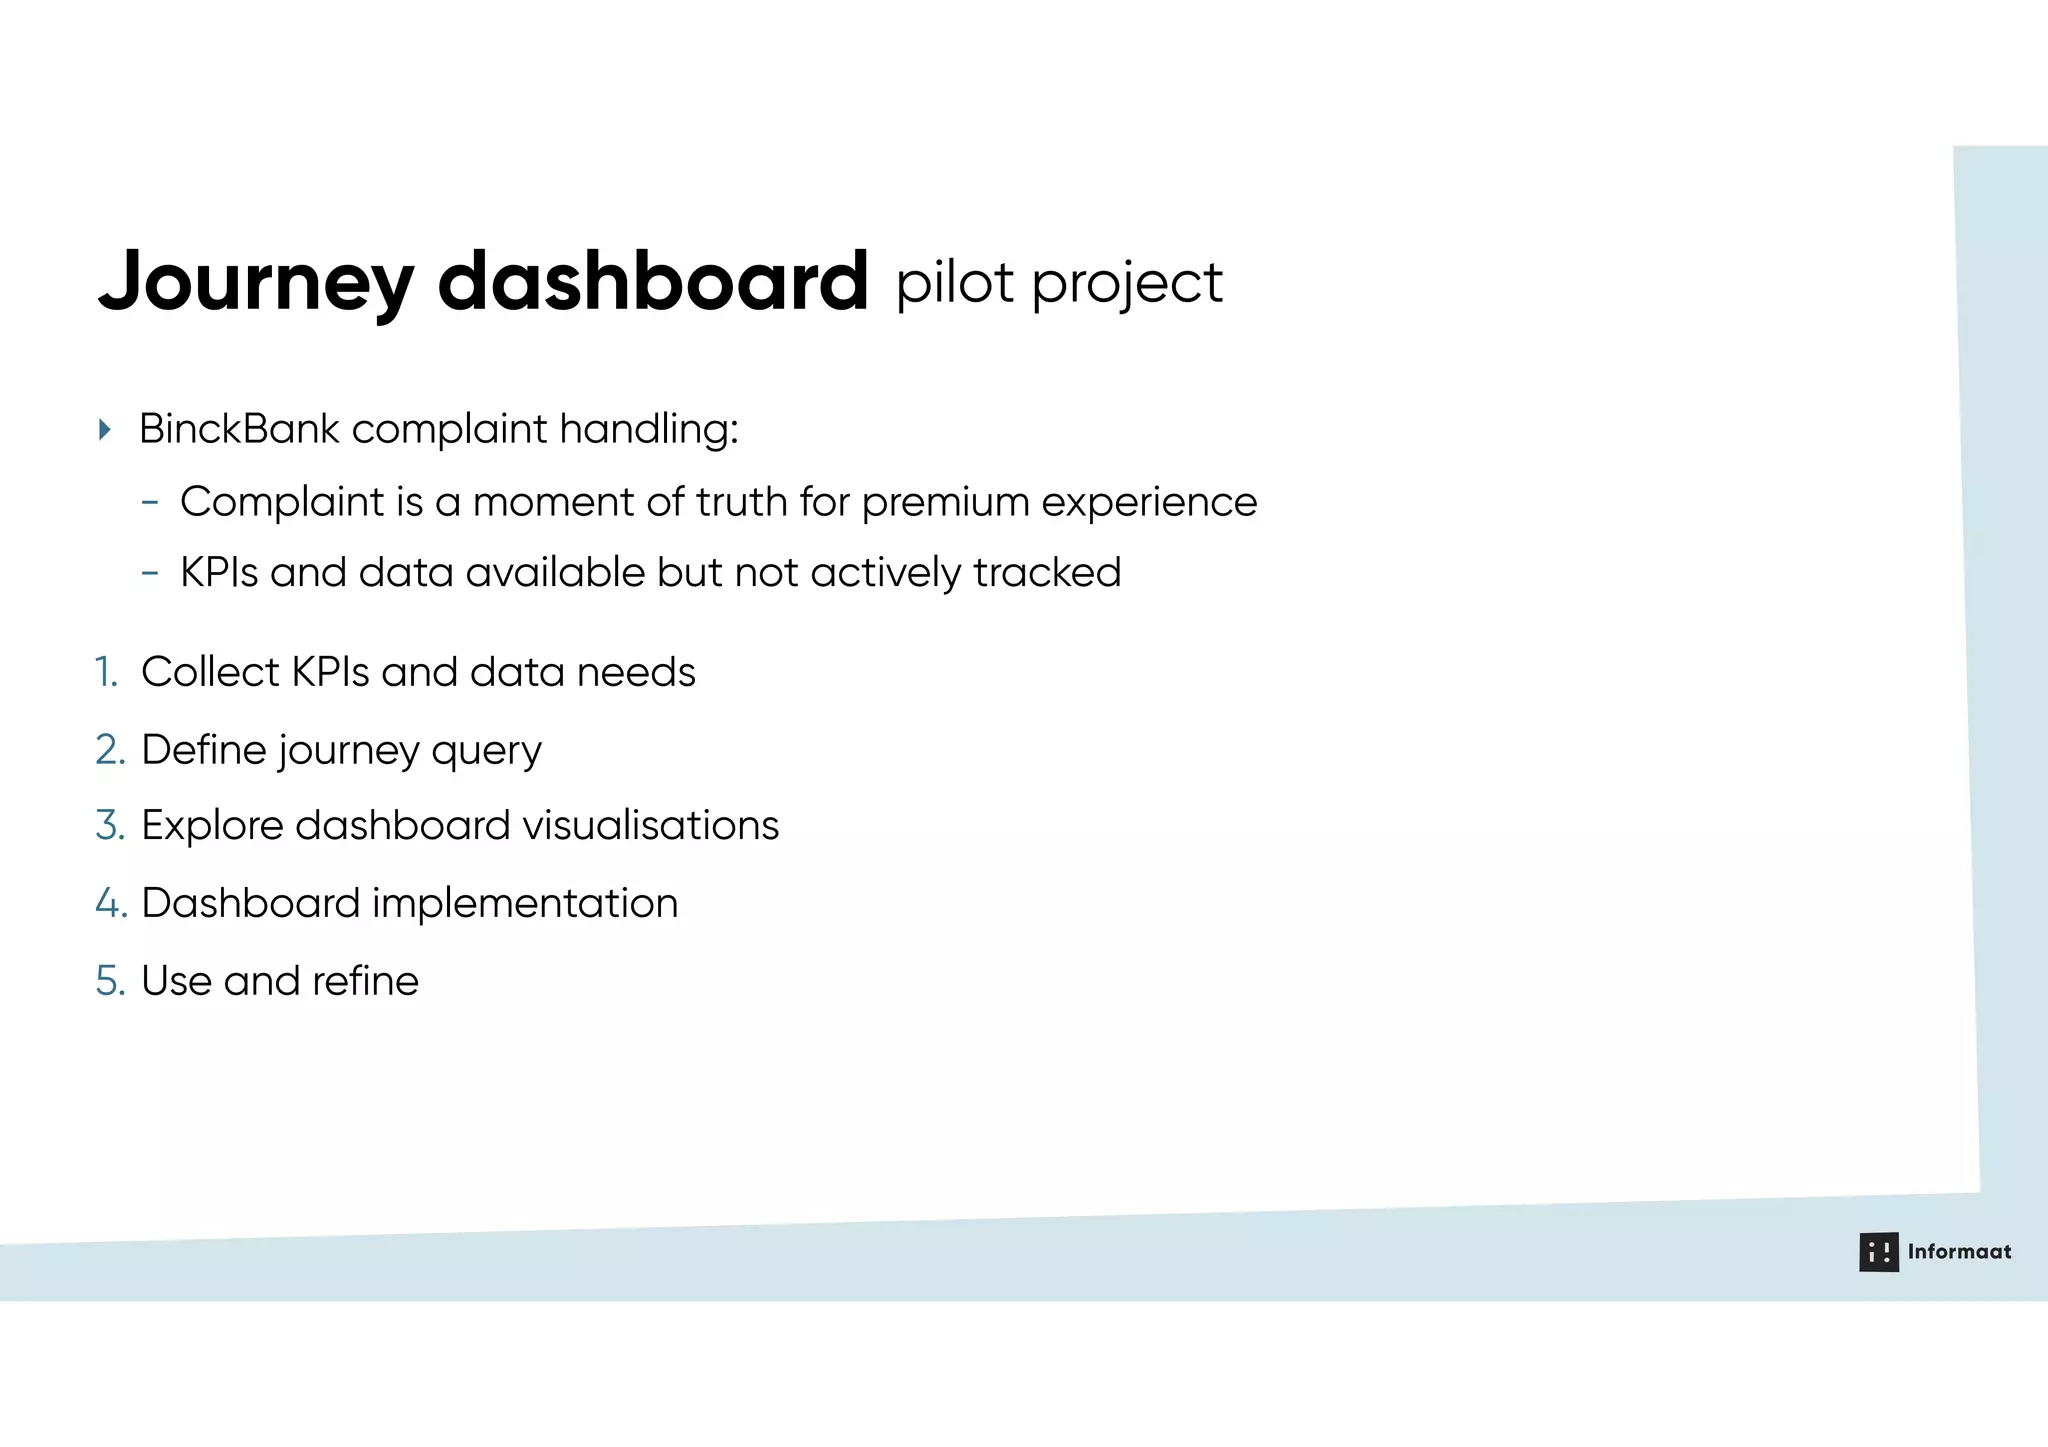
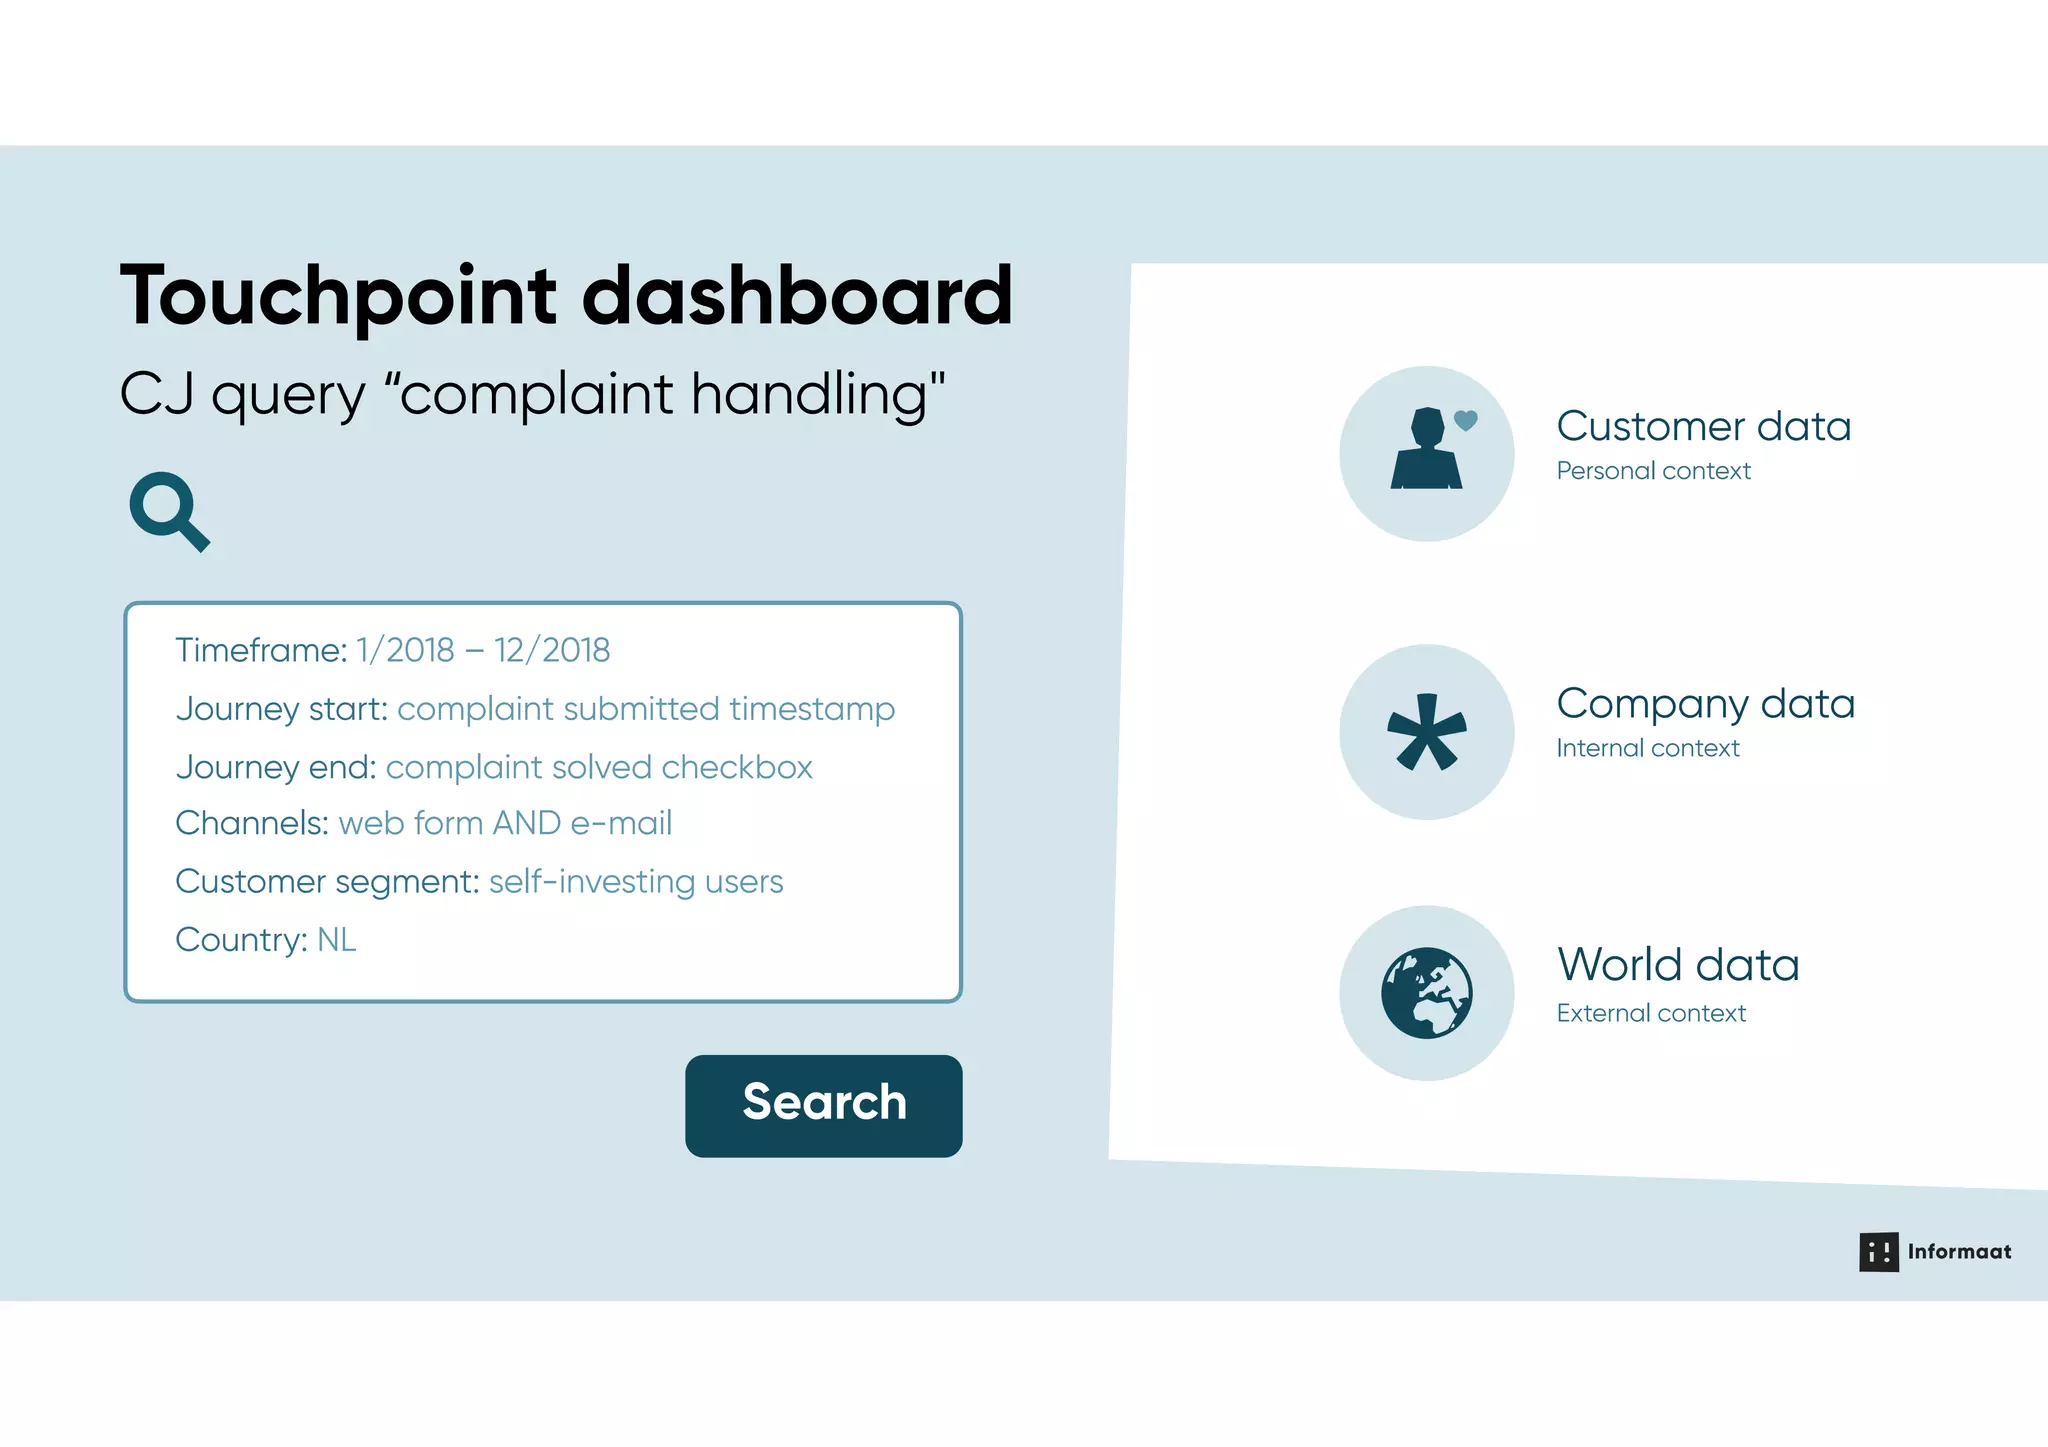
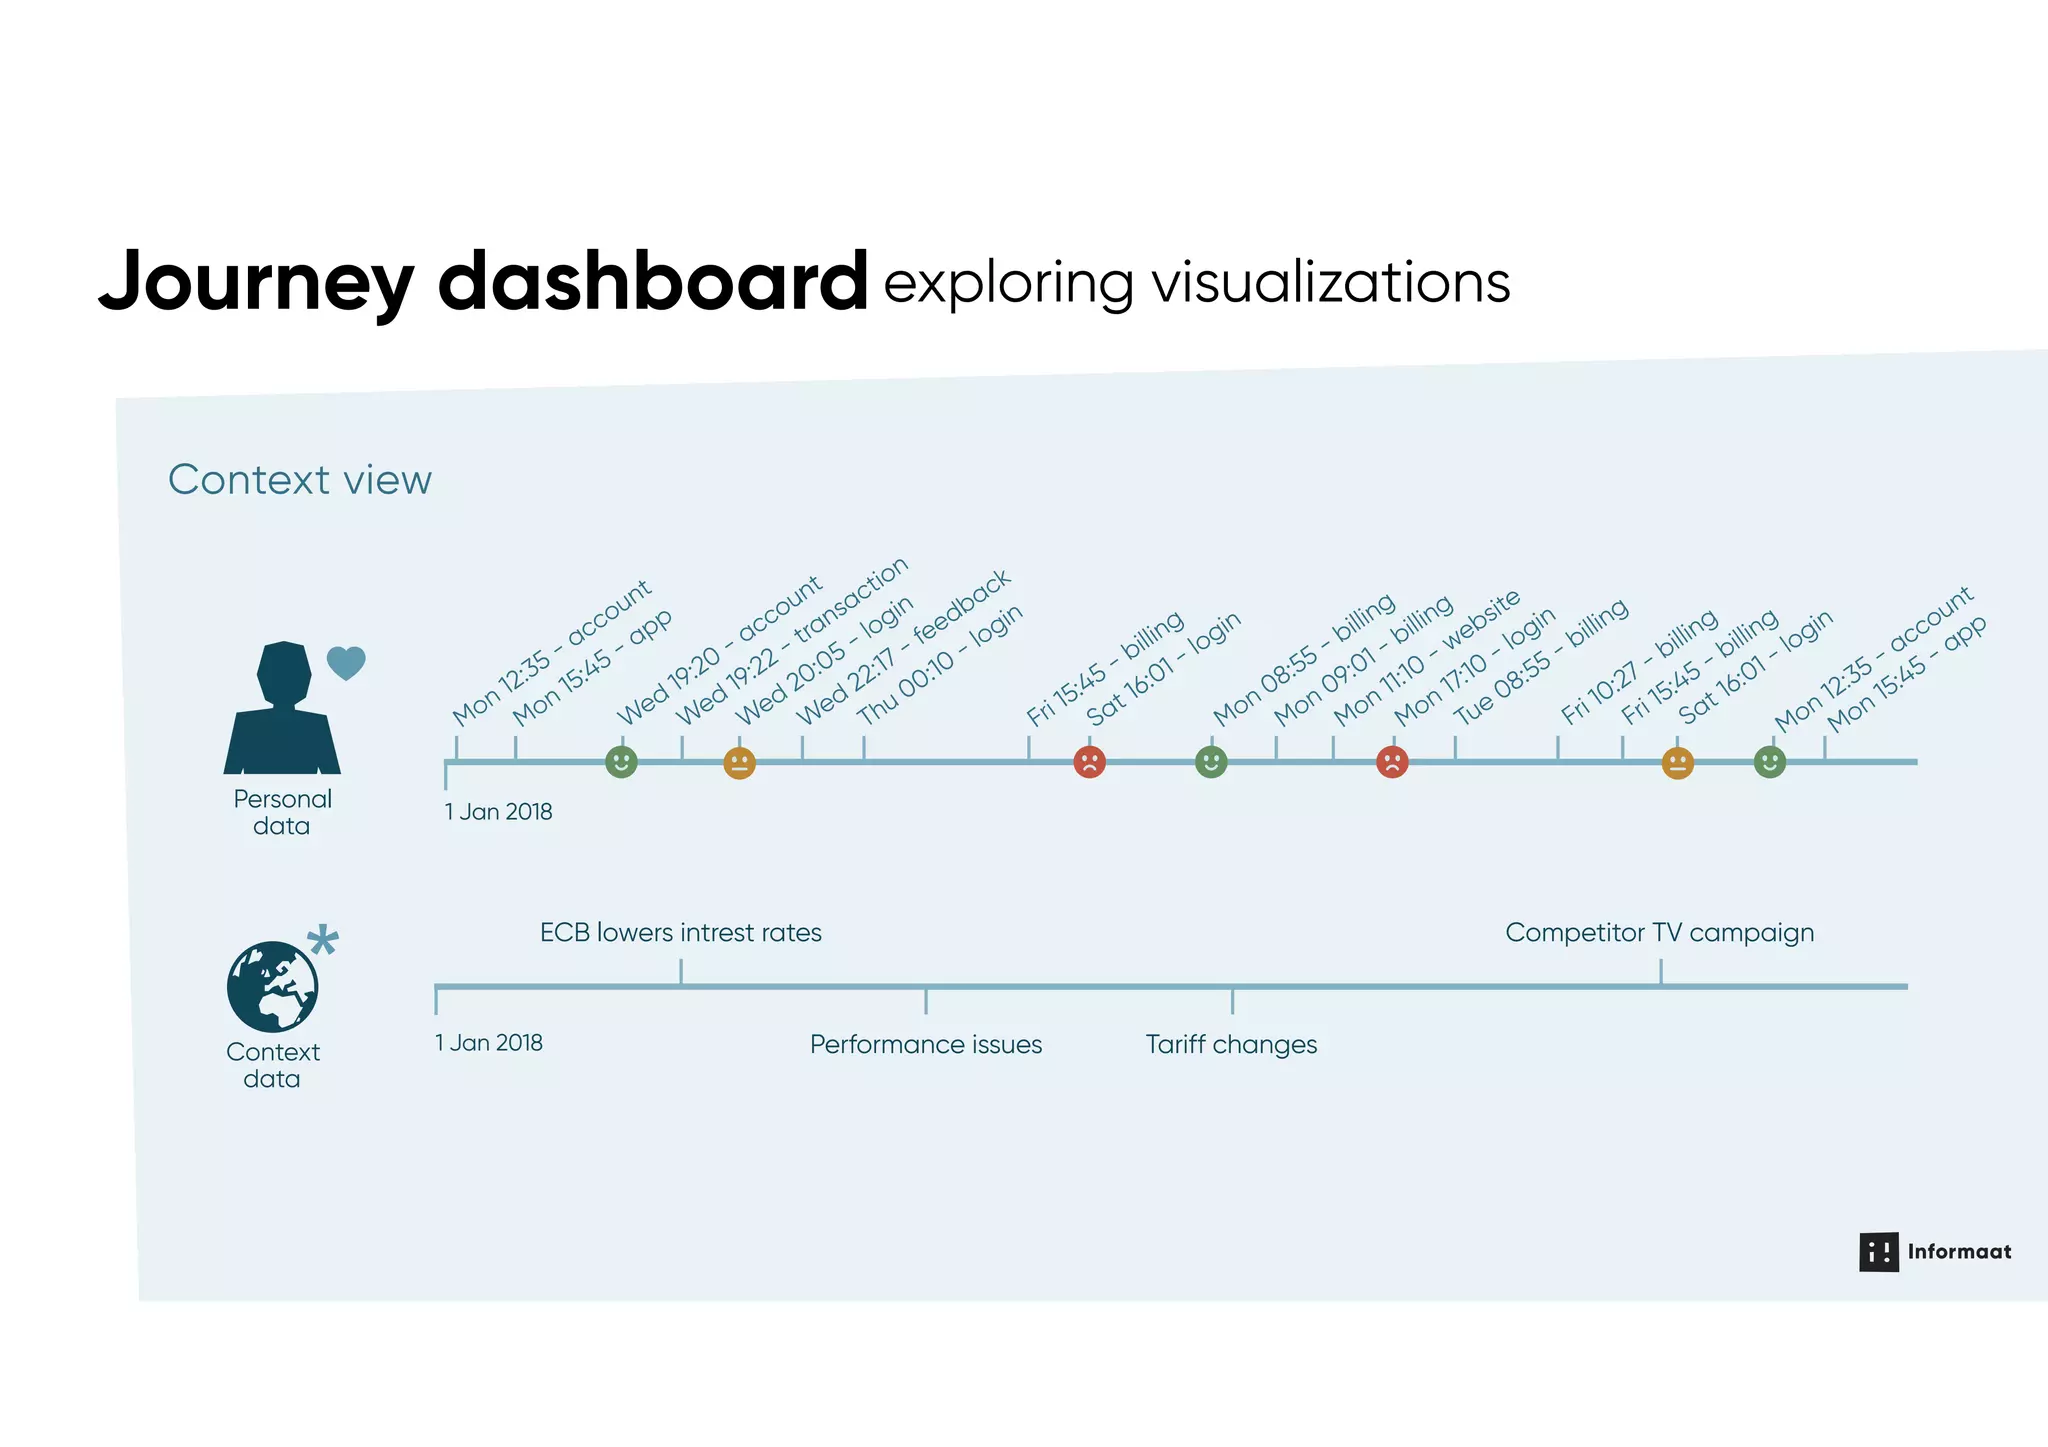

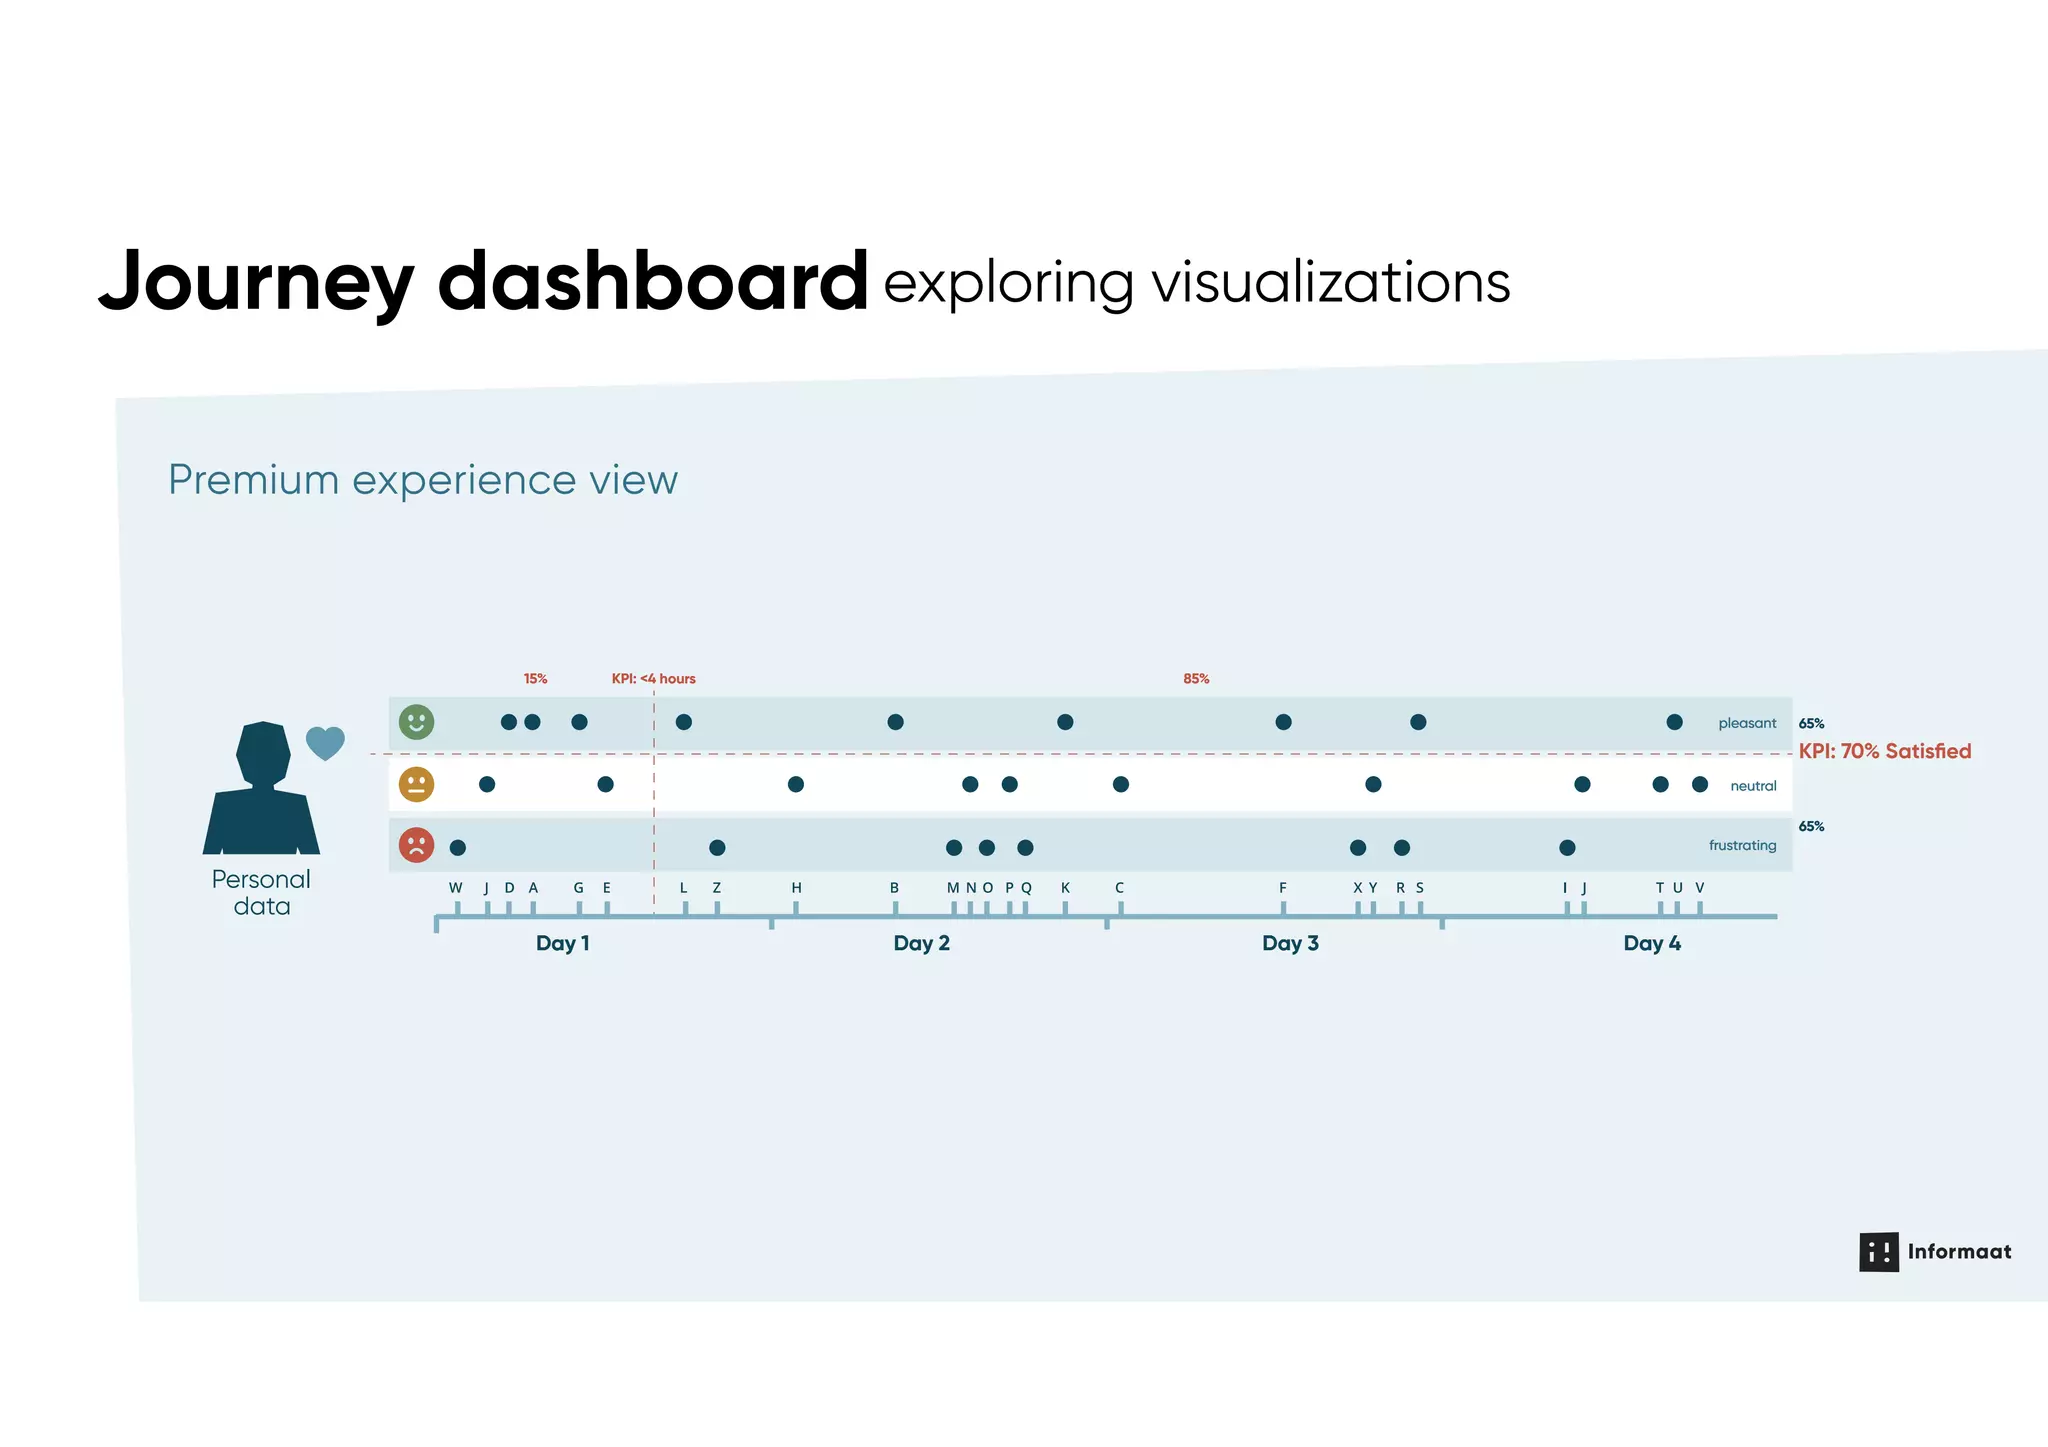
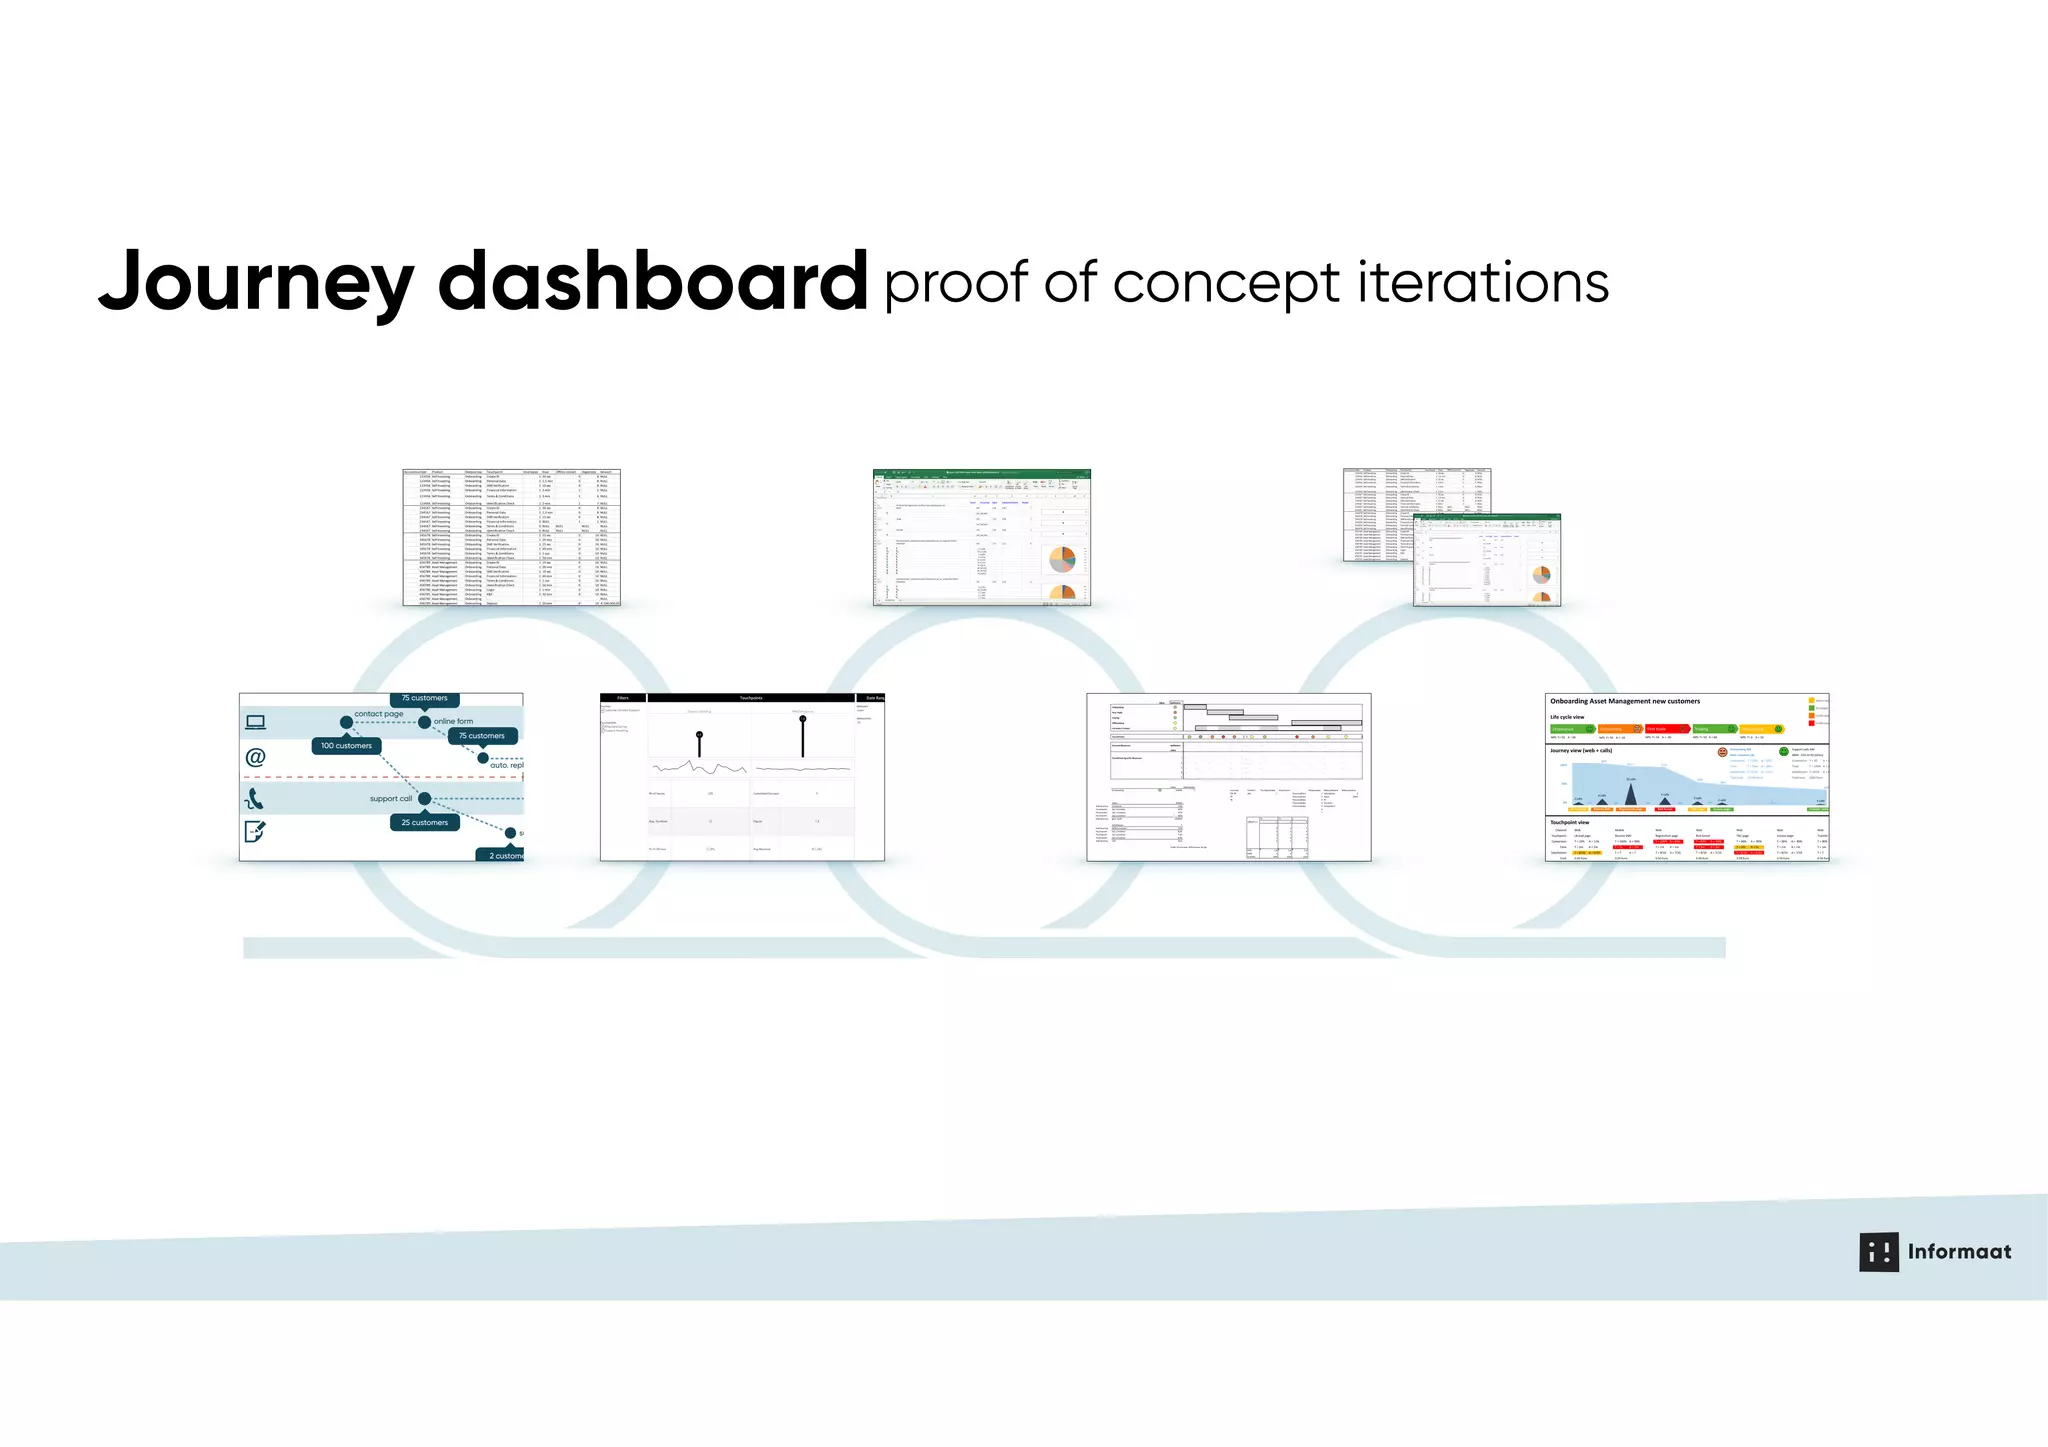
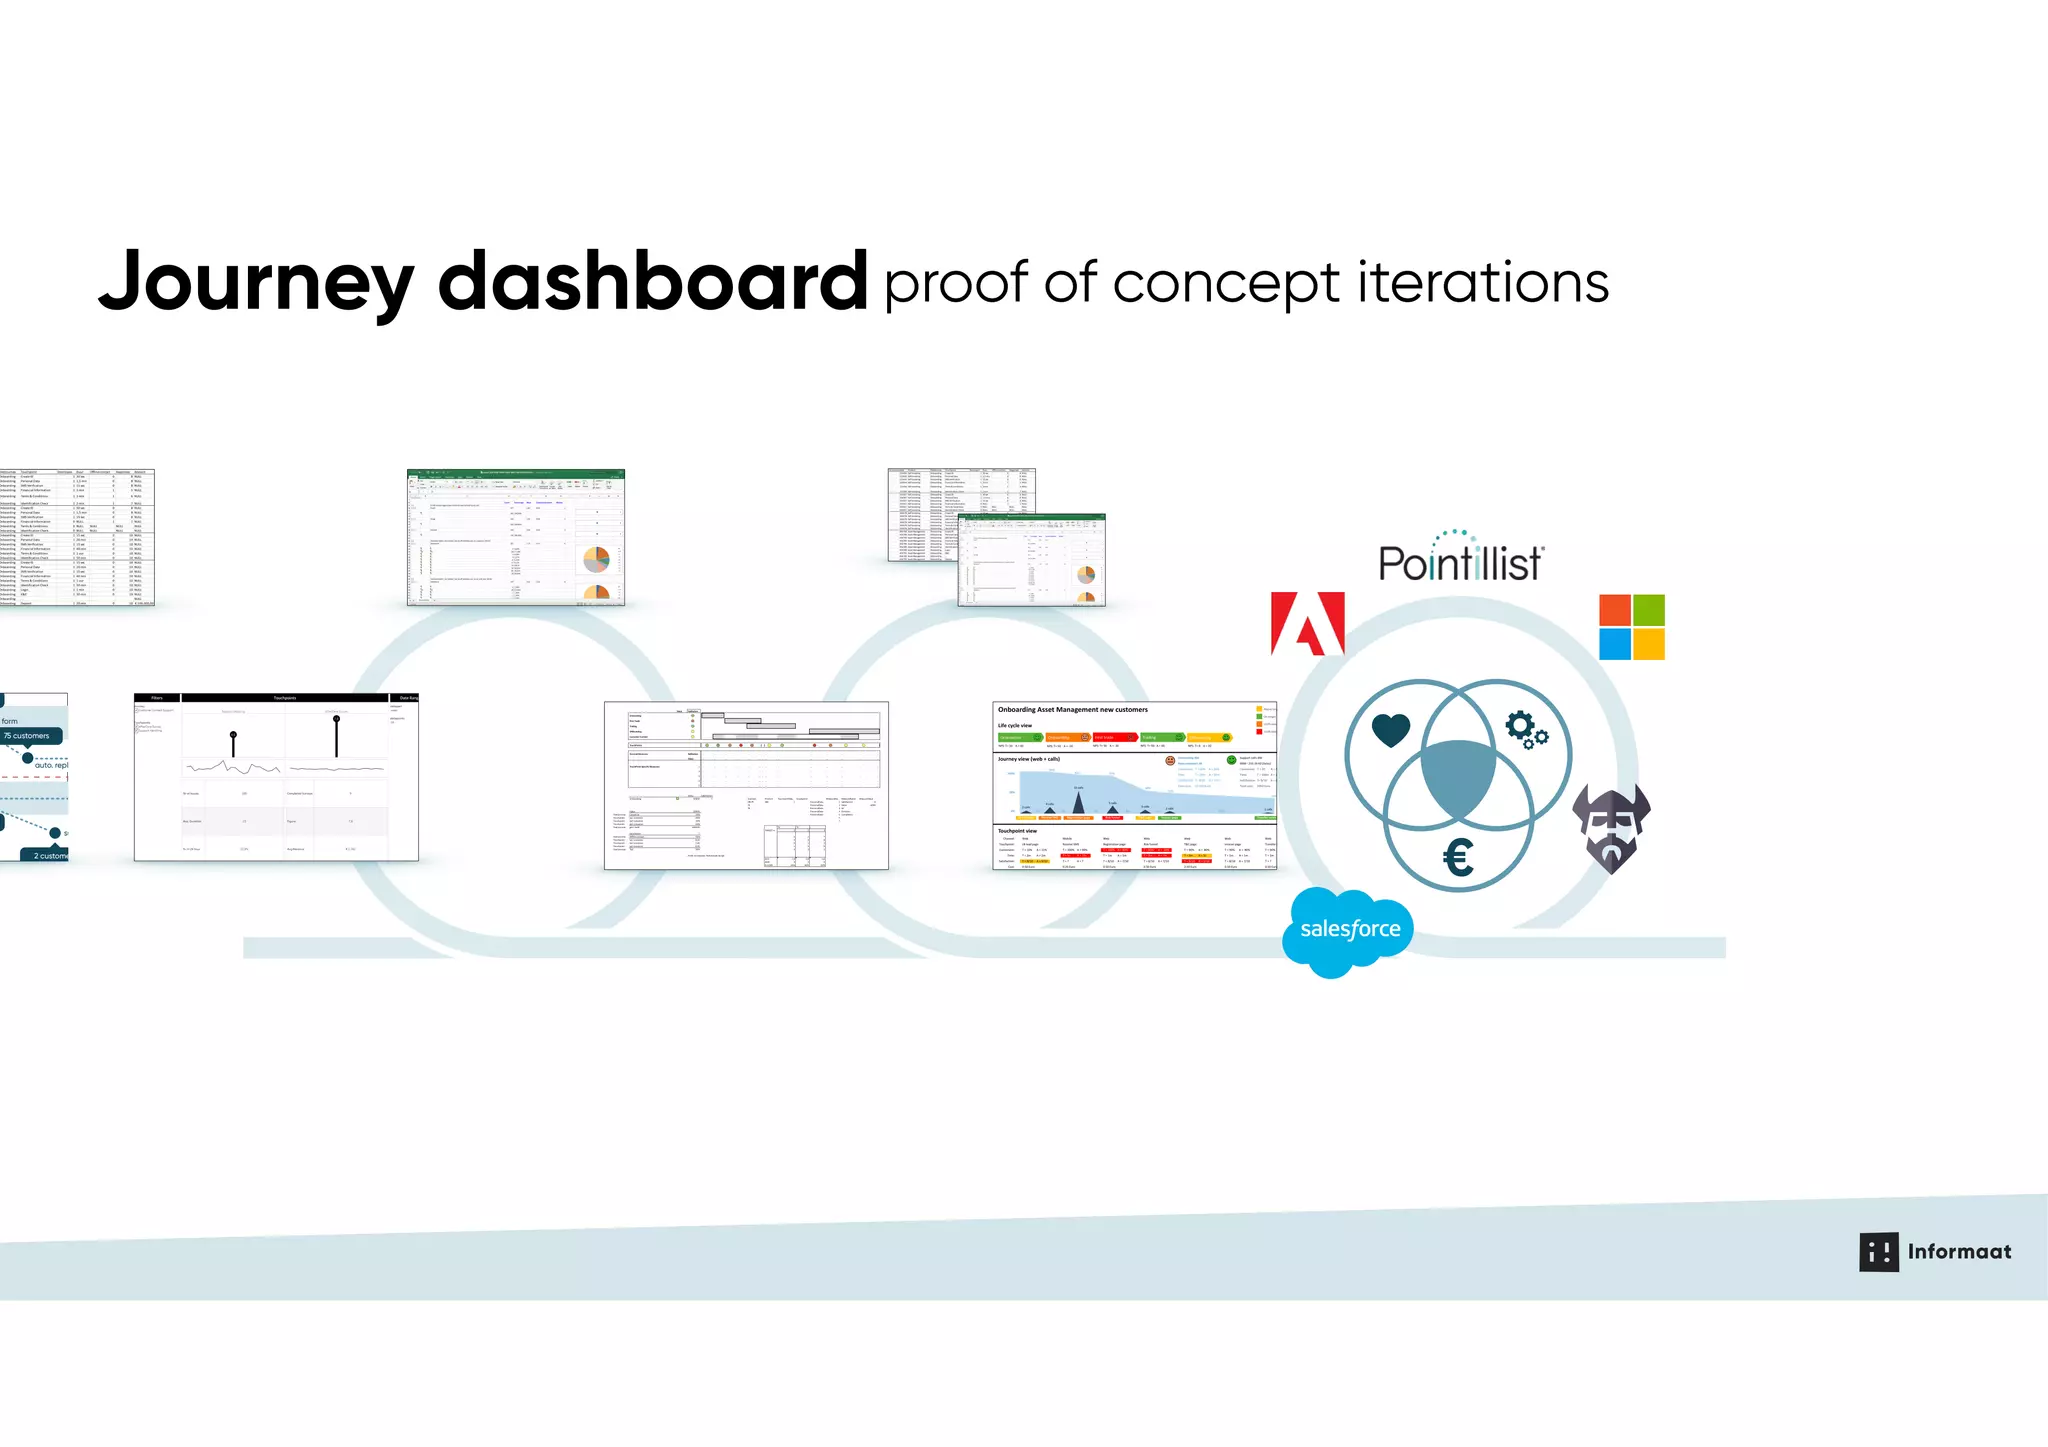

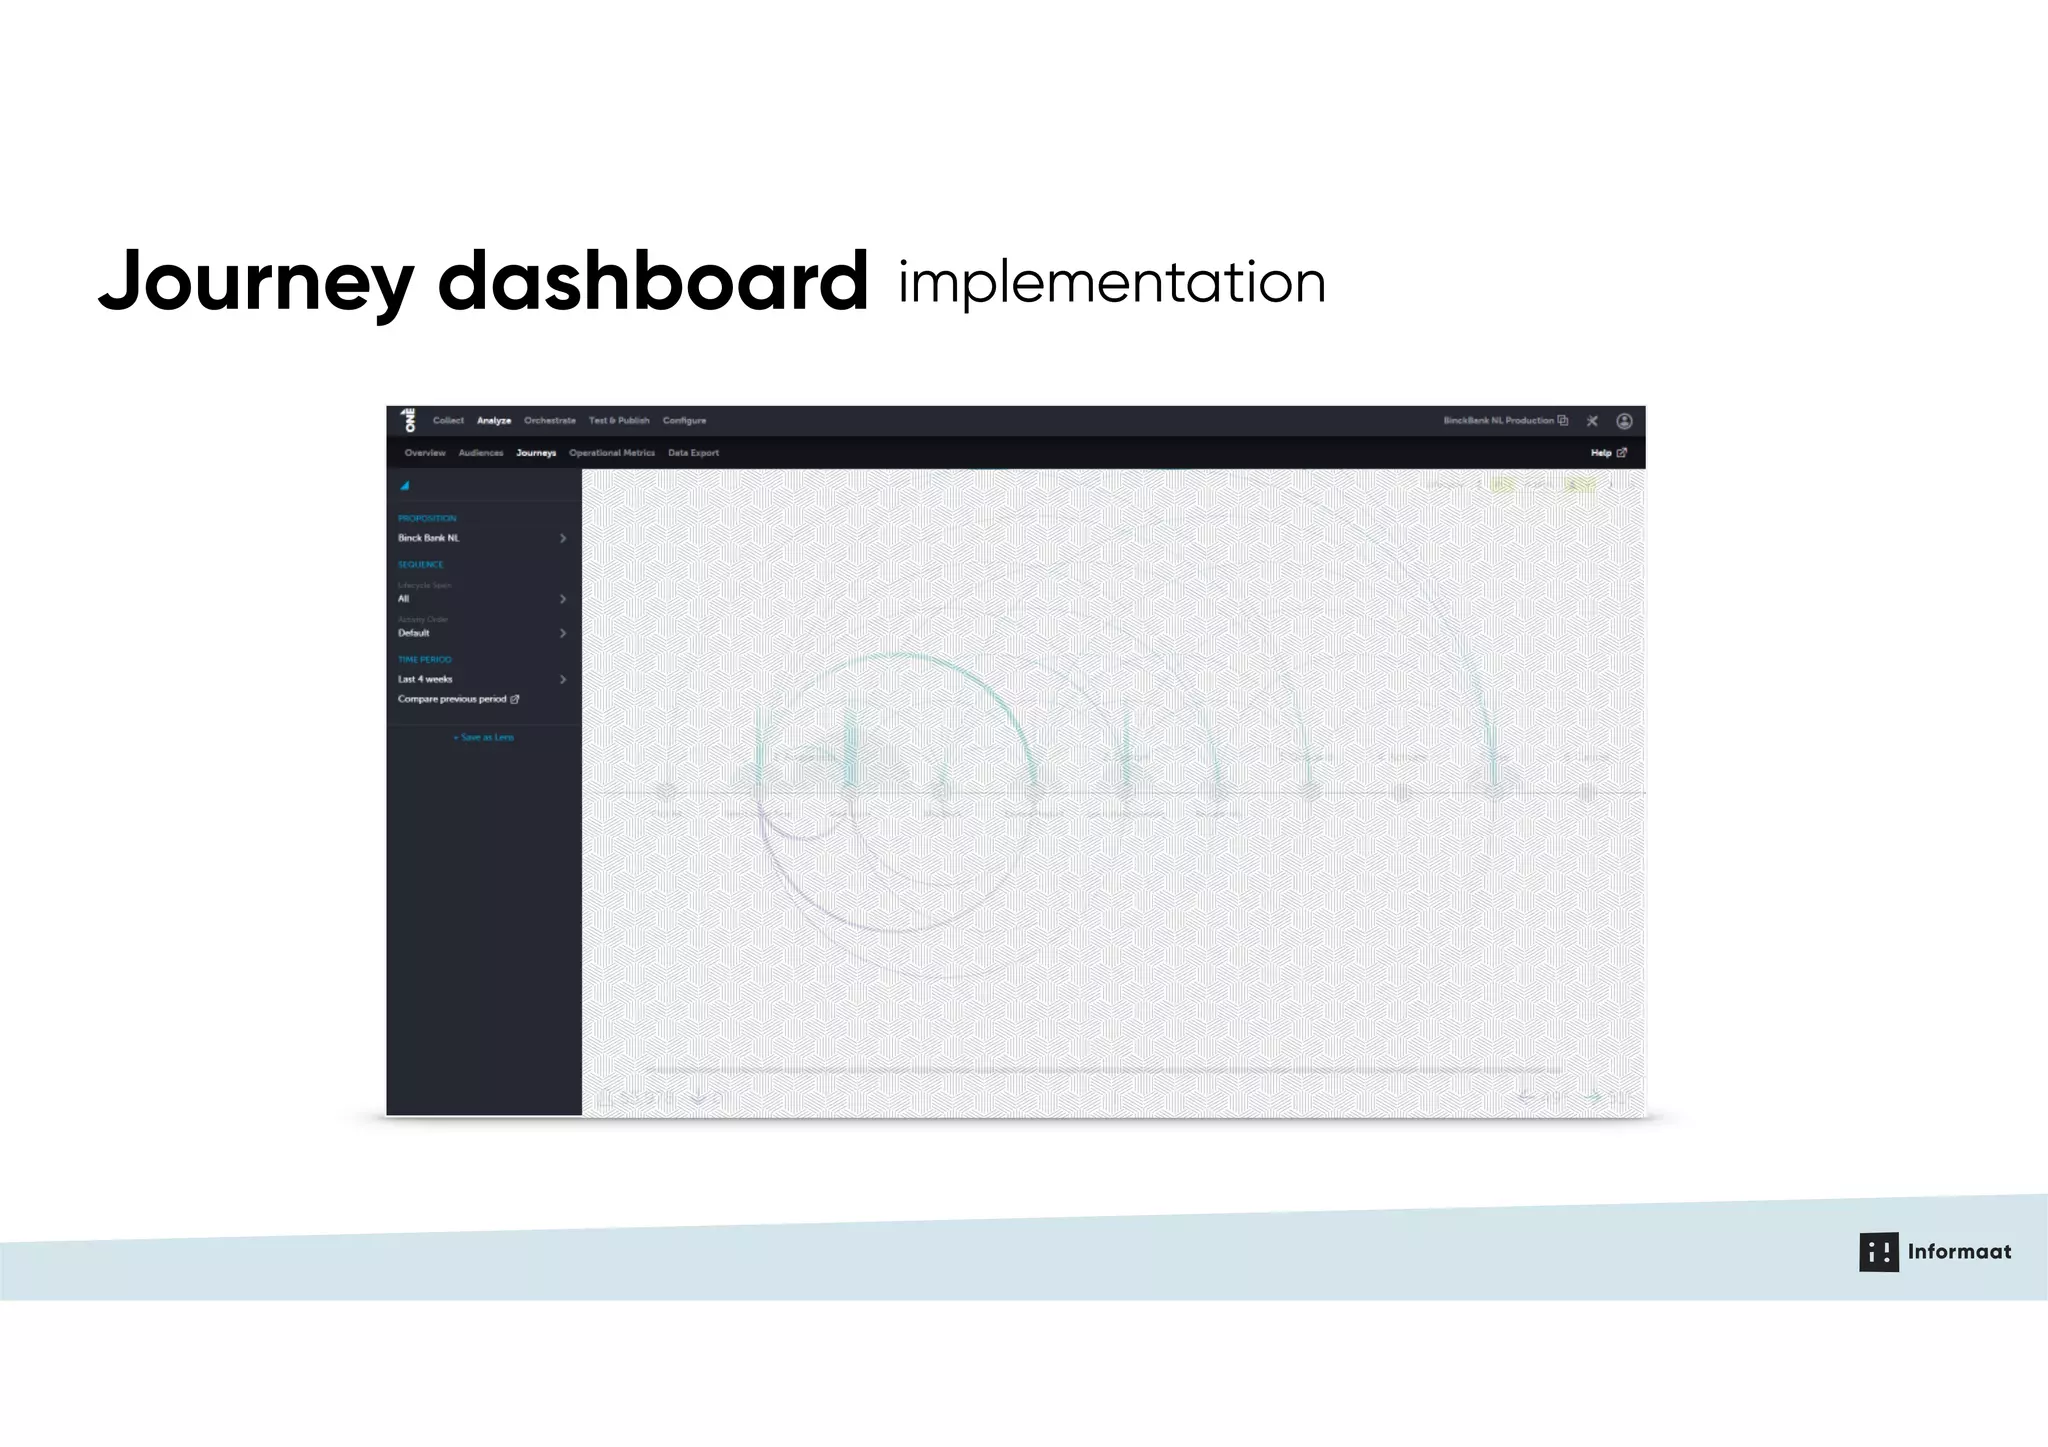
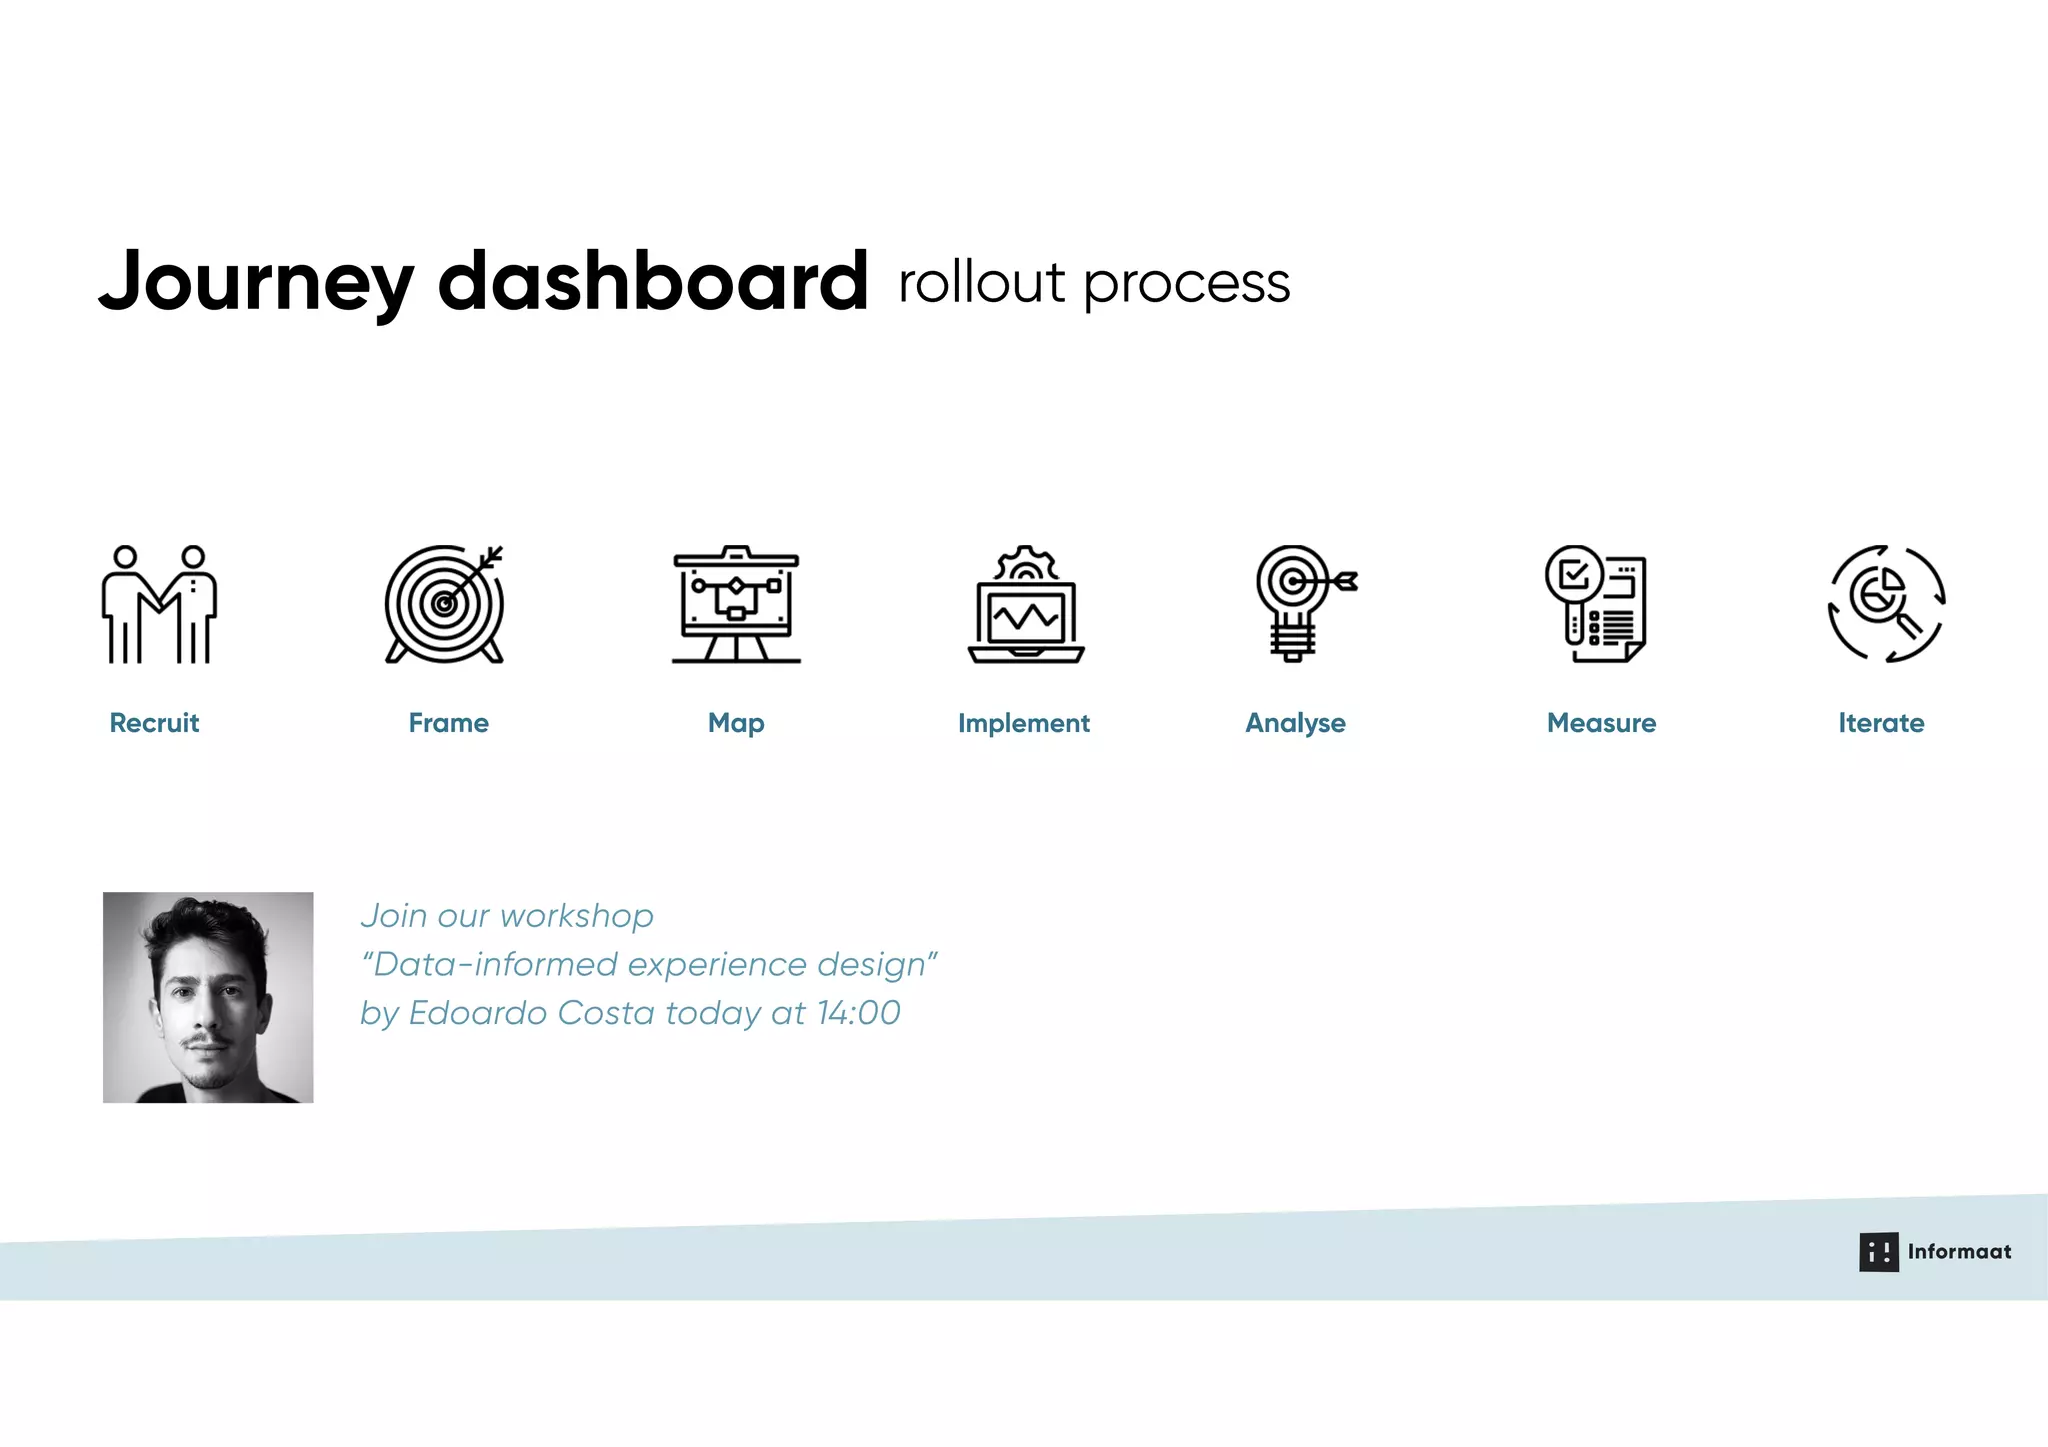

The document outlines a presentation by Rob van der Haar on data-informed experience design at UXStrat Europe, focusing on enhancing customer-centric design within organizations. It discusses the integration of quantitative and qualitative data in user experience design, emphasizing the importance of analytics frameworks and dashboards in improving services like BinckBank. Lessons are shared on the challenges and successes of implementing data-informed design to create better customer experiences.


![[BROCHURE] Italy Tour Project | @SlideON](https://cdn.slidesharecdn.com/ss_thumbnails/brochure8-251215152319-2805af68-thumbnail.jpg?width=640&height=640&fit=bounds)


