Download as PDF, PPTX


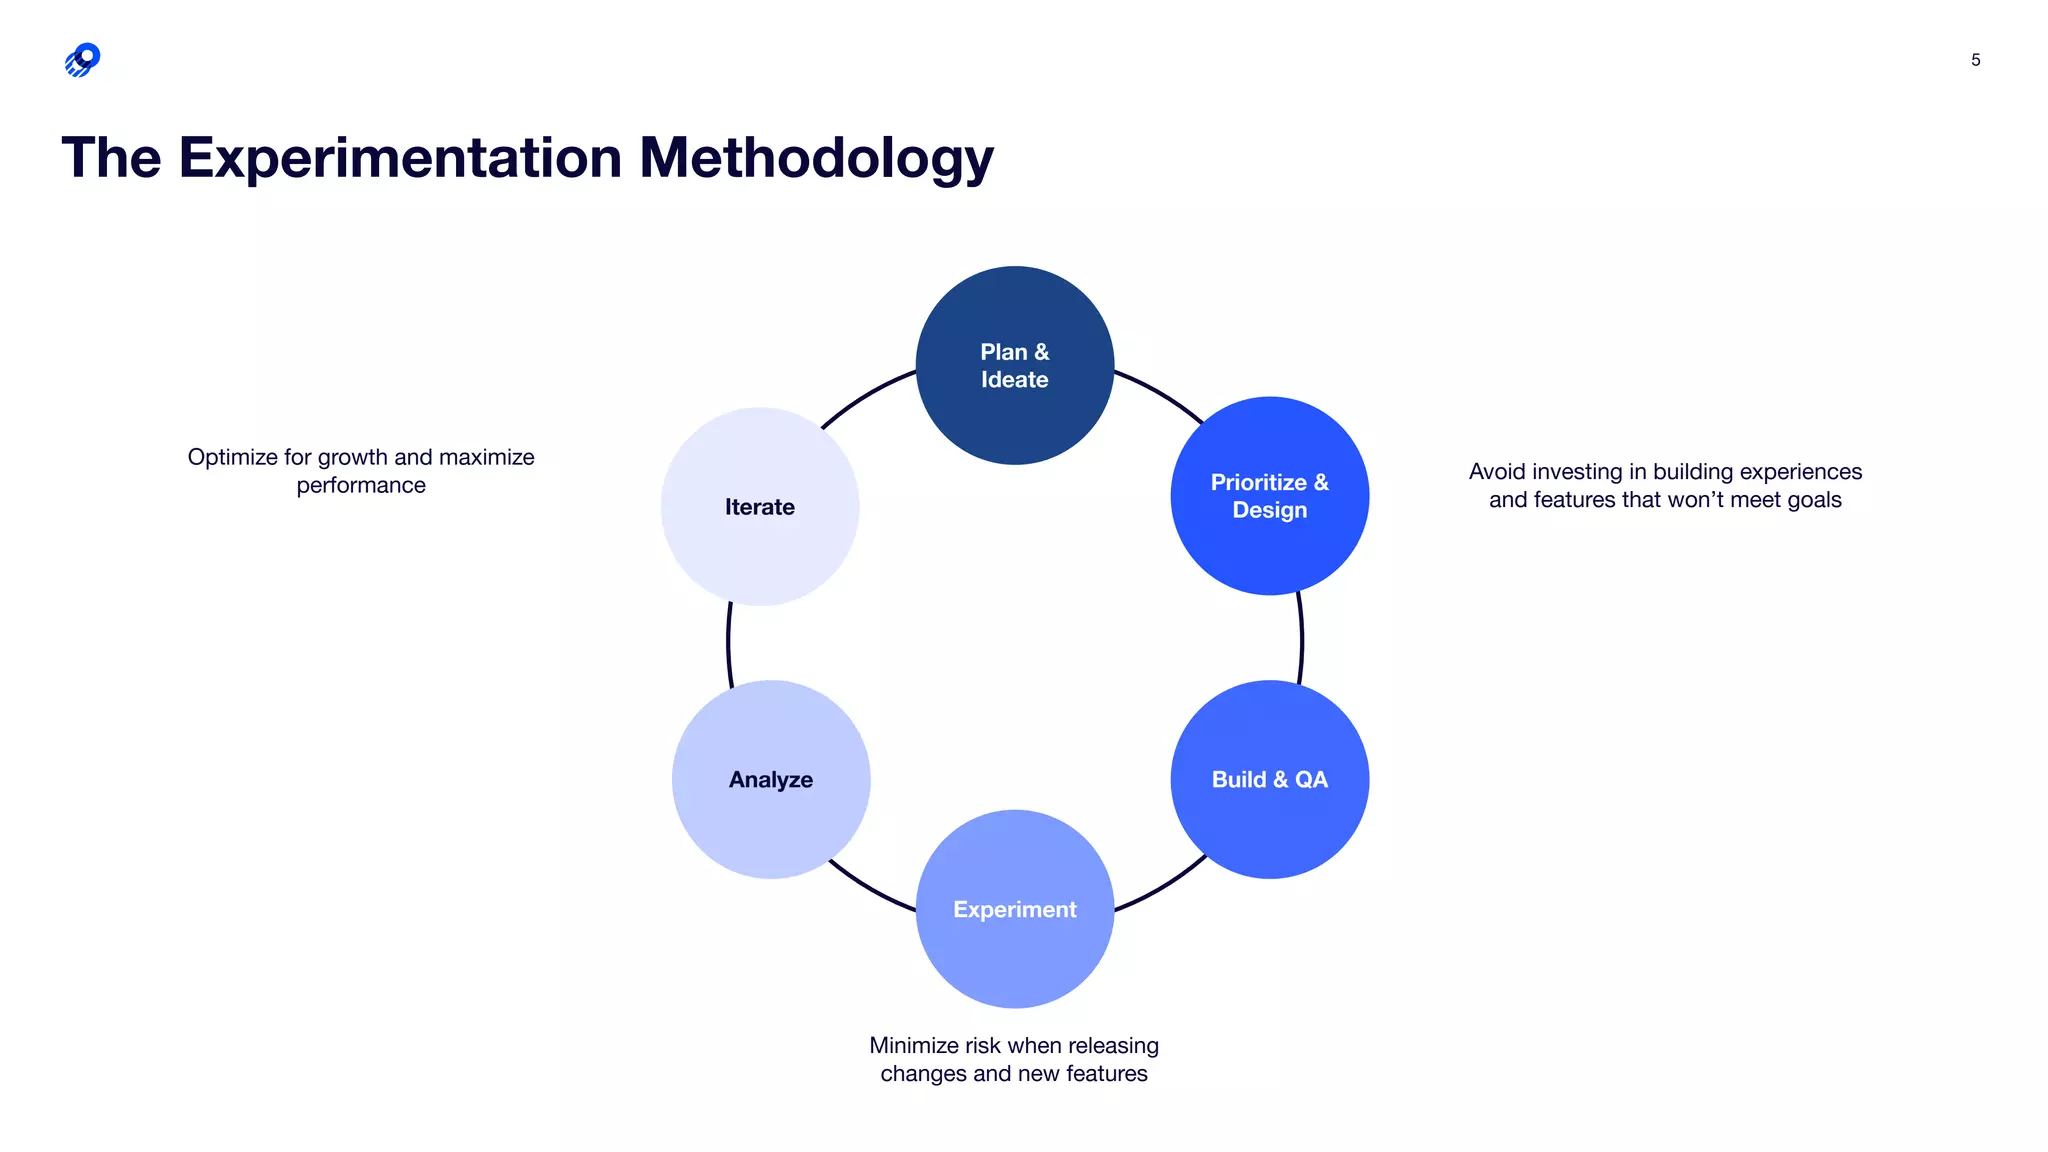
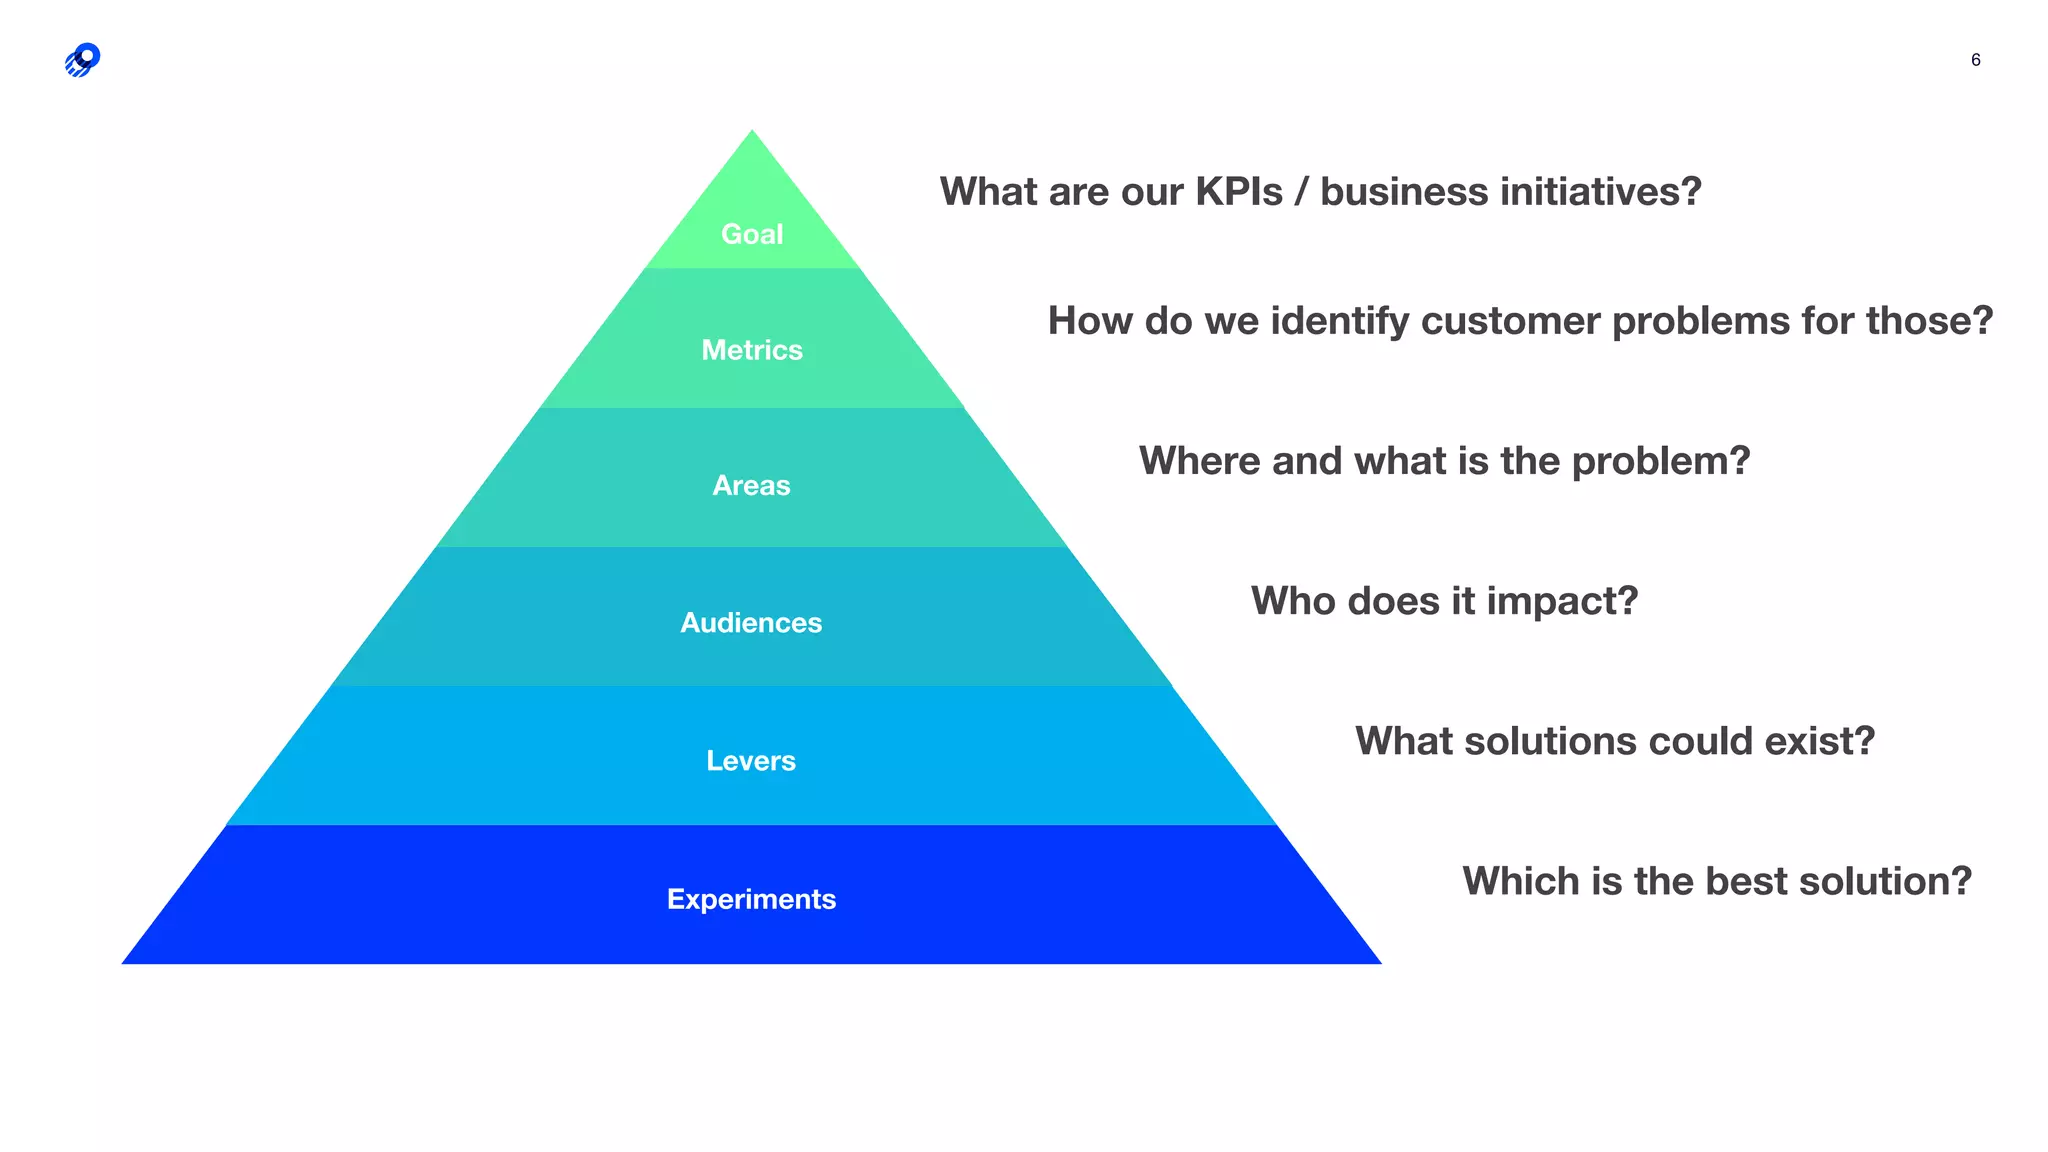


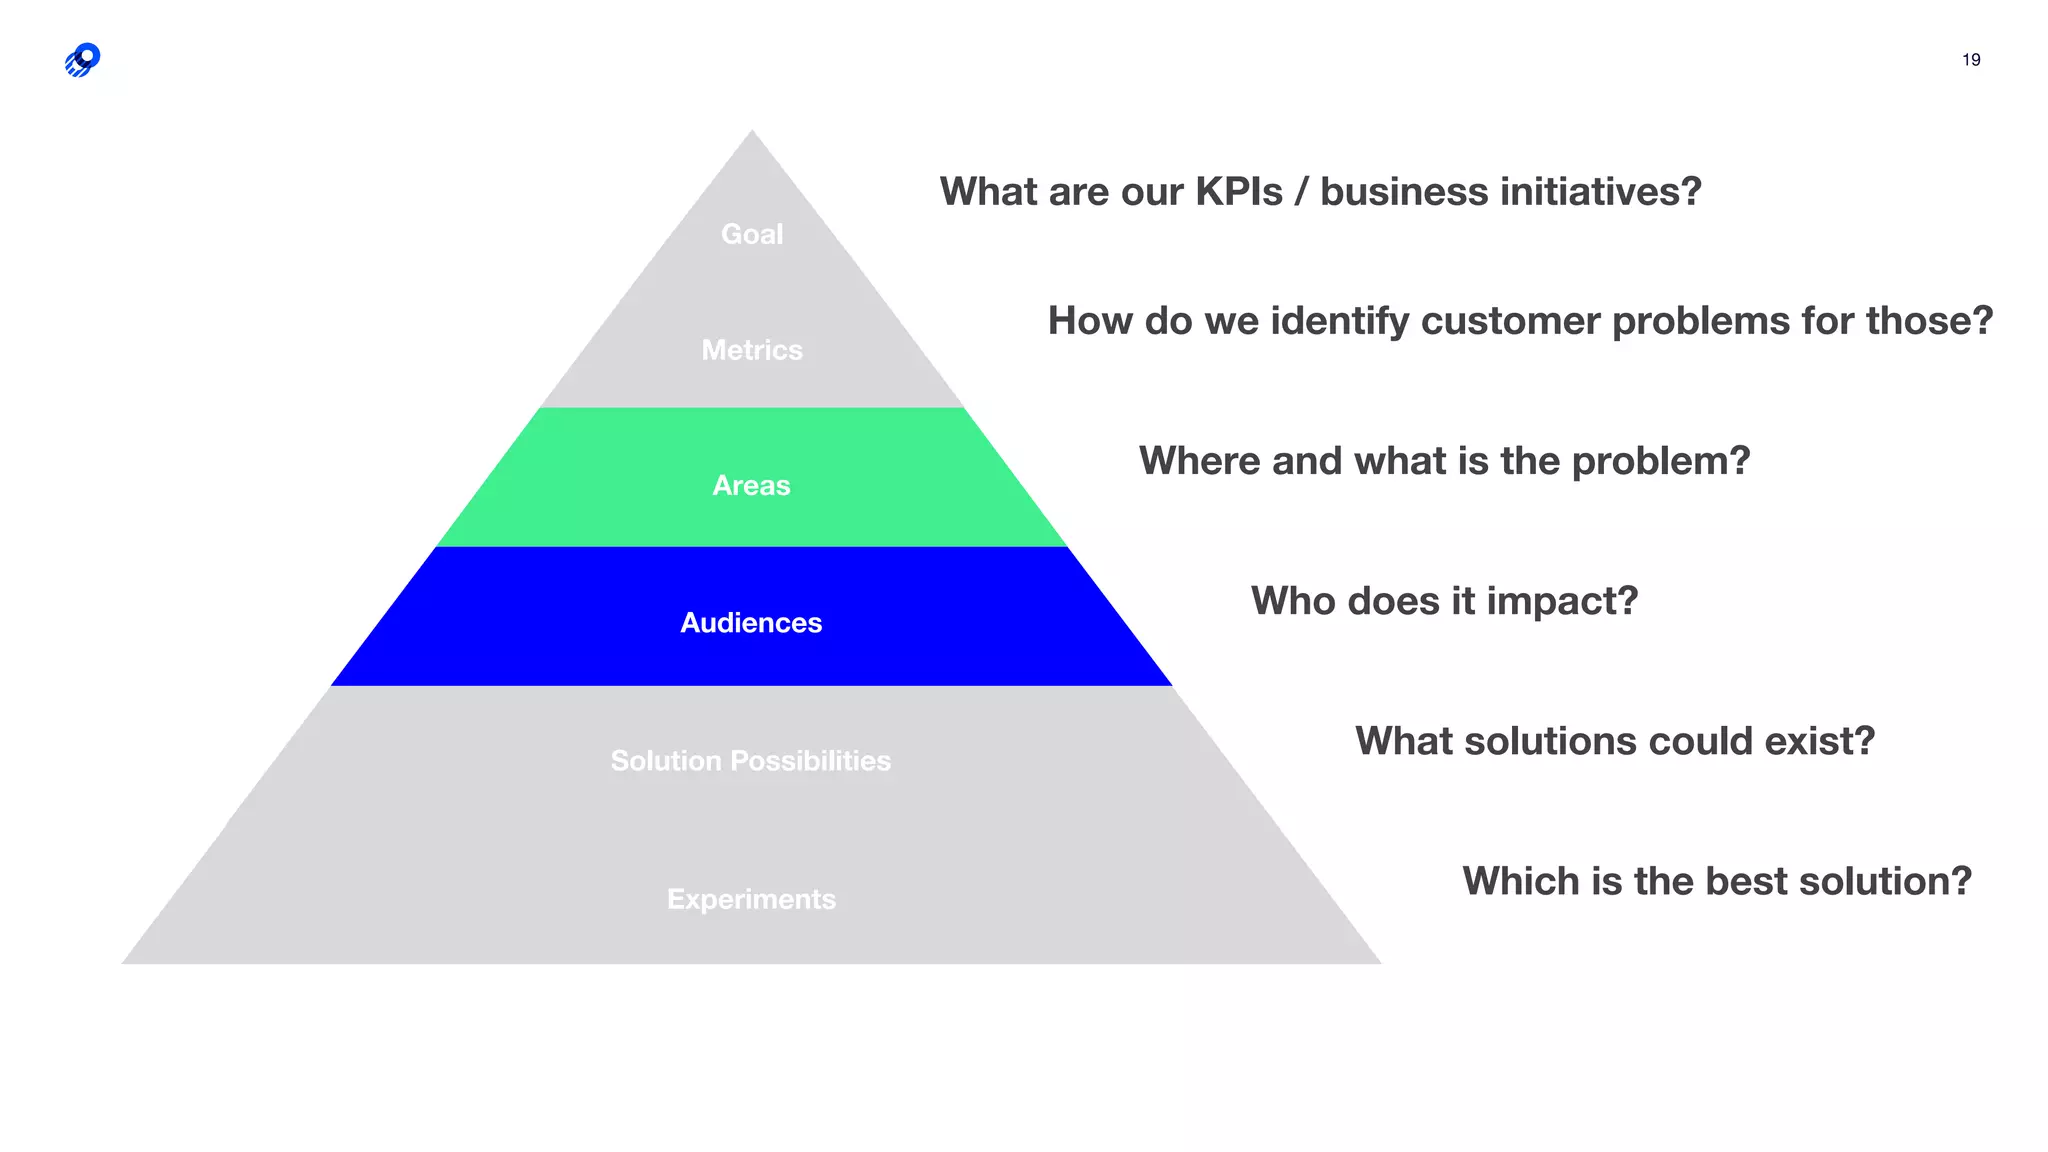
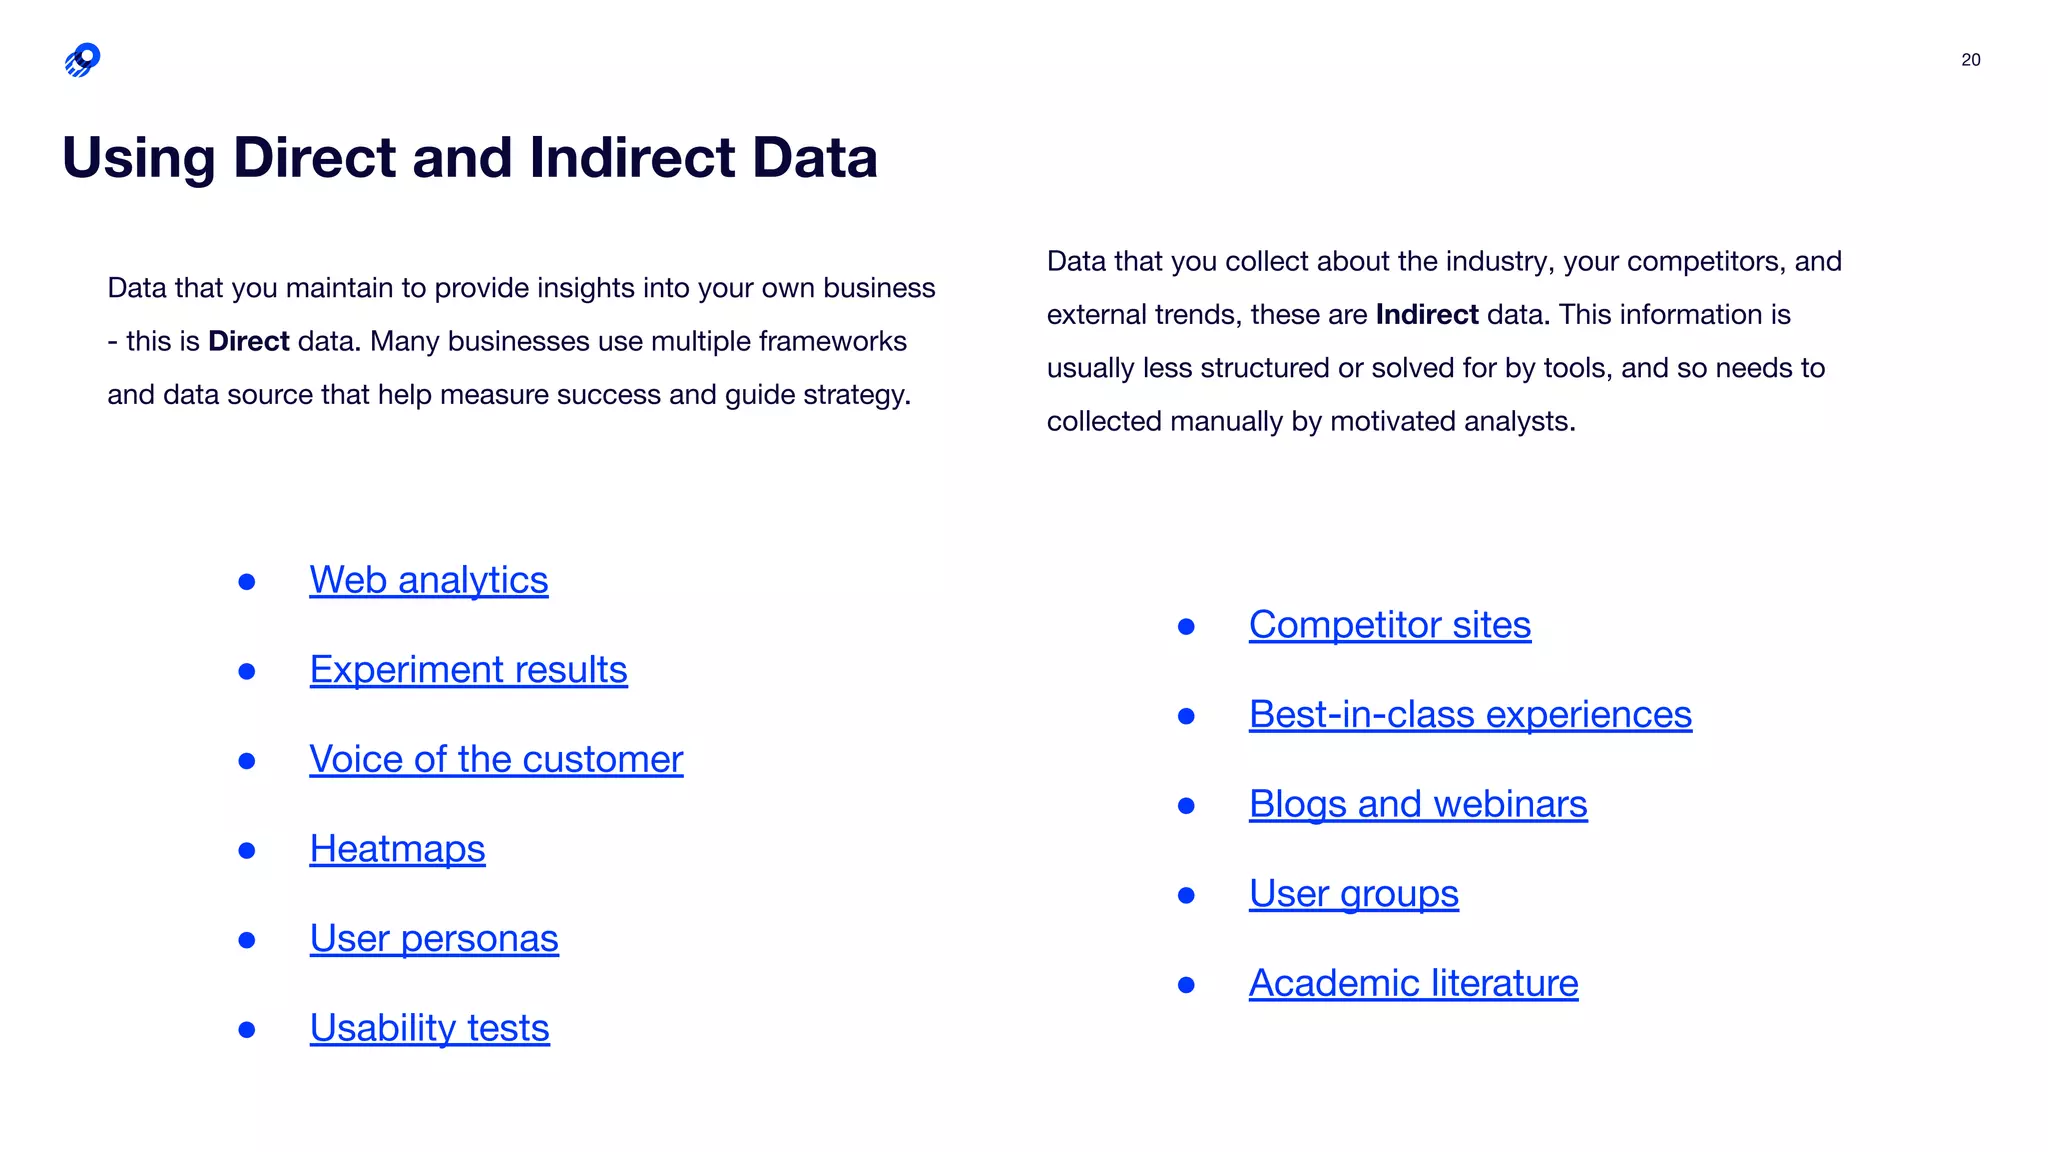

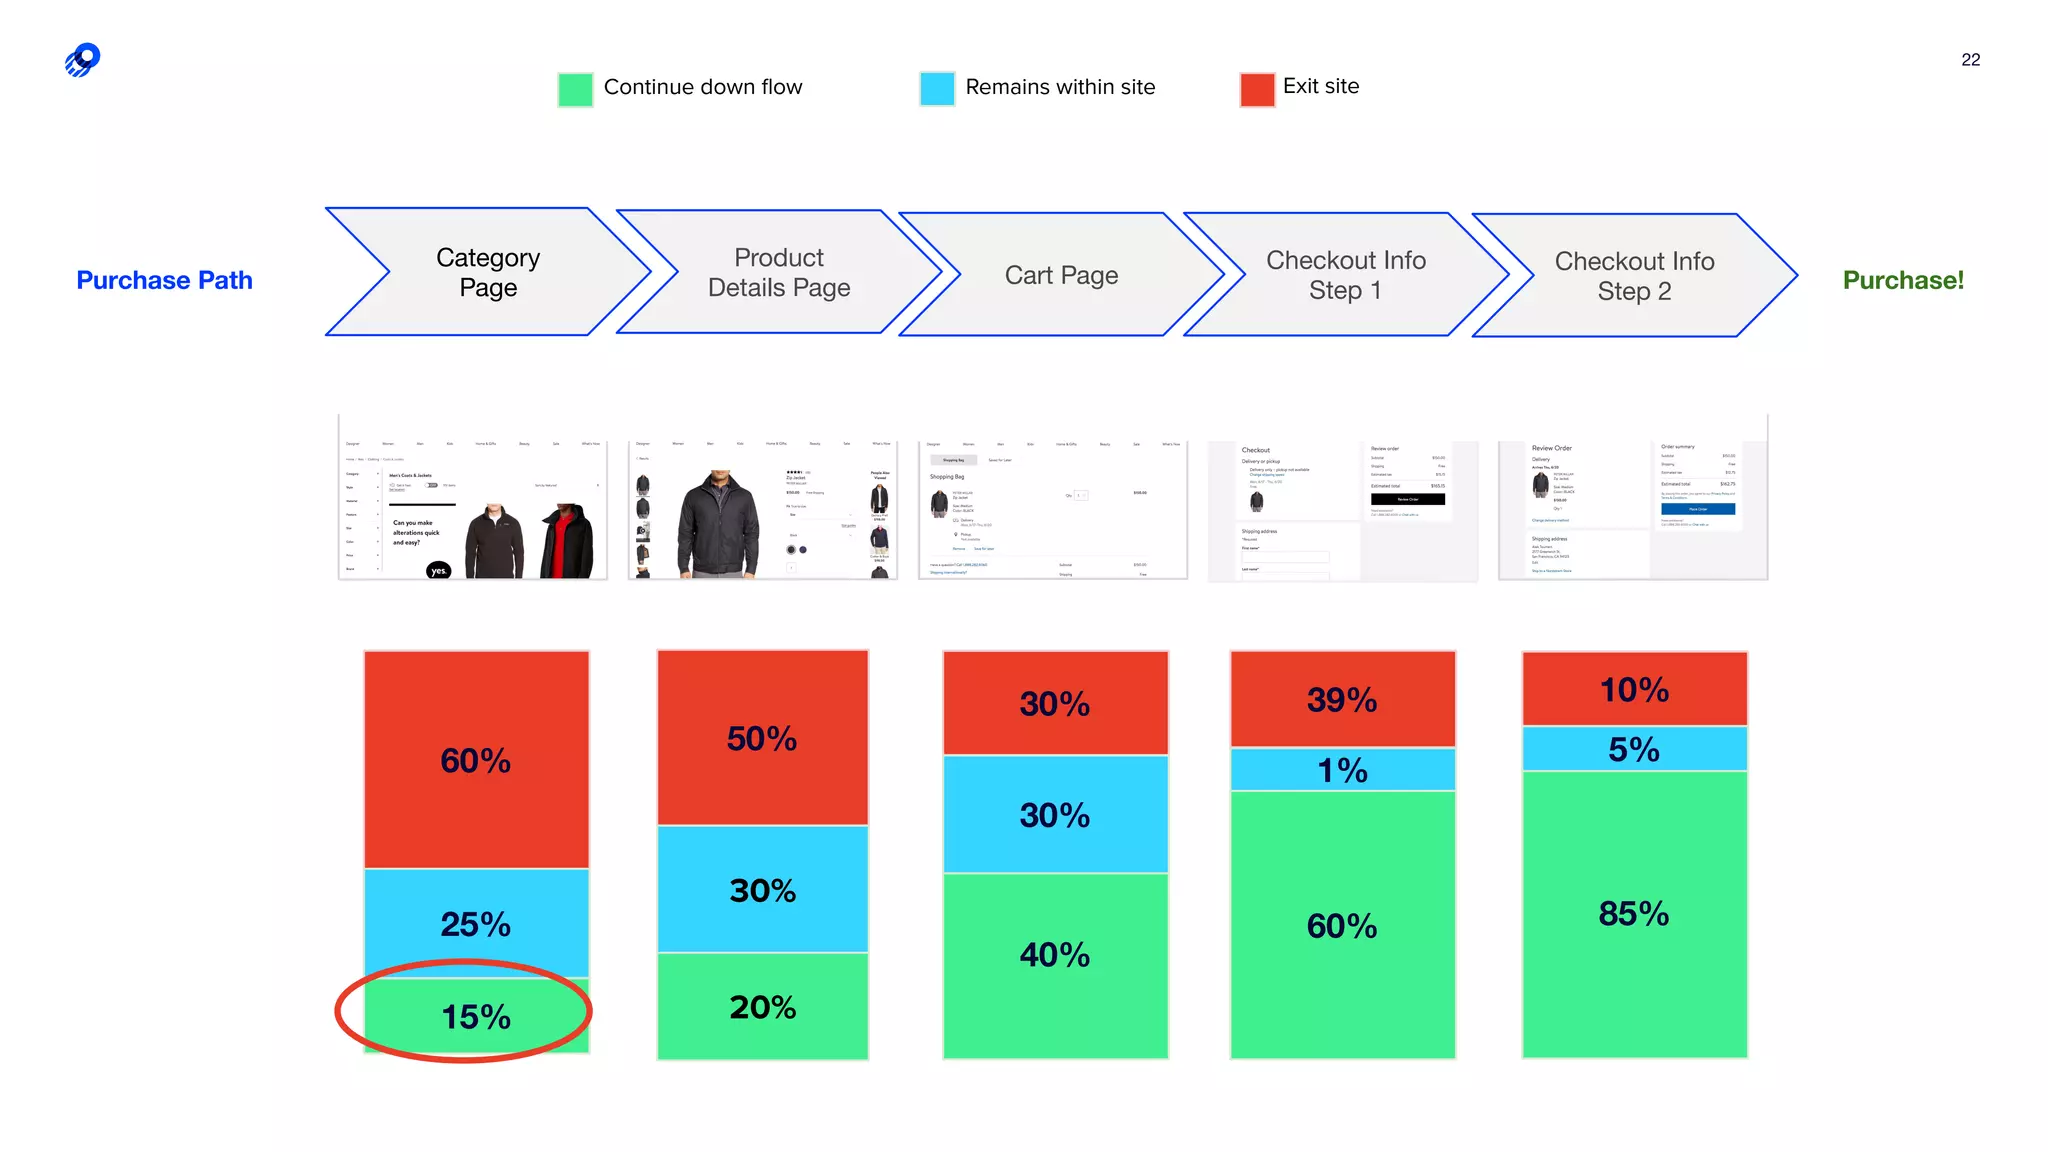


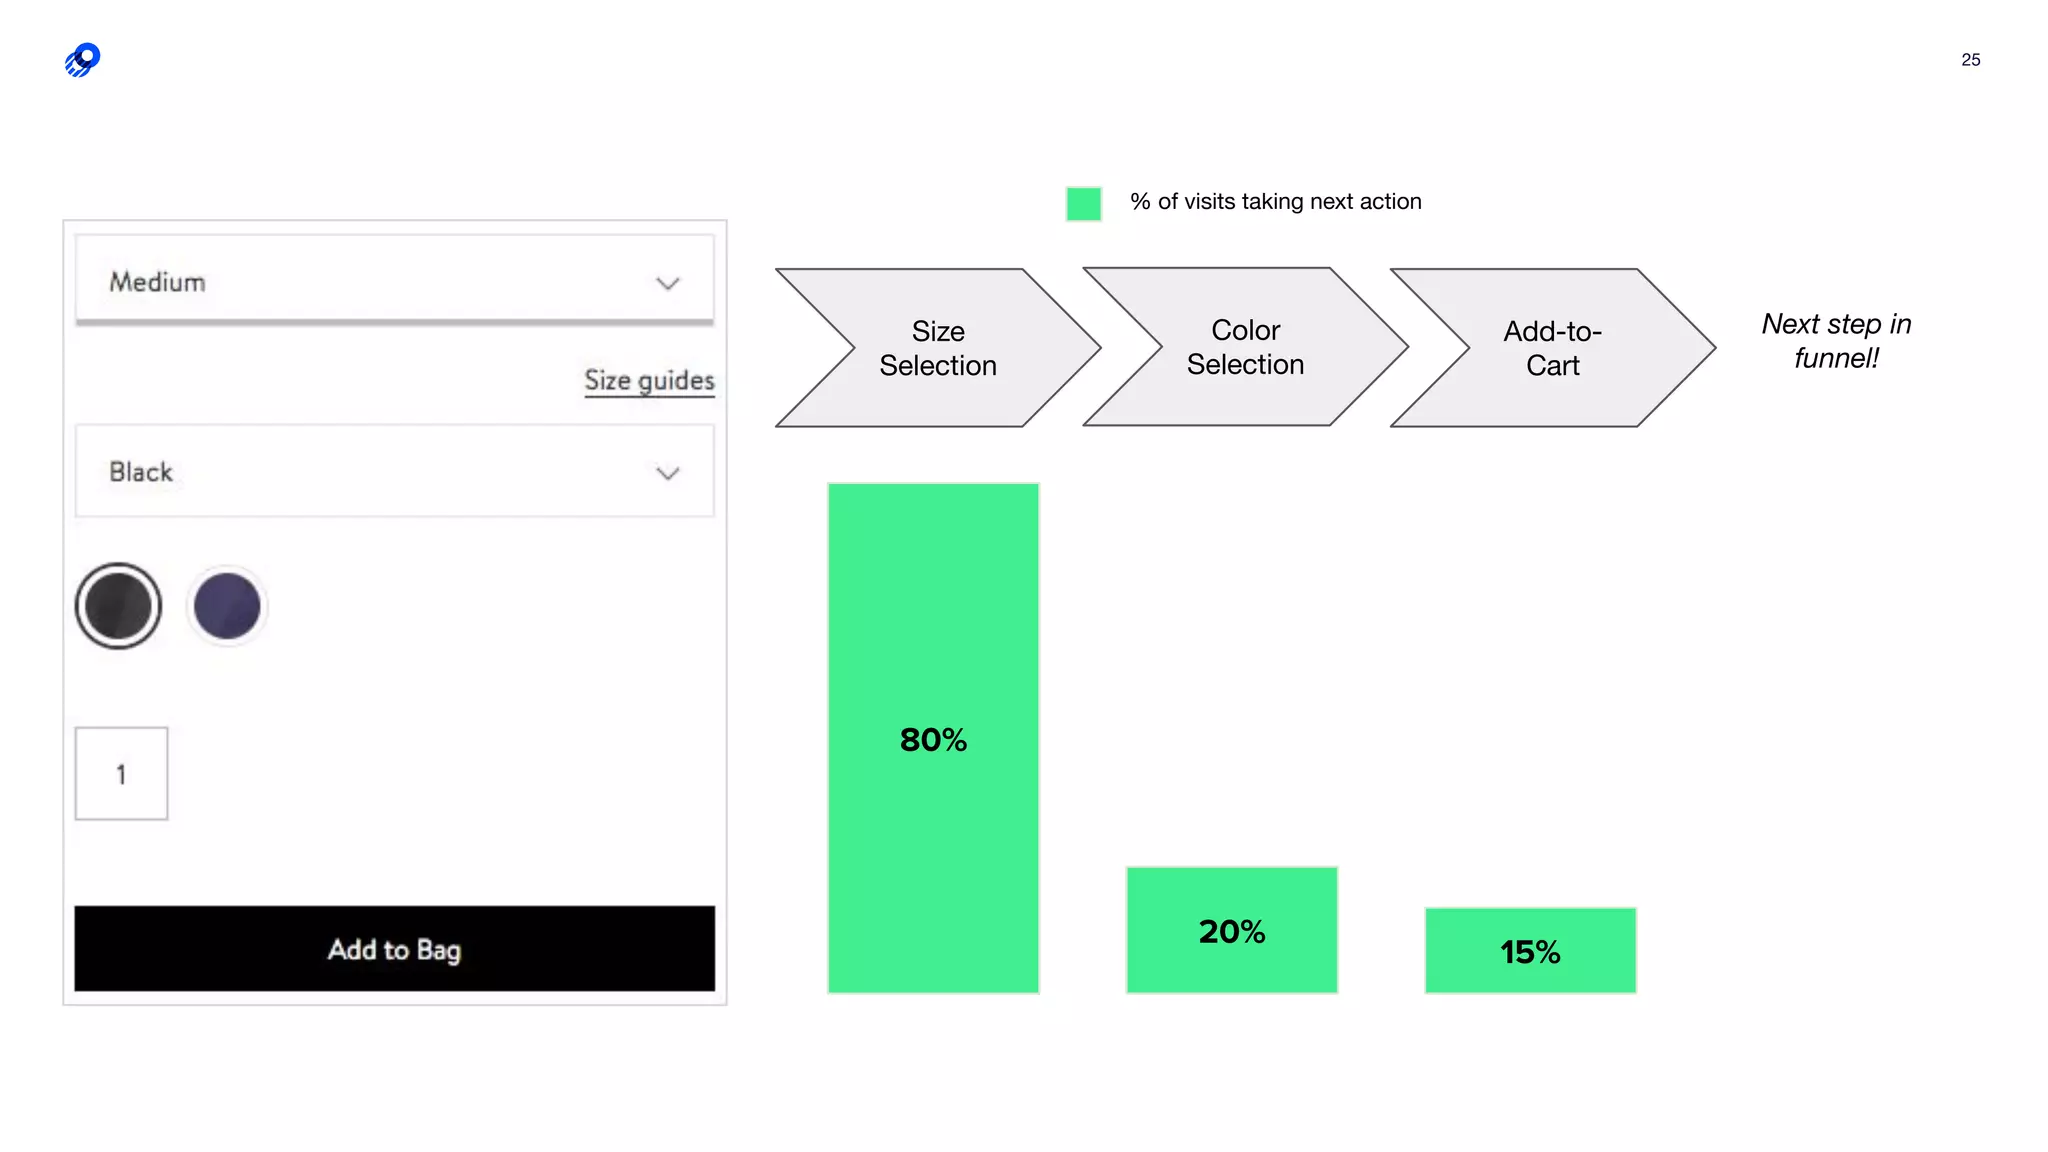

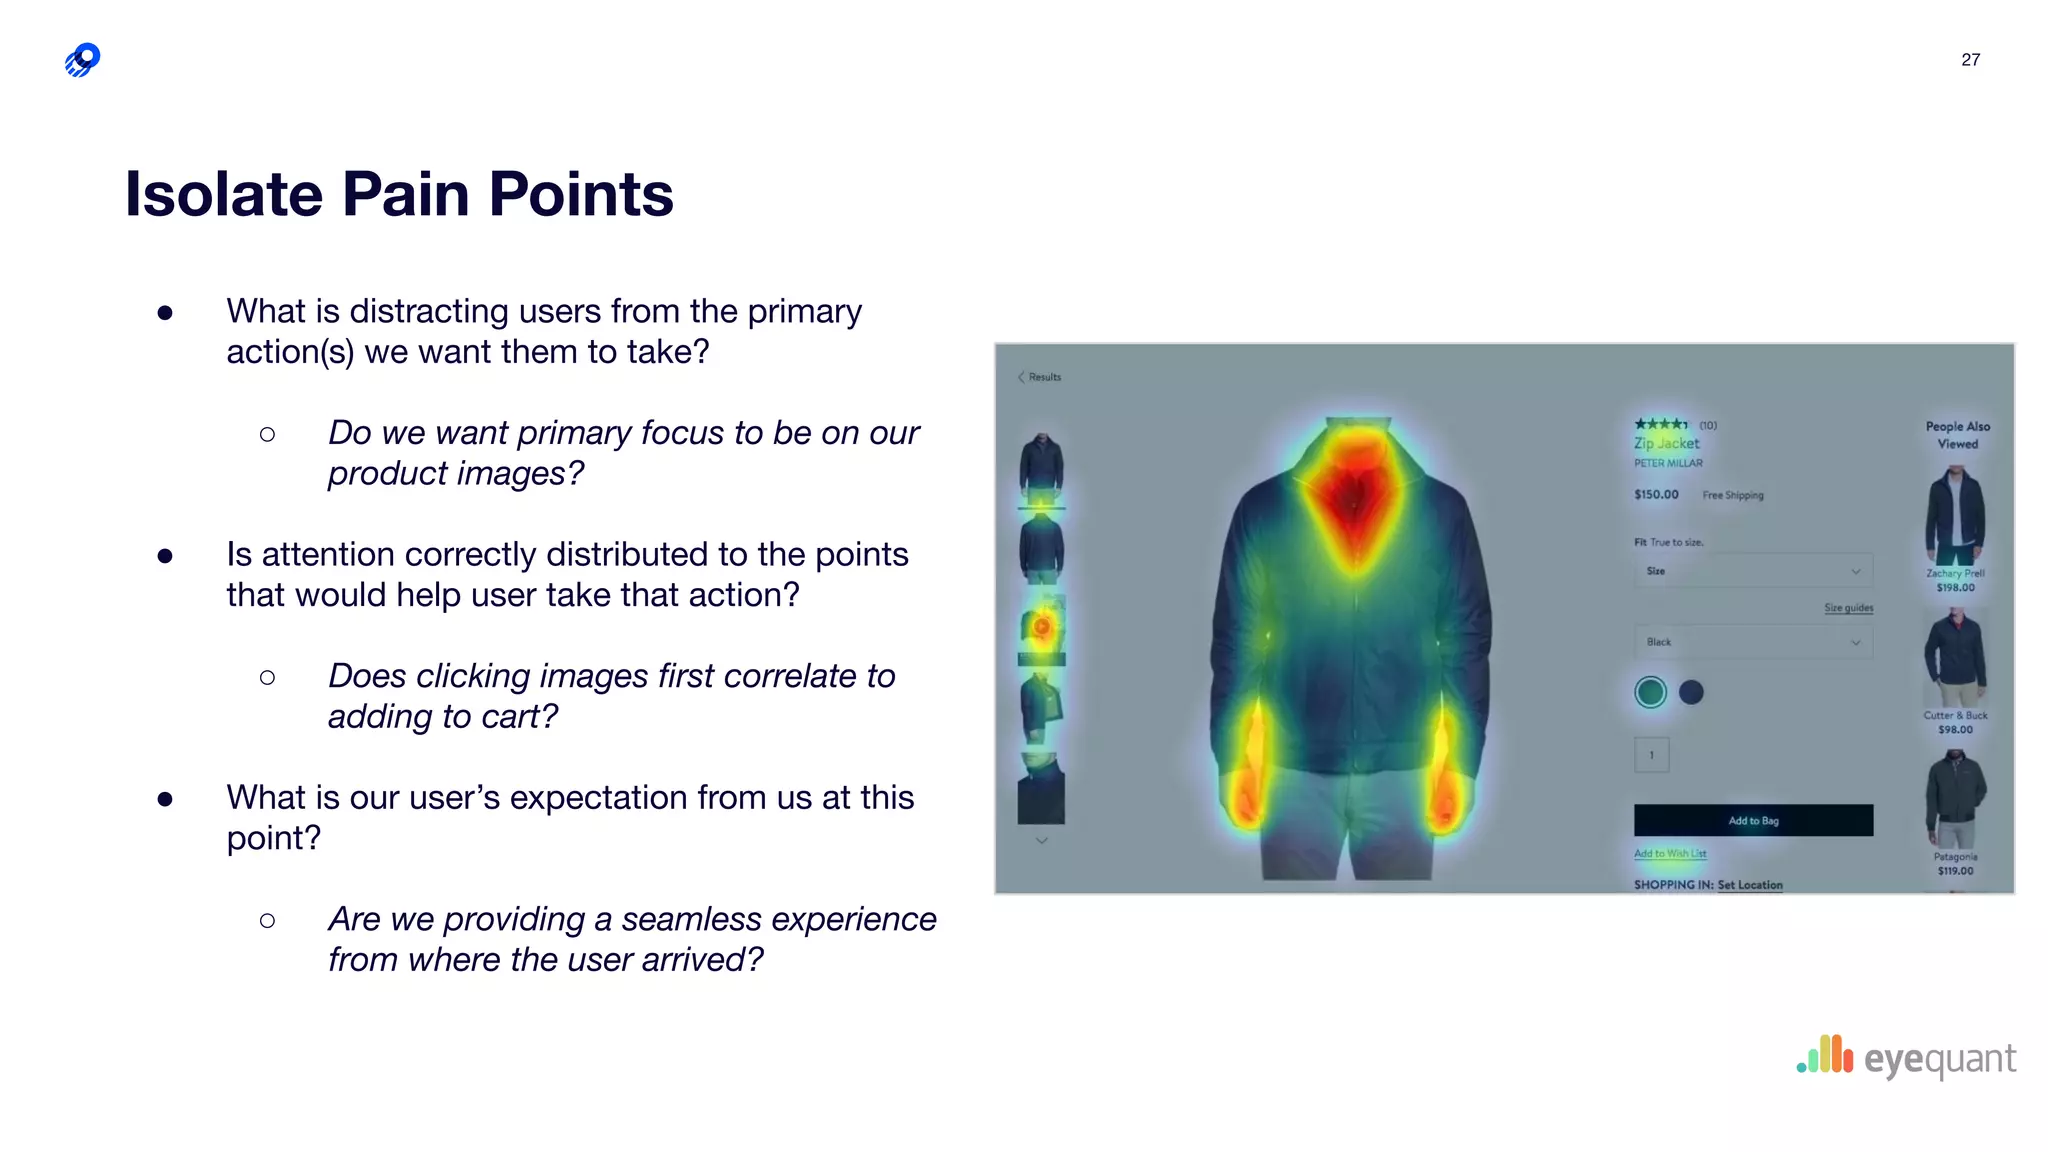
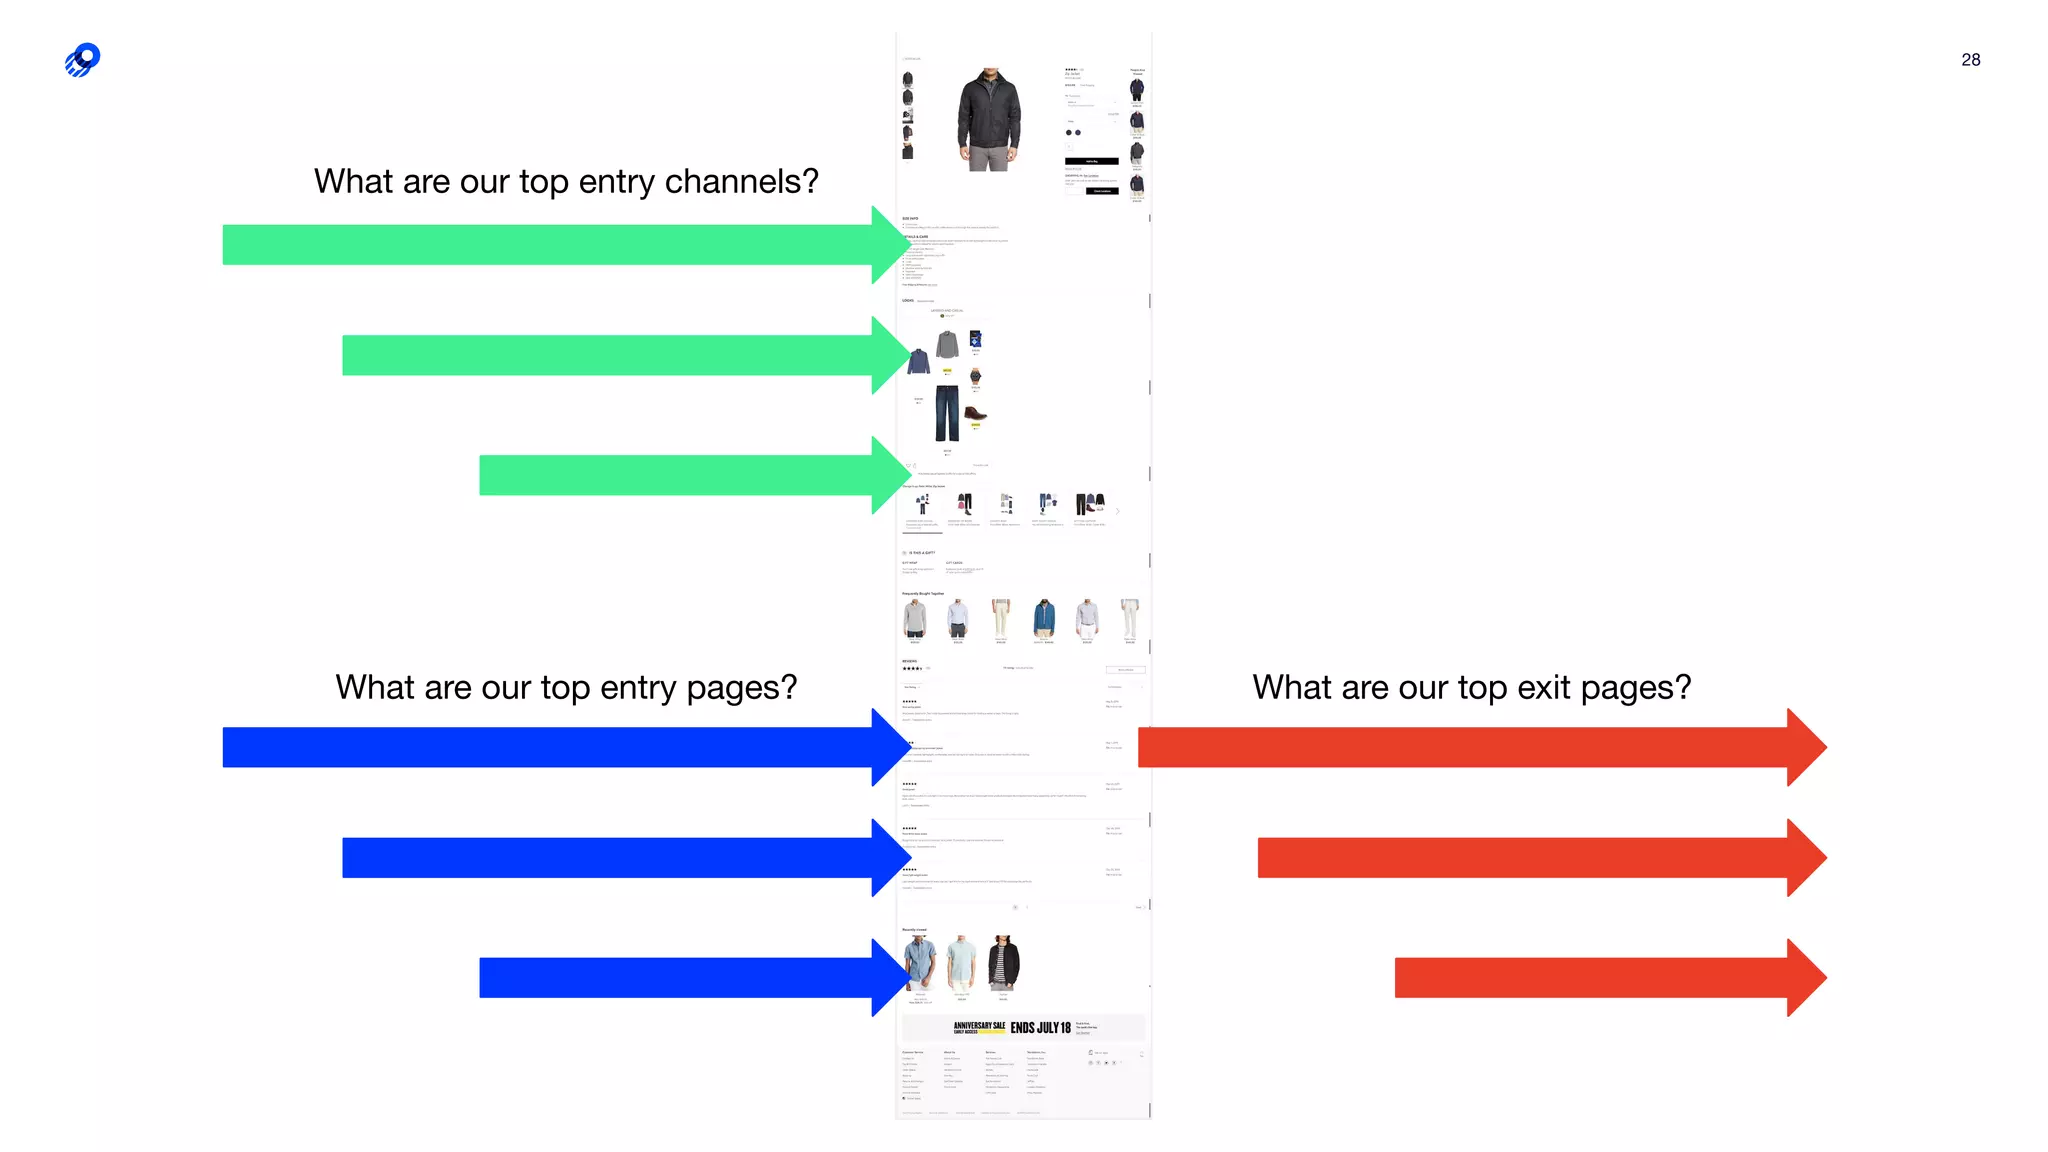


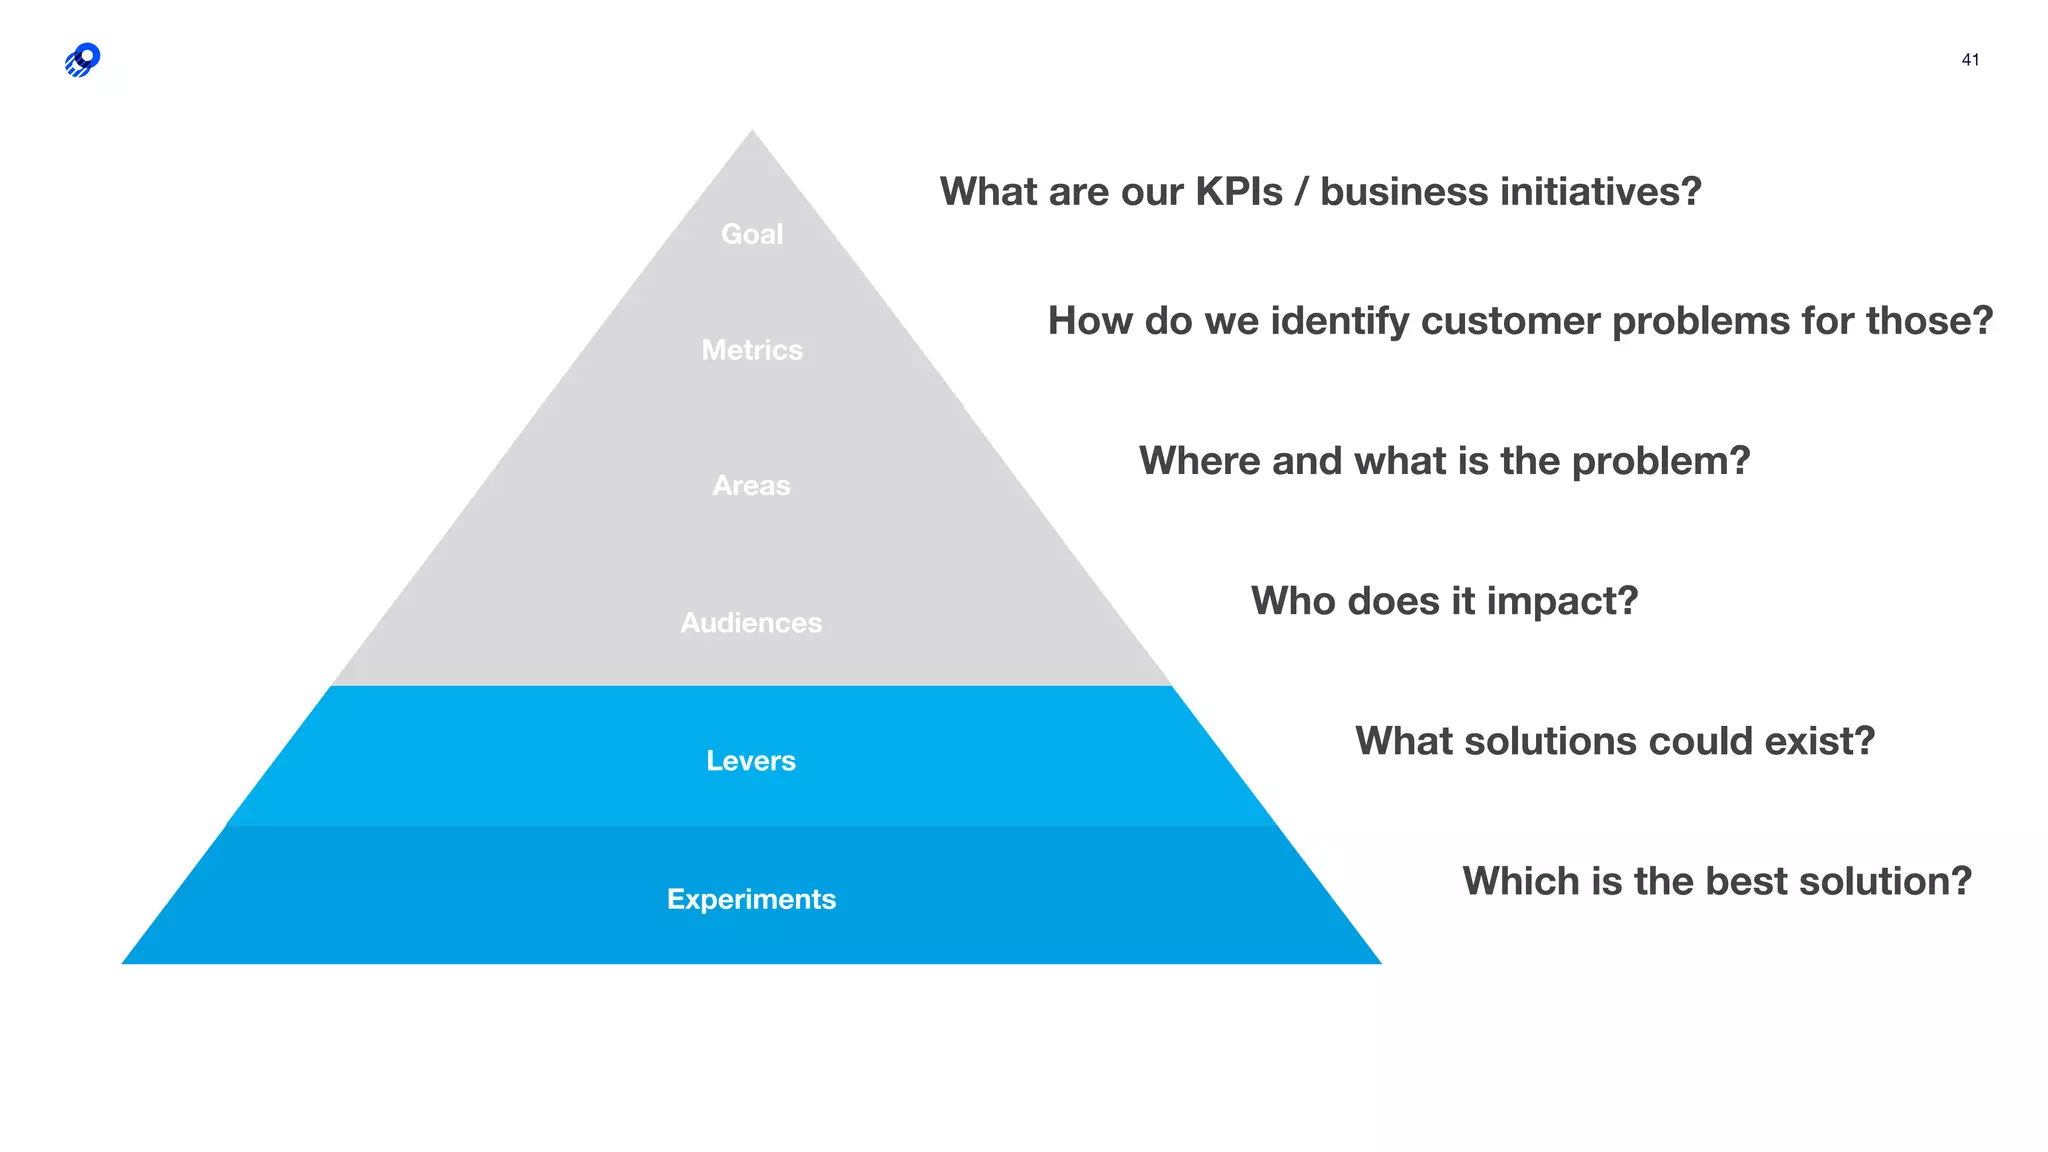

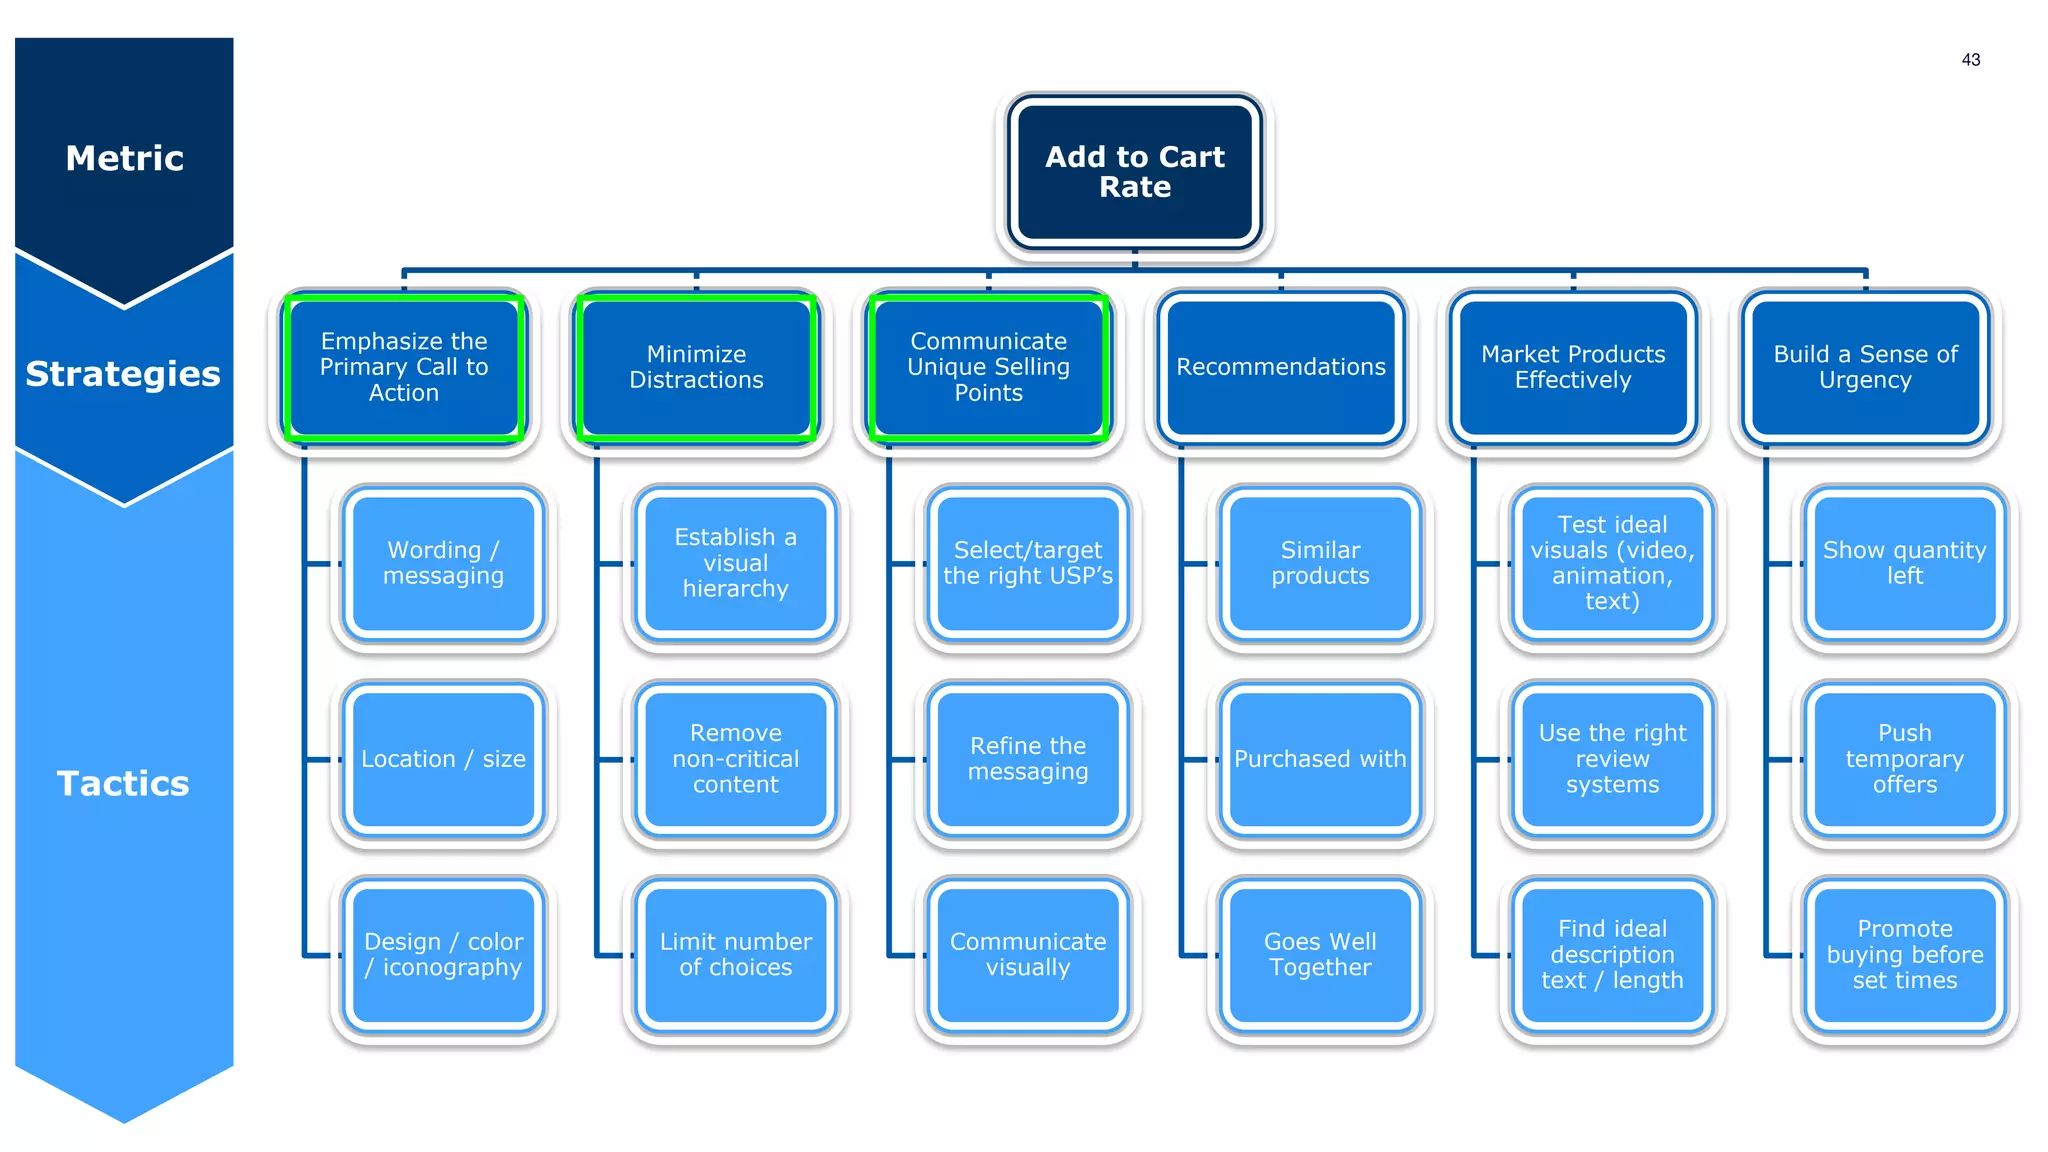
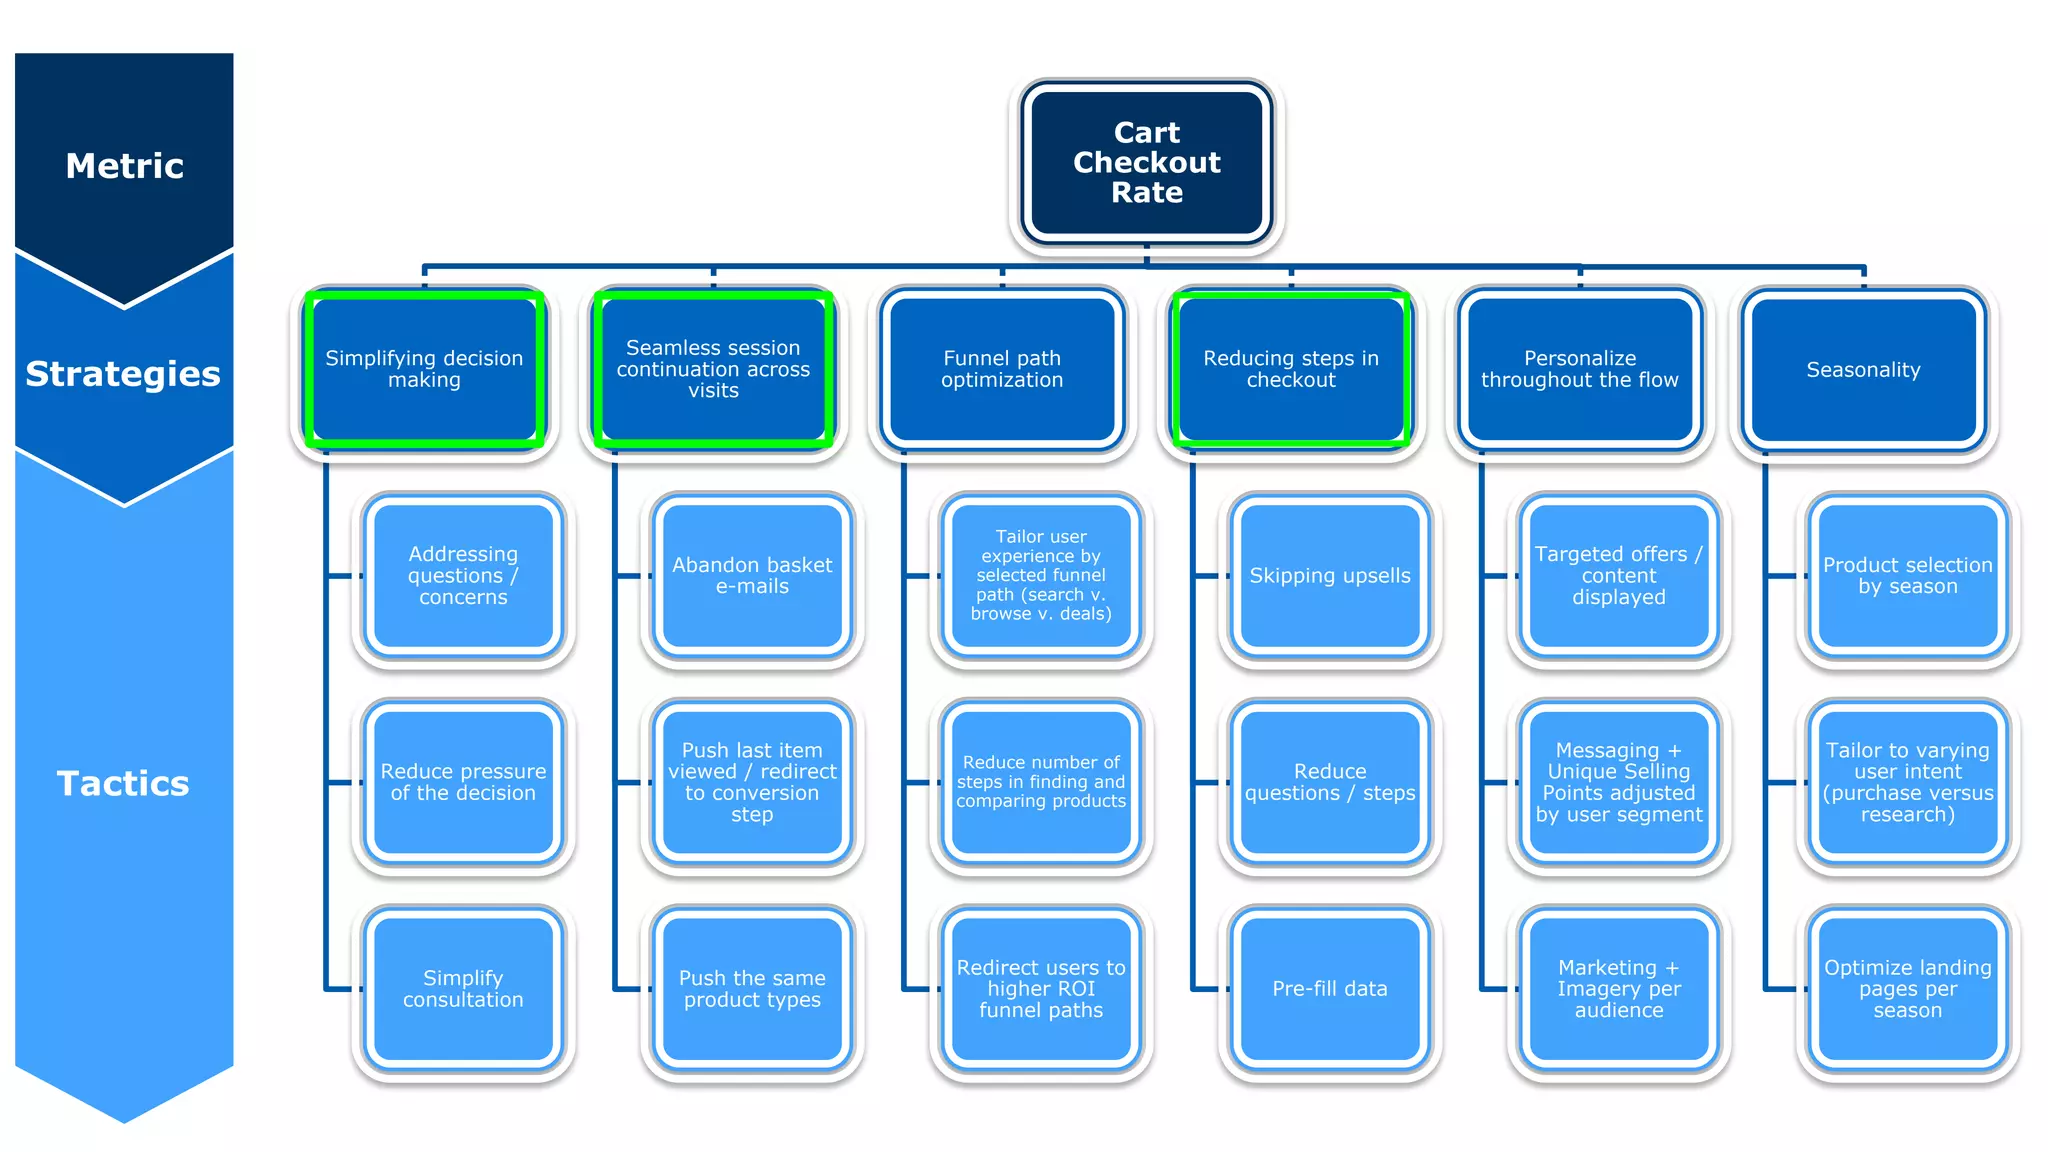
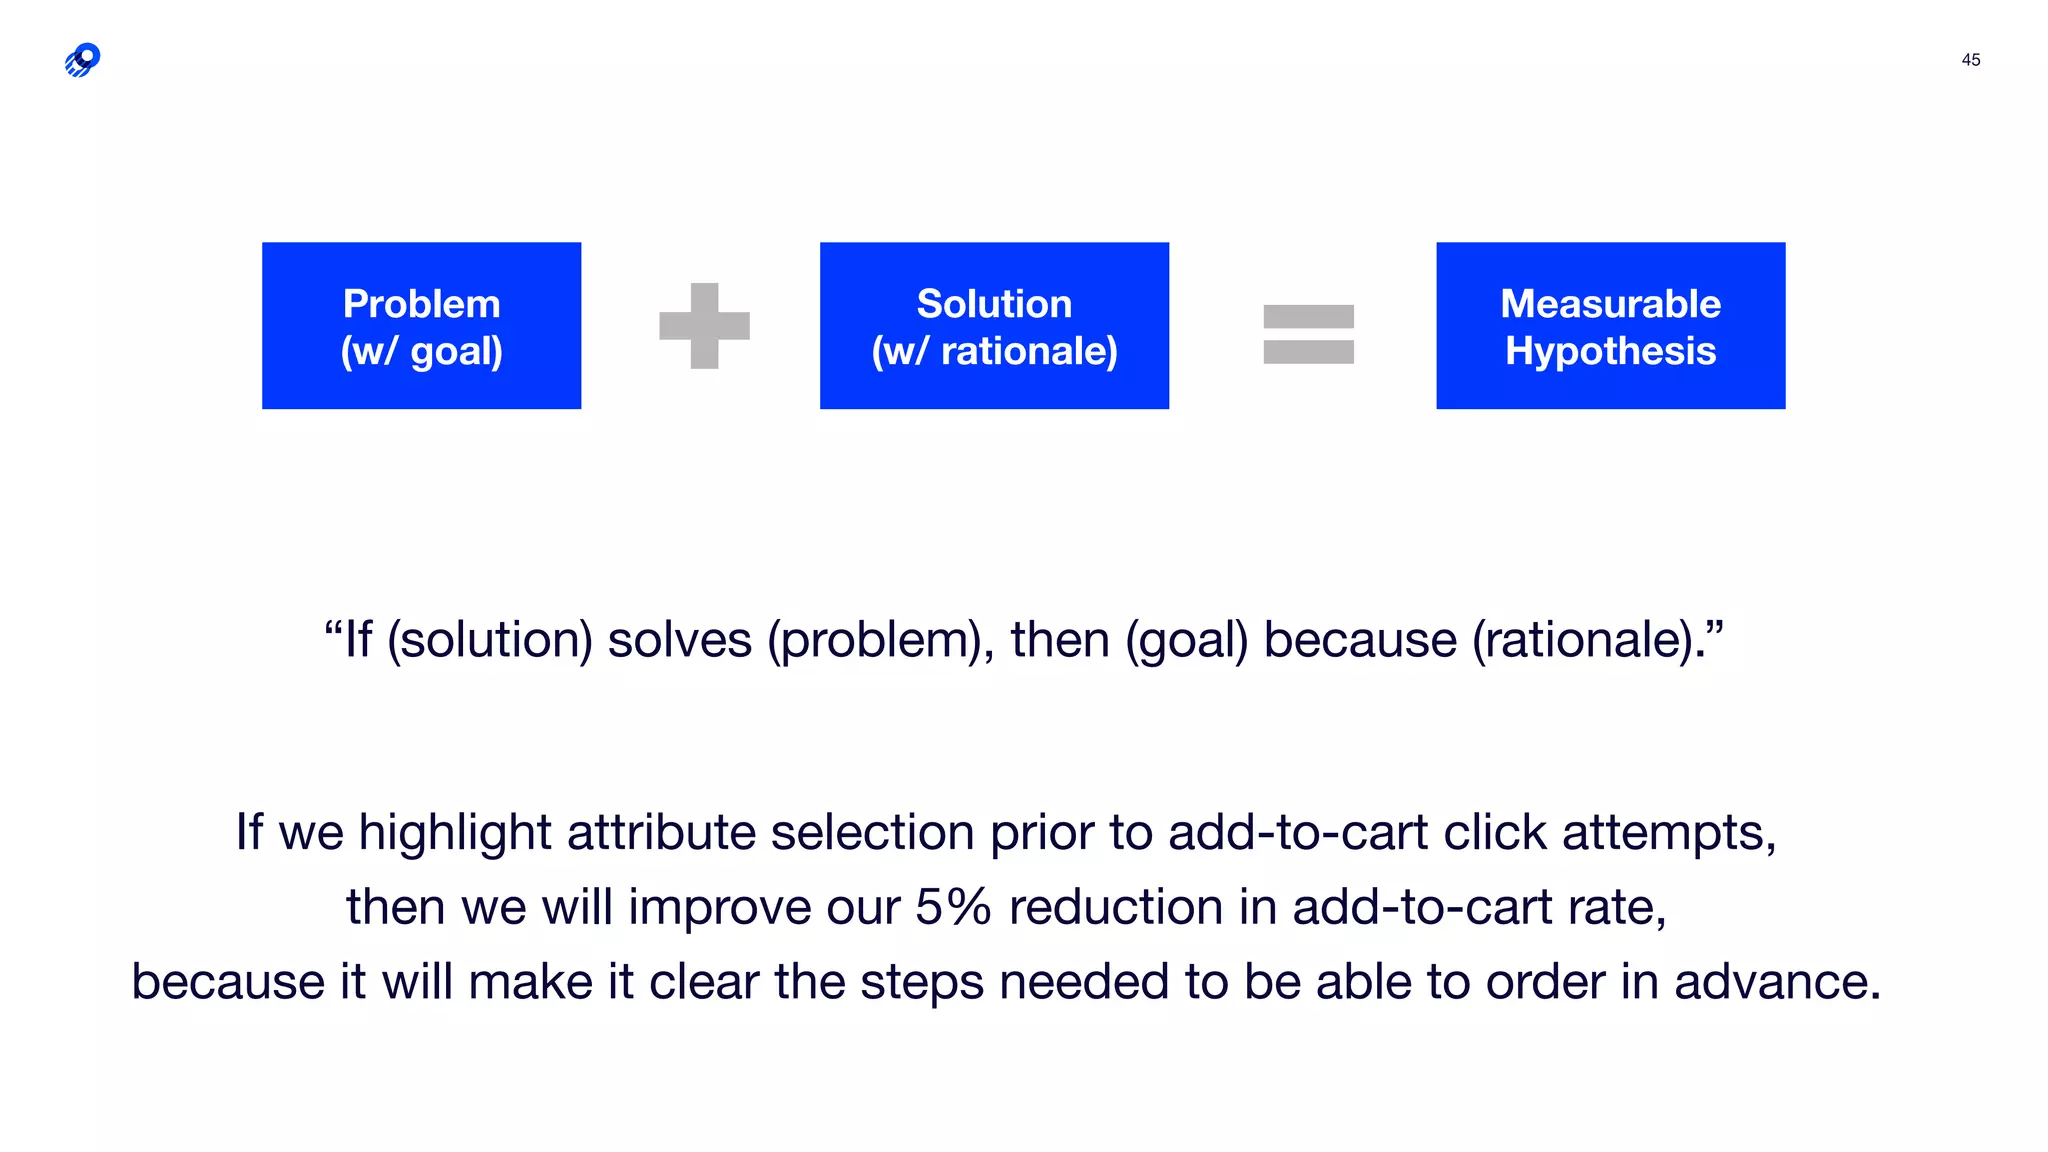

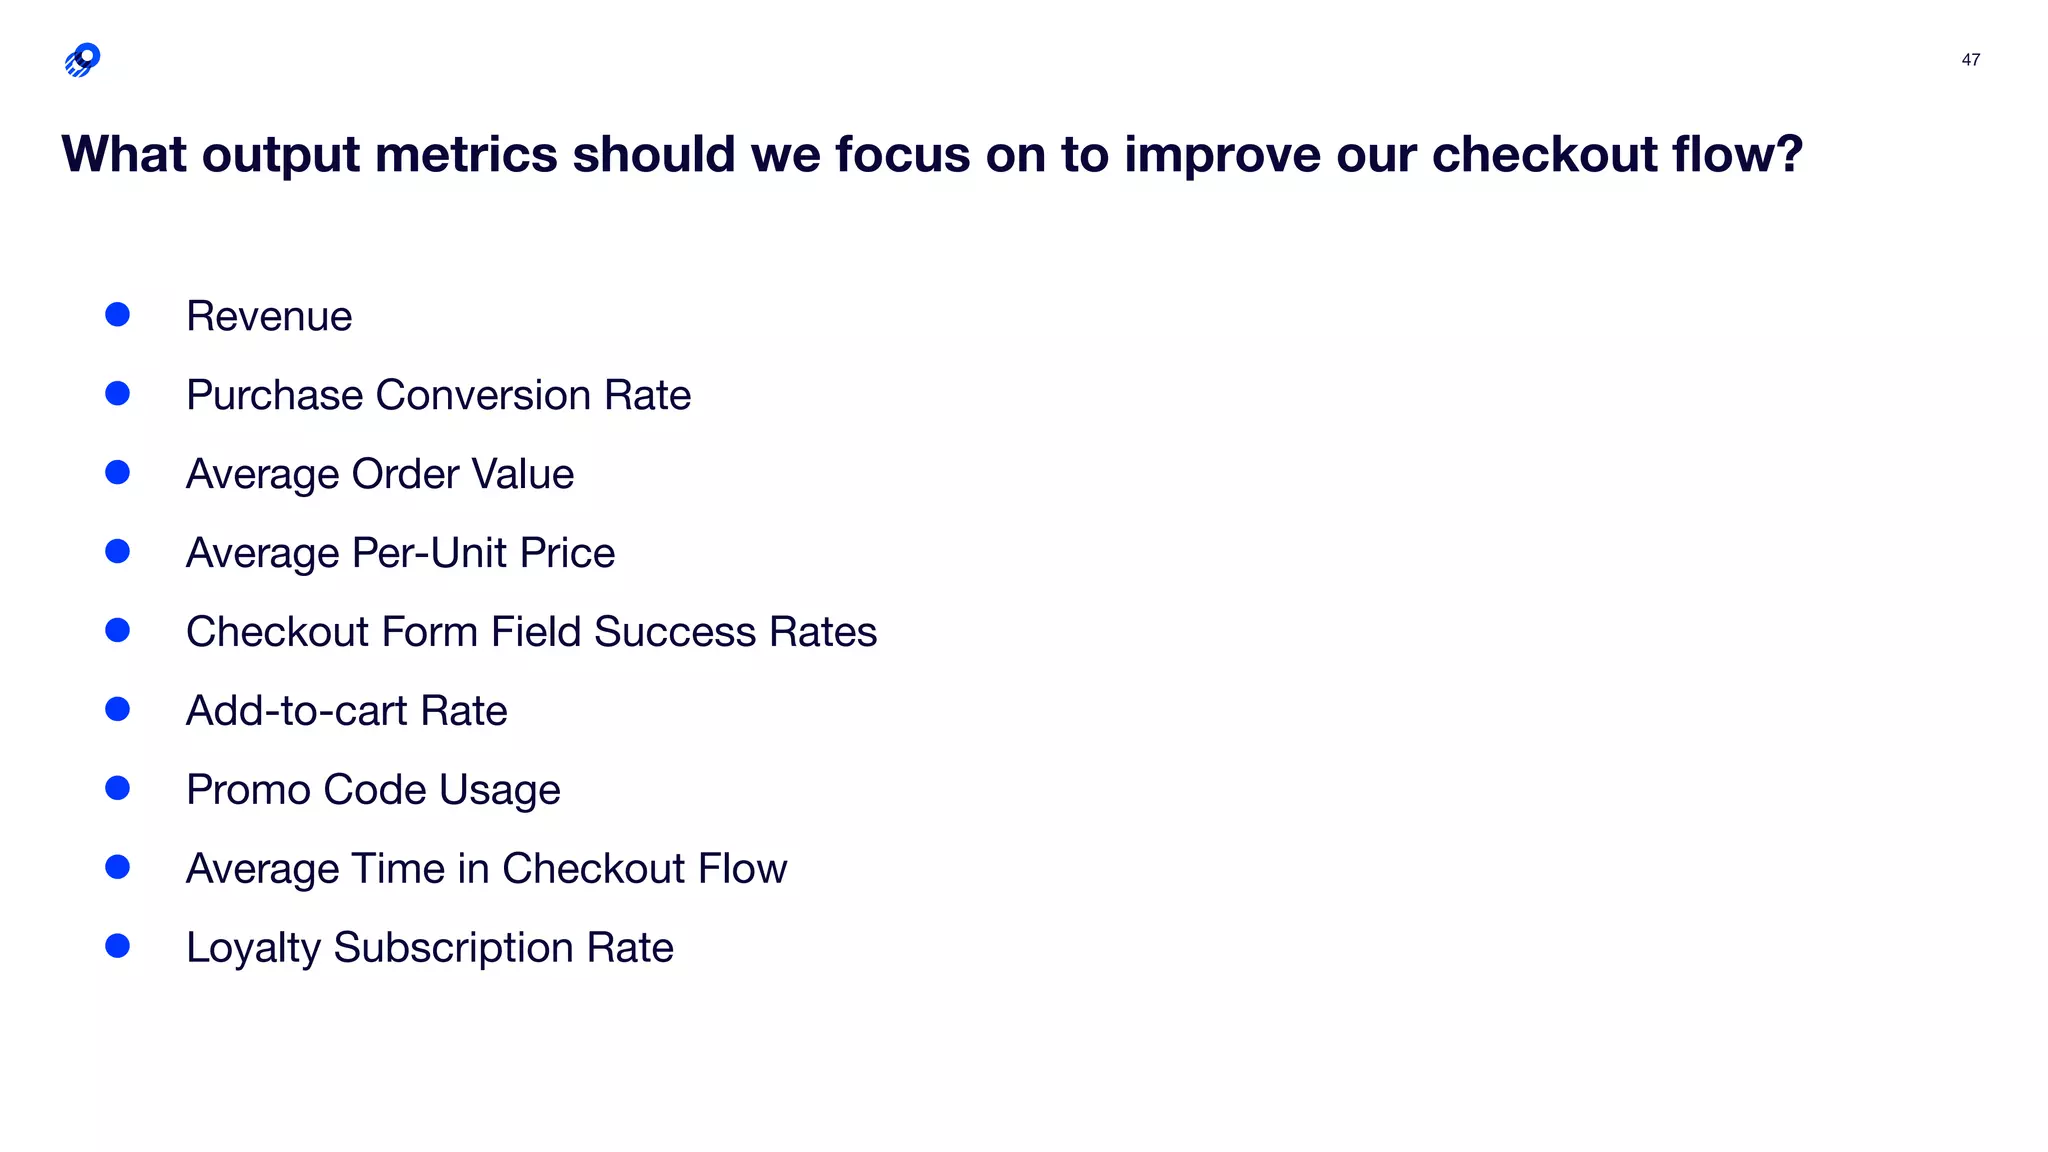
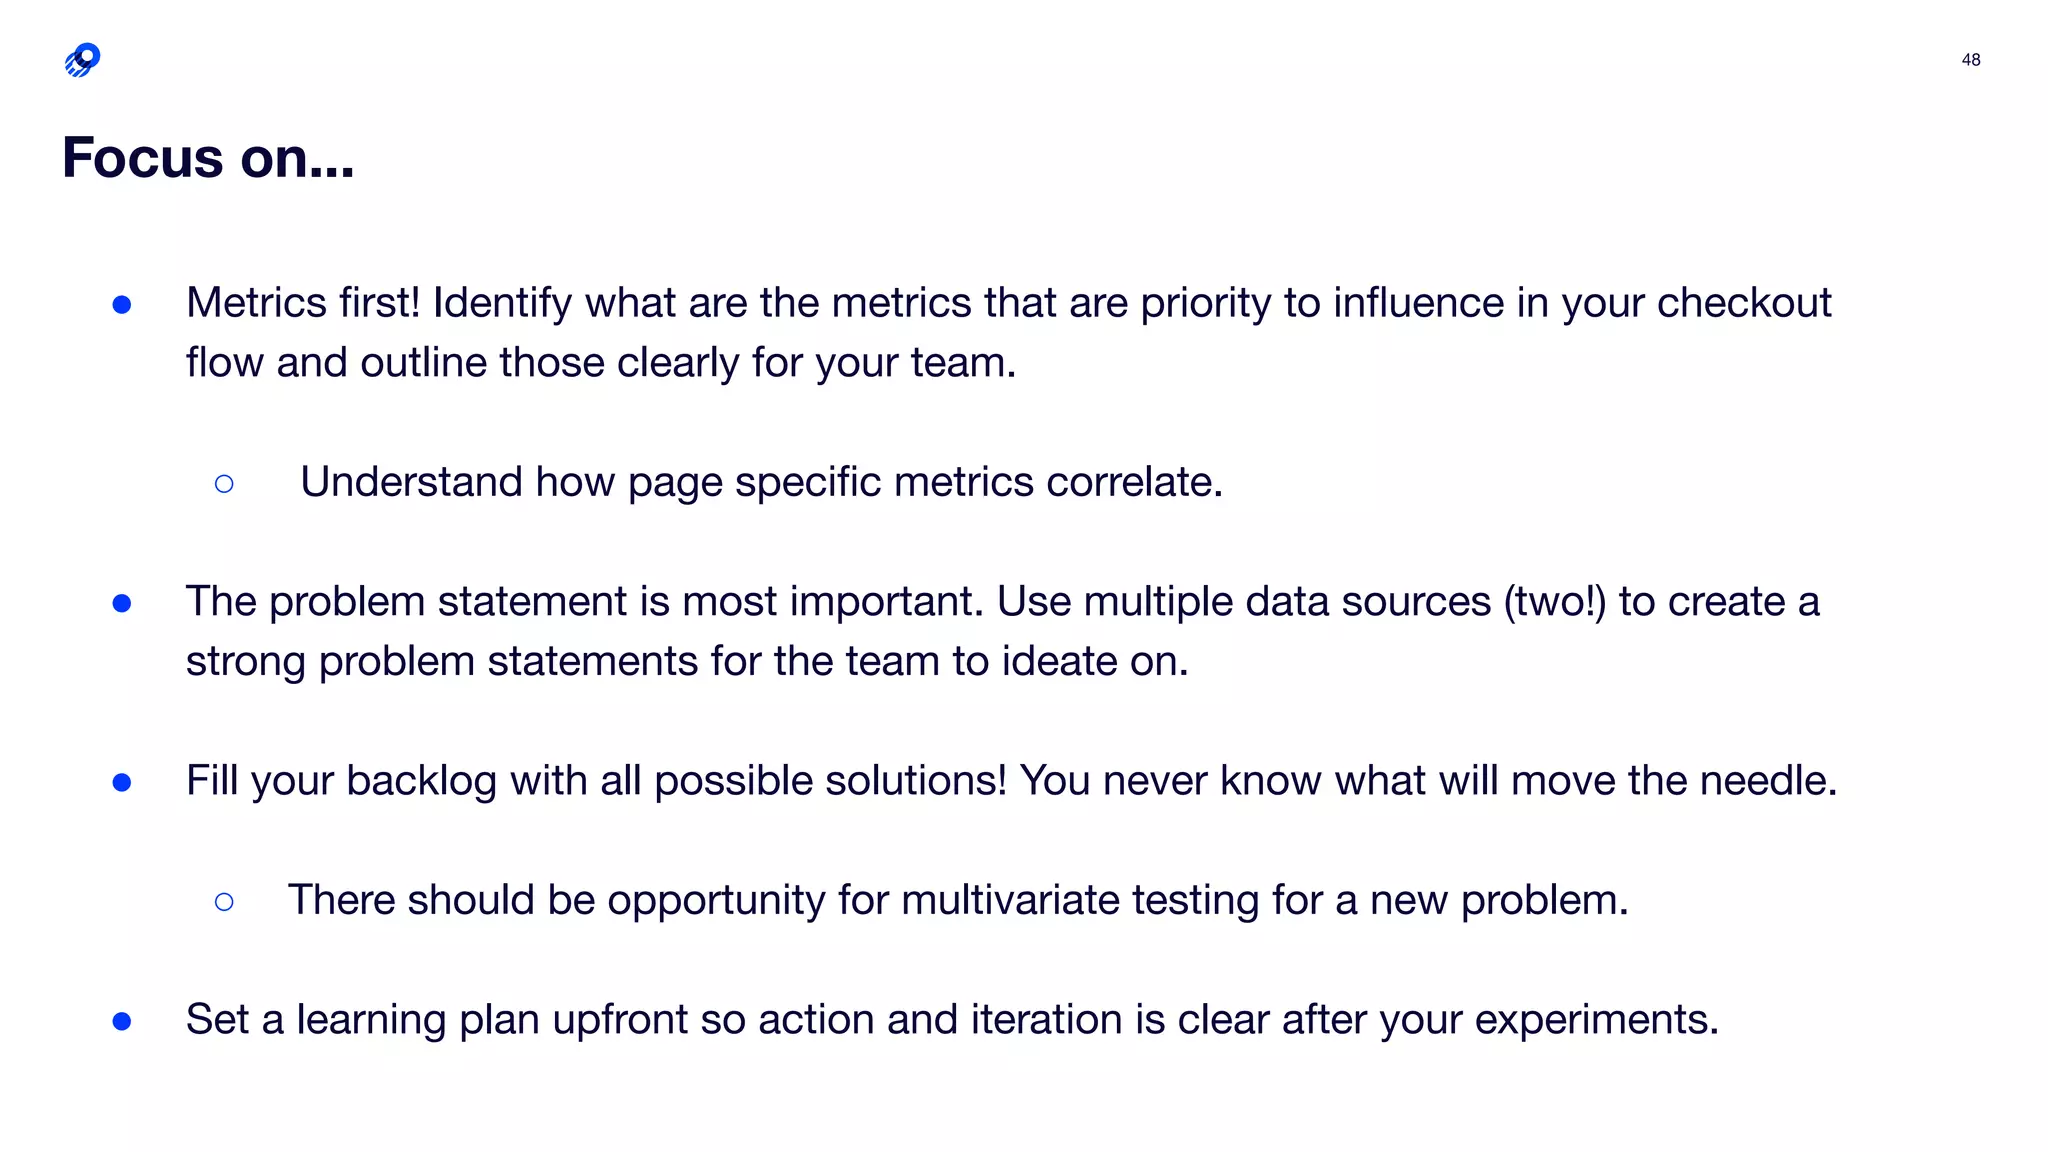


The document outlines strategies for optimizing the checkout flow to enhance customer engagement and improve conversion rates. It emphasizes the importance of identifying key metrics, understanding customer problems, and implementing a structured experimentation methodology. Additionally, it discusses the significance of using both direct and indirect data to inform decision-making and hypotheses for testing.


