Download as PDF, PPTX


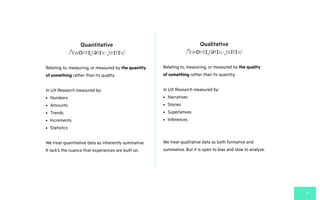


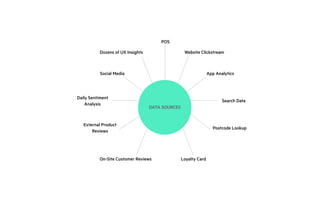
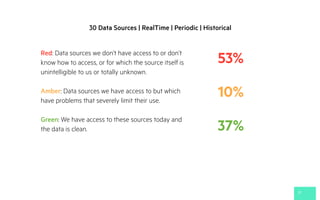
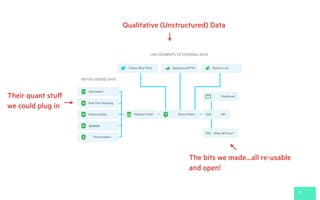

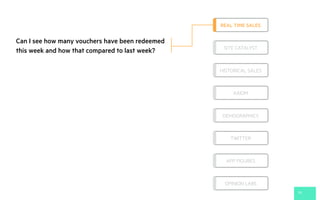
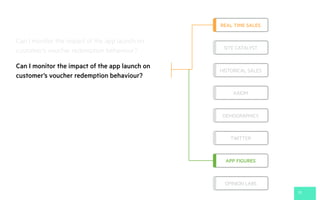


The document discusses the importance of integrating quantitative and qualitative data in UX research, emphasizing the need for faster, more relevant analysis to inform decision-making. It critiques the current state of UX research as slow and costly, leading to missed insights on customer behavior. Key points include the necessity of combining different data sources and the challenges posed by data access and privacy regulations.


