Alembic Pharma Q1FY15: EBITDA margins improved by ~285 bps y-o-y; Hold
•
1 like•284 views

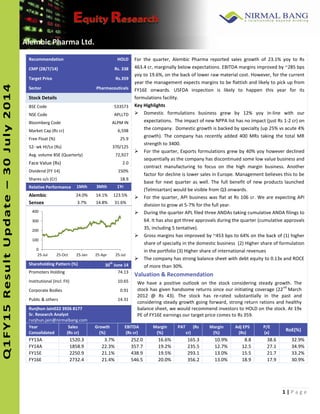
For the quarter, Alembic Pharma reported sales growth of 23.1% yoy to Rs 463.4 cr, marginally below expectations. EBITDA margins improved by ~285 bps yoy to 19.6%, on the back of lower raw material cost. Hold for a target of Rs359.

Recommended
Recommended
More Related Content
What's hot
What's hot (19)
Similar to Alembic Pharma Q1FY15: EBITDA margins improved by ~285 bps y-o-y; Hold
Similar to Alembic Pharma Q1FY15: EBITDA margins improved by ~285 bps y-o-y; Hold (20)
More from IndiaNotes.com
More from IndiaNotes.com (20)
Recently uploaded
Recently uploaded (20)
Alembic Pharma Q1FY15: EBITDA margins improved by ~285 bps y-o-y; Hold
- 1. 1 | P a g e InitiatingCoverage tiatingCoverage tingCoverage gCoverage Coverage verage rage ge Alembic Pharma Ltd. Q1FY15ResultUpdate–30July2014 4 Recommendation HOLD For the quarter, Alembic Pharma reported sales growth of 23.1% yoy to Rs 463.4 cr, marginally below expectations. EBITDA margins improved by ~285 bps yoy to 19.6%, on the back of lower raw material cost. However, for the current year the management expects margins to be flattish and likely to pick up from FY16E onwards. USFDA inspection is likely to happen this year for its formulations facility. Key Highlights Domestic formulations business grew by 12% yoy in-line with our expectations. The impact of new NPPA list has no impact (just Rs 1-2 cr) on the company. Domestic growth is backed by specialty (up 25% vs acute 4% growth). The company has recently added 400 MRs taking the total MR strength to 3400. For the quarter, Exports formulations grew by 40% yoy however declined sequentially as the company has discontinued some low value business and contract manufacturing to focus on the high margin business. Another factor for decline is lower sales in Europe. Management believes this to be base for next quarter as well. The full benefit of new products launched (Telmisartan) would be visible from Q3 onwards. For the quarter, API business was flat at Rs 106 cr. We are expecting API division to grow at 5-7% for the full year. During the quarter APL filed three ANDAs taking cumulative ANDA filings to 64. It has also got three approvals during the quarter (cumulative approvals 35, including 5 tentative). Gross margins has improved by ~453 bps to 64% on the back of (1) higher share of specialty in the domestic business (2) Higher share of formulation in the portfolio (3) Higher share of international revenues The company has strong balance sheet with debt equity to 0.13x and ROCE of more than 30%. Valuation & Recommendation We have a positive outlook on the stock considering steady growth. The stock has given handsome returns since our initiating coverage (22 nd March 2012 @ Rs 43). The stock has re-rated substantially in the past and considering steady growth going forward, strong return rations and healthy balance sheet, we would recommend investors to HOLD on the stock. At 19x PE of FY16E earnings our target price comes to Rs 359. CMP (28/7/14) Rs. 338 Target Price Rs.359 Sector Pharmaceuticals Stock Details BSE Code 533573 NSE Code APLLTD Bloomberg Code ALPM IN Market Cap (Rs cr) 6,598 Free Float (%) 25.9 52- wk HI/Lo (Rs) 370/125 Avg. volume BSE (Quarterly) 72,927 Face Value (Rs) 2.0 Dividend (FY 14) 150% Shares o/s (Cr) 18.9 Relative Performance 1Mth 3Mth 1Yr Alembic 24.0% 14.1% 123.5% Sensex 3.7% 14.8% 31.6% Shareholding Pattern (%) 30 th June 14 Promoters Holding 74.13 Institutional (Incl. FII) 10.65 Corporate Bodies 0.91 Public & others 14.31 Runjhun Jain022 3926 8177 Sr. Research Analyst runjhun.jain@nirmalbang.com Year Consolidated Sales (Rs cr) Growth (%) EBITDA (Rs cr) Margin (%) PAT (Rs cr) Margin (%) Adj EPS (Rs) P/E (x) RoE(%) FY13A 1520.3 3.7% 252.0 16.6% 165.3 10.9% 8.8 38.6 32.9% FY14A 1858.9 22.3% 357.7 19.2% 235.5 12.7% 12.5 27.1 34.9% FY15E 2250.9 21.1% 438.9 19.5% 293.1 13.0% 15.5 21.7 33.2% FY16E 2732.4 21.4% 546.5 20.0% 356.2 13.0% 18.9 17.9 30.9% 0 100 200 300 400 25-Jul 25-Oct 25-Jan 25-Apr 25-Jul
- 2. 2 | P a g e InitiatingCoverage tiatingCoverage tingCoverage gCoverage Coverage verage rage ge Alembic Pharma Ltd. Q1FY15ResultUpdate–30July2014 Quarterly Result Revenue Breakup Consolidated (Rs cr) Q1FY15 Q4FY14 qoq Q1FY14 yoy Total Revenues 492.8 463.4 6.3 426.4 15.6 Cost of Materials 177.0 176.2 0.4 172.4 2.6 Staff cost 75.6 67.2 12.6 56.4 34.2 Other Exps 143.5 128.7 11.5 126.1 13.8 Total Expenses 396.1 372.1 6.4 354.9 11.6 EBITDA 96.7 91.3 5.9 71.5 35.2 margins 19.6% 19.7% 16.8% Depreciation 10.7 11.0 -2.5 9.5 12.4 EBIT 86.0 80.3 7.0 62.0 38.8 Interest 0.6 2.3 -75.5 1.5 -61.9 Other income 0.2 2.8 -93.5 0.0 800.0 PBT 85.6 80.8 5.9 60.5 41.5 Tax 20.3 19.5 4.1 13.9 46.3 Tax rate 23.7% 24.1% 22.9% PAT 65.3 61.3 6.5 46.6 40.0 Equity Capital 37.7 37.7 37.7 FV 2.0 2.0 2.0 EPS 3.5 3.3 6.5 2.5 40.0 Particulars (Rs cr) Q1FY15 Q4FY14 qoq Q1FY14 yoy Formulations 385.0 382.3 0.7% 318.9 20.7% Domestic 248.5 228.1 8.9% 221.2 12.3% Export - Branded 22.7 17.6 28.9% 12.2 85.9% Regulatory - Generics 113.8 136.7 -16.7% 85.5 33.1% API 106.3 81.0 31.3% 107.0 -0.6% Domestic 0.0 14.4 -100.0% 20.2 -100.0% Export 0.0 63.7 -100.0% 86.8 -100.0% Export Incentive & Others 4.8 1.9 156.9% 2.9 66.6% Gross Sales 496.1 465.2 6.6% 428.8 15.7%
- 3. 3 | P a g e InitiatingCoverage tiatingCoverage tingCoverage gCoverage Coverage verage rage ge Alembic Pharma Ltd. Q1FY15ResultUpdate–30July2014 Financials P&L (Rs. Cr) FY13A FY14E FY15E FY16E Balance Sheet (Rs Cr) FY13A FY14E FY15E FY16E Net Sales 1520.3 1858.9 2250.9 2732.4 Share Capital 37.7 37.7 37.7 37.7 % change 3.7% 22.3% 21.1% 21.4% Reserves & Surplus 465.2 637.9 845.3 1114.6 EBITDA 252.0 357.7 438.9 546.5 Net Worth 675.6 883.0 1152.3 0.0 EBITDA margin (%) 16.6% 19.2% 19.5% 20.0% Deferred Tax Liab. 13.9 22.7 22.7 22.7 Depn & Amort 35.0 40.5 50.6 78.3 Other Non-Current Liab. 6.1 6.7 6.7 6.7 Operating income 217.0 317.2 388.3 468.2 Total Borrowings 206.6 143.5 223.5 223.5 Interest 14.6 9.8 17.0 17.0 Trade Payables 240.0 288.4 367.2 440.2 Other Income 3.9 3.2 4.5 5.5 Prov. & Other CL 131.5 134.1 134.1 134.1 PBT 206.4 310.6 375.8 456.6 Total Liabilities 1047.8 1217.8 1584.0 1926.3 Tax 41.1 75.1 82.7 100.5 NFA + CWIP 376.5 417.6 617.0 763.7 EO 0.0 0.0 0.0 0.0 Total Investments 3.3 3.4 3.4 3.4 Reported PAT 165.3 235.5 293.1 356.2 Total Loans & Advances 152.2 188.7 227.3 273.2 Adj PAT 165.3 235.5 293.1 356.2 Inventories 266.8 310.8 379.8 455.4 Sh o/s - Diluted 18.9 18.9 18.9 18.9 Debtors 232.9 273.4 343.9 417.4 Adj EPS 8.8 12.5 15.5 18.9 Cash & Bank 16.1 24.0 12.5 13.1 EPS growth (%) 93.5% 80.9% 77.4% 51.3% Total Assets 1047.8 1217.8 1584.0 1926.3 Cash EPS 10.6 14.6 18.2 23.0 Cash Flow (Rs. Cr) FY13A FY14E FY15E FY16E Quarterly (Rs Cr) Sept.13 Dec.13 Mar.14 Jun.14 Operating Cash Flow Net Sales 483.8 475.1 462.7 492.1 Op CF bef tax & WC 252.0 357.7 438.9 546.5 EBITDA 92.7 103.2 91.3 96.7 Change in WC 71.9 -55.6 -99.5 -122.0 Dep & Amorz 9.9 10.1 11.0 10.7 Tax -40.1 -68.5 -82.7 -100.5 Operating Income 82.9 93.1 80.3 86.0 CF from Operation 283.7 233.6 256.8 324.0 Interest 2.6 3.5 2.3 0.6 Investing Activities Other Inc. 0.7 1.0 3.5 0.8 Capex -83.6 -81.0 -250.0 -225.0 PBT 80.5 89.8 80.8 84.9 Inv & Oth Income 3.9 3.1 4.5 5.5 Tax 18.9 21.9 19.5 20.3 CF from Investing -79.7 -77.9 -245.5 -219.5 EO 0.0 0.0 0.0 0.0 Financing Adjusted PAT 61.6 67.8 61.3 64.7 Diviend Paid -55.1 -66.2 -71.5 -86.9 EPS (Rs.) 3.3 3.6 3.3 3.4 Sh Cap & Premium 0.0 0.0 0.0 0.0 Ratios FY13A FY14E FY15E FY16E Interest Paid -14.6 -9.8 -17.0 -17.0 EBITDA margin (%) 16.6% 19.2% 19.5% 20.0% Loans & Others -165.4 -71.9 65.9 0.0 Adj PAT margin (%) 10.9% 12.7% 13.0% 13.0% CF from Financing -235.1 -147.9 -22.7 -104.0 PAT Growth (%) 27.0% 42.5% 24.5% 21.5% Net Chg. in Cash -31.0 7.9 -11.4 0.6 Price Earnings (x) 38.6 27.1 21.7 17.9 Cash at beginning 47.1 16.1 24.0 12.5 ROE (%) 32.9% 34.9% 33.2% 30.9% Cash at end 16.1 24.0 12.5 13.1 ROCE (%) 31.6% 40.5% 36.3% 35.0% Per Share Data FY13A FY14E FY15E FY16E Debt/Equity Ratio (x) 0.4 0.2 0.3 0.2 Adj EPS 8.8 12.5 15.5 18.9 Price/BV (x) 12.7 9.4 7.2 5.5 BV per share 26.7 35.8 46.8 61.1 EV / Sales 4.3 3.5 2.9 2.4 Cash per share 1.0 1.4 0.8 0.9 EV / EBITDA 26.0 18.1 14.9 12.0 Dividend per share 2.5 3.0 3.3 4.0
- 4. 4 | P a g e InitiatingCoverage tiatingCoverage tingCoverage gCoverage Coverage verage rage ge Alembic Pharma Ltd. Q1FY15ResultUpdate–30July2014 Disclaimer: This Document has been prepared by Nirmal Bang Research (A Division of Nirmal Bang Securities PVT LTD). The information, analysis and estimates contained herein are based on Nirmal Bang Research assessment and have been obtained from sources believed to be reliable. This document is meant for the use of the intended recipient only. This document, at best, represents Nirmal Bang Research opinion and is meant for general information only. Nirmal Bang Research, its directors, officers or employees shall not in anyway be responsible for the contents stated herein. Nirmal Bang Research expressly disclaims any and all liabilities that may arise from information, errors or omissions in this connection. This document is not to be considered as an offer to sell or a solicitation to buy any securities. Nirmal Bang Research, its affiliates and their employees may from time to time hold positions in securities referred to herein. Nirmal Bang Research or its affiliates may from time to time solicit from or perform investment banking or other services for any company mentioned in this document. Nirmal Bang Research (Division of Nirmal Bang Securities Pvt Ltd) B-2, 301/302, Marathon Innova, Opp. Peninsula Corporate Park Off. Ganpatrao Kadam Marg Lower Parel(W), Mumbai-400013 Board No : 91 22 3926 8000/8001 Fax : 022 3926 8010