1. Please refer to page 5 for important disclosures and analyst certification, or on our website
www.macquarie.com/research/disclosures.
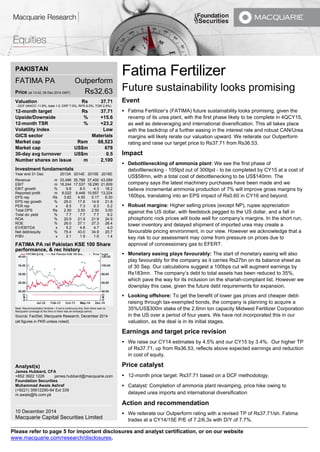
PAKISTAN FATIMA PA Outperform Price (at 13:42, 09 Dec 2014 GMT) Rs32.63 Valuation Rs 37.71 - DCF (WACC 11.8%, beta 1.0, ERP 7.0%, RFR 9.5%, TGR 2.8%) 12-month target Rs 37.71 Upside/Downside % +15.6 12-month TSR % +23.2 Volatility Index Low GICS sector Materials Market cap Rsm 68,523 Market cap US$m 678 30-day avg turnover US$m 0.5 Number shares on issue m 2,100 Investment fundamentals Year end 31 Dec 2013A 2014E 2015E 2016E Revenue m 33,496 35,766 37,400 43,099 EBIT m 16,244 17,537 18,290 21,609 EBIT growth % 9.8 8.0 4.3 18.2 Reported profit m 8,022 9,448 10,857 13,224 EPS rep Rs 3.82 4.50 5.17 6.30 EPS rep growth % 29.0 17.8 14.9 21.8 PER rep x 8.5 7.3 6.3 5.2 Total DPS Rs 2.50 2.50 2.50 3.00 Total div yield % 7.7 7.7 7.7 9.2 ROA % 20.9 21.9 21.9 24.9 ROE % 26.0 27.1 27.3 28.4 EV/EBITDA x 5.2 4.8 4.7 4.0 Net debt/equity % 75.4 43.0 34.9 20.7 P/BV x 2.1 1.9 1.6 1.4 FATIMA PA rel Pakistan KSE 100 Share performance, & rec history Note: Recommendation timeline - if not a continuous line, then there was no Macquarie coverage at the time or there was an embargo period. Source: FactSet, Macquarie Research, December 2014 (all figures in PKR unless noted) Analyst(s) James Hubbard, CFA +852 3922 1226 james.hubbard@macquarie.com Foundation Securities Muhammad Awais Ashraf (+9221) 35612290-94 Ext 339 m.awais@fs.com.pk 10 December 2014 Macquarie Capital Securities Limited
Fatima Fertilizer
Future sustainability looks promising
Event
Fatima Fertilizer’s (FATIMA) future sustainability looks promising, given the revamp of its urea plant, with the first phase likely to be complete in 4QCY15, as well as deleveraging and international diversification. This all takes place with the backdrop of a further easing in the interest rate and robust CAN/Urea margins will likely rerate our valuation upward. We reiterate our Outperform rating and raise our target price to Rs37.71 from Rs36.53.
Impact
Debottlenecking of ammonia plant: We see the first phase of debottlenecking - 105tpd out of 300tpd - to be completed by CY15 at a cost of US$58mn, with a total cost of debottlenecking to be US$140mn. The company says the latest machinery purchases have been made and we believe incremental ammonia production of 7% will improve gross margins by 160bps, translating into an EPS impact of Rs0.60 in CY16 and beyond.
Robust margins: Higher selling prices (except NP), rupee appreciation against the US dollar, with feedstock pegged to the US dollar, and a fall in phosphoric rock prices will bode well for company’s margins. In the short run, lower inventory and delayed shipment of imported urea may create a favourable pricing environment, in our view. However we acknowledge that a key risk to our assessment may come from pressure on prices due to approval of concessionary gas to EFERT.
Monetary easing plays favourably: The start of monetary easing will also play favourably for the company as it carries Rs27bn on its balance sheet as of 30 Sep. Our calculations suggest a 100bps cut will augment earnings by Rs183mn. The company’s debt to total assets has been reduced to 35%, which pave the way for its inclusion on the shariah-compliant list. However we downplay this case, given the future debt requirements for expansion.
Looking offshore: To get the benefit of lower gas prices and cheaper debt- raising through tax-exempted bonds, the company is planning to acquire a 35%/US$300m stake of the 2.6mn ton capacity Midwest Fertilizer Corporation in the US over a period of four years. We have not incorporated this in our valuation, as the deal is in its initial stages.
Earnings and target price revision
We raise our CY14 estimates by 4.5% and our CY15 by 3.4%. Our higher TP of Rs37.71, up from Rs36.53, reflects above expected earnings and reduction in cost of equity.
Price catalyst
12-month price target: Rs37.71 based on a DCF methodology.
Catalyst: Completion of ammonia plant revamping, price hike owing to delayed urea imports and international diversification
Action and recommendation
We reiterate our Outperform rating with a revised TP of Rs37.71/sh. Fatima trades at a CY14/15E P/E of 7.2/6.3x with D/Y of 7.7%.
2. Macquarie Research Fatima Fertilizer
10 December 2014 2
Robust margins
Higher selling prices (except NP), PKR appreciation against the greenback (feedstock pegged to the US dollar) and a reduction in phosphoric rock prices will likely improve the company’s margins. During CY14, margins of CAN/Urea will likely improve by 77/80bps (even after incorporating incremental GIDC of PKR50/mmbtu on fuel stock) driven by higher selling prices (up ~5%YoY) and PKR appreciation (up 3.7% YoY). Despite lower NP prices (down 2% YoY) its margins would improve by 200bps on the back of lower Phosphoric rock prices (down 8.7% YoY). Benefits of Fatima’s diversified product mix are clearly visible in CY14, as the company allocated more ammonia to high-margin CAN and Urea products.
In the short term, lower urea inventory and delayed shipment (likely to arrive late in Dec) may jack up the prices. CAN/NP prices trend upwards in tandem with domestic Urea/DAP prices as seen in the past. Higher demand in coming months given disbursement of PKR5,000/acre subsidy for rice growers, reduction in oil prices and higher support price for wheat (PKR100/40 kg) will further strengthen our case. However, the key downside risk to our thesis may come from concessionary gas availability to EFERT.
3. Macquarie Research Fatima Fertilizer
10 December 2014 3
Macquarie Quant View
The quant model currently holds a marginally positive view on Fatima Fertilizer.
The strongest style exposure is Earnings Momentum, indicating this stock has
received earnings upgrades and is well liked by sell side analysts. The weakest
style exposure is Quality, indicating this stock is likely to have a weaker and less
stable underlying earnings stream.
Displays where the
company’s ranked based on
the fundamental consensus
Price Target and
Macquarie’s Quantitative
Alpha model. The rankings
are displayed relative to the
sector and country.
57/243
Global Alpha Model
Sector Rank
% of BUY recommendations 0% (0/2)
Number of Price Target downgrades 0
Number of Price Target upgrades 1
Macquarie Alpha Model ranking Factors driving the Alpha Model
A list of comparable companies and their Macquarie Alpha model score
(higher is better).
For the comparable firms this chart shows the key underlying styles and their
contribution to the current overall Alpha score.
Macquarie Earnings Sentiment Indicator Drivers of Stock Return
The Macquarie Sentiment Indicator is an enhanced earnings revisions
signal that favours analysts who have more timely and higher conviction
revisions. Current score shown below.
Breakdown of 1 year total return (local currency) into returns from dividends, changes
in forward earnings estimates and the resulting change in earnings multiple.
What drove this Company in the last 5 years How it looks on the Alpha model
Which factor score has had the greatest correlation with the company’s
returns over the last 5 years.
A more granular view of the underlying style scores that drive the alpha (higher is
better) and the percentile rank relative to the sector and country
.
For more details on the Macquarie Alpha model or for more customised analysis and screens, please contact the Macquarie
Global Quantitative/Custom Products Group (cpg@macquarie.com)
Fundamentals
Quant
Rank within Country Rank within Sector
Attractive
-1.6
0.5
1.4
-3.0 -2.0 -1.0 0.0 1.0 2.0 3.0
Engro Corporation
Fatima Fertilizer
Lucky Cement
-100% -80% -60% -40% -20% 0% 20% 40% 60% 80% 100%
Engro Corporation
Fatima Fertilizer
Lucky Cement
Valuations Growth Profitability Earnings
Momentum
Price
Momentum
Quality
-0.3
-0.3
1.3
-3.0 -2.0 -1.0 0.0 1.0 2.0 3.0
Engro Corporation
Fatima Fertilizer
Lucky Cement
-80% -60% -40% -20% 0% 20% 40% 60% 80%
Engro Corporation
Fatima Fertilizer
Lucky Cement
Dividend Return Multiple Return Earnings Outlook 1Yr Total Return
-22%
-20%
-17%
-17%
37%
38%
38%
39%
-40% -20% 0% 20% 40%
⇐ Negatives Positives ⇒
Momentum 3 Month
Profit Margin Last Actual…
Capex to Sales FY0
Turnover(USD) 125 Day
Price to Book LTM
Price to Sales NTM
Dividend Yield NTM
Price to Book FY1
0 1
Technicals & Trading
Risk
Liquidity
Capital & Funding
Quality
Price Momentum
Earnings Momentum
Profitability
Growth
Valuation
Alpha Model Score
-0.15
-0.62
-0.15
0.12
-1.00
0.51
0.61
-0.51
0.14
0.57
0.49
0 1
Normalized
Score
0 50 100
Percentile relative
to sector(/243)
0 50 100
Percentile relative
to country(/5)
4. Macquarie Research Fatima Fertilizer
10 December 2014 4
Fatima Fertilizer (FATIMA PA, Outperform, Target Price: Rs37.71)
Interim Results
1H/14A
2H/14E
1H/15E
2H/15E
Profit & Loss
2013A
2014E
2015E
2016E
Revenue
m
15,607
20,160
14,960
22,440
Revenue
m
33,496
35,766
37,400
43,099
Gross Profit
m
9,500
13,401
9,518
14,276
Gross Profit
m
21,241
22,901
23,794
27,687
Cost of Goods Sold
m
6,107
6,759
5,442
8,164
Cost of Goods Sold
m
12,255
12,865
13,606
15,412
EBITDA
m
7,800
11,230
7,914
11,871
EBITDA
m
17,702
19,030
19,785
23,207
Depreciation
m
738
756
598
897
Depreciation
m
1,458
1,494
1,495
1,598
Amortisation of Goodwill
m
0
0
0
0
Amortisation of Goodwill
m
0
0
0
0
Other Amortisation
m
0
0
0
0
Other Amortisation
m
0
0
0
0
EBIT
m
7,063
10,474
7,316
10,974
EBIT
m
16,244
17,537
18,290
21,609
Net Interest Income
m
-1,838
-1,501
-1,112
-1,668
Net Interest Income
m
-3,923
-3,339
-2,780
-2,163
Associates
m
0
0
0
0
Associates
m
0
0
0
0
Exceptionals
m
0
0
0
0
Exceptionals
m
0
0
0
0
Forex Gains / Losses
m
0
0
0
0
Forex Gains / Losses
m
0
0
0
0
Other Pre-Tax Income
m
0
0
0
0
Other Pre-Tax Income
m
0
0
0
0
Pre-Tax Profit
m
5,224
8,973
6,204
9,306
Pre-Tax Profit
m
12,321
14,198
15,509
19,447
Tax Expense
m
-1,825
-2,925
-1,861
-2,792
Tax Expense
m
-4,298
-4,749
-4,653
-6,223
Net Profit
m
3,400
6,048
4,343
6,514
Net Profit
m
8,022
9,448
10,857
13,224
Minority Interests
m
0
0
0
0
Minority Interests
m
0
0
0
0
Reported Earnings
m
3,400
6,048
4,343
6,514
Reported Earnings
m
8,022
9,448
10,857
13,224
Adjusted Earnings
m
3,400
6,048
4,343
6,514
Adjusted Earnings
m
8,022
9,448
10,857
13,224
EPS (rep)
1.62
2.88
2.07
3.10
EPS (rep)
3.82
4.50
5.17
6.30
EPS (adj)
1.62
2.88
2.07
3.10
EPS (adj)
3.82
4.50
5.17
6.30
EPS Growth yoy (adj)
%
1.1
29.8
27.7
7.7
EPS Growth (adj)
%
29.0
17.8
14.9
21.8
PE (rep)
x
8.5
7.3
6.3
5.2
PE (adj)
x
8.5
7.3
6.3
5.2
EBITDA Margin
%
50.0
55.7
52.9
52.9
Total DPS
2.50
2.50
2.50
3.00
EBIT Margin
%
45.3
52.0
48.9
48.9
Total Div Yield
%
7.7
7.7
7.7
9.2
Earnings Split
%
36.0
64.0
40.0
60.0
Basic Shares Outstanding
m
2,100
2,100
2,100
2,100
Revenue Growth
%
-1.2
13.9
-4.1
11.3
Diluted Shares Outstanding
m
2,100
2,100
2,100
2,100
EBIT Growth
%
-6.6
20.6
3.6
4.8
Profit and Loss Ratios
2013A
2014E
2015E
2016E
Cashflow Analysis
2013A
2014E
2015E
2016E
Revenue Growth
%
13.5
6.8
4.6
15.2
EBITDA
m
17,702
19,030
19,785
23,207
EBITDA Growth
%
9.2
7.5
4.0
17.3
Tax Paid
m
-4,298
-4,749
-4,653
-6,223
EBIT Growth
%
9.8
8.0
4.3
18.2
Chgs in Working Cap
m
673
846
-20
-53
Gross Profit Margin
%
63.4
64.0
63.6
64.2
Net Interest Paid
m
0
0
0
0
EBITDA Margin
%
52.8
53.2
52.9
53.8
Other
m
-274
-145
-2,808
-3,300
EBIT Margin
%
48.5
49.0
48.9
50.1
Operating Cashflow
m
13,802
14,981
12,305
13,631
Net Profit Margin
%
23.9
26.4
29.0
30.7
Acquisitions
m
0
0
0
0
Payout Ratio
%
65.4
55.6
48.4
47.6
Capex
m
-1,509
-2,196
-5,202
-878
EV/EBITDA
x
5.2
4.8
4.7
4.0
Asset Sales
m
0
0
0
0
EV/EBIT
x
5.7
5.3
5.0
4.3
Other
m
-2,999
134
-2
-2
Investing Cashflow
m
-4,508
-2,063
-5,204
-880
Balance Sheet Ratios
Dividend (Ordinary)
m
-5,250
-5,250
-5,250
-6,300
ROE
%
26.0
27.1
27.3
28.4
Equity Raised
m
0
0
0
0
ROA
%
20.9
21.9
21.9
24.9
Debt Movements
m
-2,911
-5,276
-1,175
-6,052
ROIC
%
18.3
20.3
24.2
25.6
Other
m
1,047
5,276
1,175
7,102
Net Debt/Equity
%
75.4
43.0
34.9
20.7
Financing Cashflow
m
-7,114
-5,250
-5,250
-5,250
Interest Cover
x
4.1
5.3
6.6
10.0
Price/Book
x
2.1
1.9
1.6
1.4
Net Chg in Cash/Debt
m
2,180
7,669
1,851
7,501
Book Value per Share
15.6
17.6
20.3
24.1
Free Cashflow
m
12,293
12,785
7,103
12,753
Balance Sheet
2013A
2014E
2015E
2016E
Cash
m
238
2,631
3,307
2,242
Receivables
m
99
143
150
172
Inventories
m
6,552
6,724
7,031
8,103
Investments
m
3,085
85
85
85
Fixed Assets
m
67,588
68,291
71,997
75,296
Intangibles
m
43
43
43
43
Other Assets
m
1,684
3,277
3,279
1,414
Total Assets
m
79,290
81,193
85,891
87,355
Payables
m
6,651
6,438
6,732
7,758
Short Term Debt
m
2,303
2,500
2,500
2,500
Long Term Debt
m
22,647
16,037
15,662
10,187
Provisions
m
0
0
0
0
Other Liabilities
m
14,930
19,261
18,433
16,373
Total Liabilities
m
46,531
44,236
43,327
36,818
Shareholders' Funds
m
30,969
35,167
40,774
48,748
Minority Interests
m
0
0
0
0
Other
m
1,790
1,790
1,790
1,790
Total S/H Equity
m
32,759
36,957
42,564
50,538
Total Liab & S/H Funds
m
79,290
81,193
85,891
87,355
All figures in PKR unless noted.
Source: Company data, Macquarie Research, December 2014
5. Macquarie Research Fatima Fertilizer
10 December 2014 5
Important disclosures: Recommendation definitions Macquarie - Australia/New Zealand Outperform – return >3% in excess of benchmark return Neutral – return within 3% of benchmark return Underperform – return >3% below benchmark return Benchmark return is determined by long term nominal GDP growth plus 12 month forward market dividend yield Macquarie – Asia/Europe Outperform – expected return >+10% Neutral – expected return from -10% to +10% Underperform – expected return <-10% Macquarie First South - South Africa Outperform – expected return >+10% Neutral – expected return from -10% to +10% Underperform – expected return <-10% Macquarie - Canada Outperform – return >5% in excess of benchmark return Neutral – return within 5% of benchmark return Underperform – return >5% below benchmark return Macquarie - USA Outperform (Buy) – return >5% in excess of Russell 3000 index return Neutral (Hold) – return within 5% of Russell 3000 index return Underperform (Sell)– return >5% below Russell 3000 index return Volatility index definition* This is calculated from the volatility of historical price movements. Very high–highest risk – Stock should be expected to move up or down 60–100% in a year – investors should be aware this stock is highly speculative. High – stock should be expected to move up or down at least 40–60% in a year – investors should be aware this stock could be speculative. Medium – stock should be expected to move up or down at least 30–40% in a year. Low–medium – stock should be expected to move up or down at least 25–30% in a year. Low – stock should be expected to move up or down at least 15–25% in a year. * Applicable to Asia/Australian/NZ/Canada stocks only Recommendations – 12 months Note: Quant recommendations may differ from Fundamental Analyst recommendations Financial definitions All "Adjusted" data items have had the following adjustments made: Added back: goodwill amortisation, provision for catastrophe reserves, IFRS derivatives & hedging, IFRS impairments & IFRS interest expense Excluded: non recurring items, asset revals, property revals, appraisal value uplift, preference dividends & minority interests EPS = adjusted net profit / efpowa* ROA = adjusted ebit / average total assets ROA Banks/Insurance = adjusted net profit /average total assets ROE = adjusted net profit / average shareholders funds Gross cashflow = adjusted net profit + depreciation *equivalent fully paid ordinary weighted average number of shares All Reported numbers for Australian/NZ listed stocks are modelled under IFRS (International Financial Reporting Standards). Recommendation proportions – For quarter ending 30 September 2014 AU/NZ Asia RSA USA CA EUR Outperform 48.73% 59.90% 35.63% 42.00% 60.28% 42.11% (for US coverage by MCUSA, 6.09% of stocks followed are investment banking clients) Neutral 33.76% 24.97% 39.08% 52.67% 36.17% 38.42% (for US coverage by MCUSA, 8.12% of stocks followed are investment banking clients) Underperform 17.52% 15.13% 25.29% 5.33% 3.55% 19.47% (for US coverage by MCUSA, 0.51% of stocks followed are investment banking clients)
FATIMA PA vs Pakistan KSE 100 Share, & rec history (all figures in PKR currency unless noted) Note: Recommendation timeline – if not a continuous line, then there was no Macquarie coverage at the time or there was an embargo period. Source: FactSet, Macquarie Research, December 2014 12-month target price methodology FATIMA PA: Rs37.71 based on a DCF methodology
Company-specific disclosures:
Important disclosure information regarding the subject companies covered in this report is available at www.macquarie.com/disclosures.
Date Stock Code (BBG code) Recommendation Target Price
07-May-2014
FATIMA PA
Outperform
Rs36.53
28-Mar-2014
FATIMA PA
Outperform
Rs36.83
26-Feb-2014
FATIMA PA
Outperform
Rs32.42
04-Feb-2013
FATIMA PA
Outperform
Rs32.87
23-Nov-2012
FATIMA PA
Outperform
Rs30.72
08-Mar-2012
FATIMA PA
Outperform
Rs34.30
Target price risk disclosures:
FATIMA PA: Any inability to compete successfully in their markets may harm the business. This could be a result of many factors which may include geographic mix and introduction of improved products or service offerings by competitors. The results of operations may be materially affected by global economic conditions generally, including conditions in financial markets. The company is exposed to market risks, such as changes in interest rates, foreign exchange rates and input prices. From time to time, the company will enter into transactions, including transactions in derivative instruments, to manage certain of these exposures.
Analyst certification:
The views expressed in this research accurately reflect the personal views of the Macquarie analyst(s) and Foundation Securities analyst(s) about the subject securities or issuers and no part of the compensation of the analyst(s) was, is, or will be directly or indirectly related to the inclusion of specific recommendations or views expressed by the analyst(s) in this research. The Macquarie analyst principally responsible for the preparation of this research receives compensation based on overall revenues of Macquarie Group Ltd ABN 94 122 169 279 (AFSLNo. 318062) (MGL) and its related entities (the Macquarie Group) and has taken reasonable care to achieve and maintain independence and objectivity in making any recommendations..
General disclaimers:
Macquarie Securities (Australia) Ltd; Macquarie Capital (Europe) Ltd; Macquarie Capital Markets Canada Ltd; Macquarie Capital Markets North America Ltd; Macquarie Capital (USA) Inc; Macquarie Capital Securities Ltd and its Taiwan branch; Macquarie Capital Securities (Singapore) Pte Ltd; Macquarie Securities (NZ) Ltd; Macquarie First South Securities (Pty) Limited; Macquarie Capital Securities (India) Pvt Ltd; Macquarie Capital Securities