
Recommended
More Related Content
What's hot
What's hot (20)
Similar to PA- I Acid-base titration (HRB)
Similar to PA- I Acid-base titration (HRB) (20)
More from Harshadaa bafna
More from Harshadaa bafna (20)
Recently uploaded
Recently uploaded (20)
PA- I Acid-base titration (HRB)
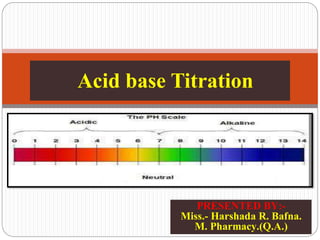
- 1. PRESENTED BY:- Miss.- Harshada R. Bafna. M. Pharmacy.(Q.A.) Acid base Titration
- 2. 2 9/14/2020acid-base titration.(HRB) Theories of acid base indicators classification of acid base titrations and theory involved in titrations of strong, weak, and very weak acids and bases, neutralization curves Contents-
- 3. 9/14/2020acid-base titration.(HRB)3 Acid Any substance which has a sour taste and its aqueous solution turns Blue litmus Red. An acid is a molecule or ion capable of donating hydrogen (proton or hydrogen ion H+). Example: Hydrochloric acid (HCl), Sulphuric acid (H2SO4) etc Base Any Substance which has a bitter taste and its aqueous solution turns Red litmus Blue. Base is Substances produce hydroxide ions (OH−) in aqueous solutions. Example: Sodium Hydroxide (NaOH), Sodium bicarbonate (NaHCO3)
- 4. 9/14/2020acid-base titration.(HRB)4 An acid-base titration is a procedure used in quantitative chemical analysis to determine the concentration of either acid or base. its also known as Neutralization titration Example: 1. HCl + NaOH NaCl + H2O 2. CH3COOH + NaOH CH3COONa + H2O The objective of carry out acid base titration is to determine equivalent quantity of other substance required for neutralization Acid base titration
- 5. 9/14/2020acid-base titration.(HRB)5 Classification of Acid base titration Types of acid- base titration Example 1. Strong acid with strong base HCl and NaOH 2. Strong acid with weak base HCl and NH3 3. Weak acid with strong base CH3COOH and NaOH 4. Weak acid with weak base CH3COOH and NH3
- 6. 9/14/2020 acid-base titration.(HRB) 6 Indicator or Neutralization indicator or Theories of acid base indicators Indicator is a substance which exhibits color change at a particular stage of chemical range. Example: Thymol blue, bromophenol blue, Methyl orange, Bromocresol green, Phenolphthalein etc. These are the substances which exhibits different colors at various values of pH. Indicators are weak acids or weak bases, which have different colors in their conjugate base and acid forms. Most of the indicators are used in dilute solution forms .
- 7. 9/14/2020acid-base titration.(HRB)7 An indicator is a substance which is used to determine the end point in a titration. In acid-base titrations, organic substances (weak acids or weak bases) are generally used as indicators. They change their color within a certain pH range. There are two types of theories of indicator 1. Ostwald theory 2. Quinonoid/ Resonance theory
- 8. 9/14/2020acid-base titration.(HRB)8 1. Ostwald theory The first useful theory of indicator was suggested by W. Ostwald. According to this theory, the color change is due to ionization of the acid-base indicator. The unionized form has different color than the ionized form. The ionization of the indicator is largely affected in acids and bases as it is either a weak acid or a weak base. In case, the indicator is a weak acid, its ionization is very much low in acids due to common H+ ions while it is fairly ionized in alkalies. Similarly if the indicator is a weak base, its ionization is large in acids and low in alkalies due to common OH- ions.
- 9. 9/14/2020acid-base titration.(HRB)9 Considering two important indicators phenolphthalein (a weak acid) and methyl orange (a weak base), Ostwald theory can be illustrated as follows: Phenolphthalein: 1. It can be represented as HPh. 2. It ionizes in solution to a small extent as: HPh ↔ H+ + Ph- Colourless Pink Applying law of mass action, the law of mass action is the proposition that the rate of a chemical reaction is directly proportional to the product of the activities or concentration of the reactants K =[H+] [Ph-] [HpH]
- 10. 9/14/2020acid-base titration.(HRB)10 The undissociated molecules of phenolphthalein are colorless while Ph- ions are pink in colour. In presence of an acid the ionization of HPh is practically negligible as the equilibrium shifts to left hand side due to high concentration of H+ ions. Thus, the solution would remain colorless. On addition of alkali, hydrogen ions are removed by OH- ions in the form of water molecules and the equilibrium shifts to right hand side. Thus, the concentration of Ph- ions increases in solution and they impart pink colour to the solution.
- 11. 9/14/2020acid-base titration.(HRB)11 2. Quinonoid theory The Ostwald theory has been revised and, the color changes are believed to be due to structural changes. According to his theory, the acid-base indicators exist in two tautomeric forms having different structures. Two forms are in equilibrium. One form is termed benzenoid form and the other quinonoid form.
- 12. 9/14/2020acid-base titration.(HRB)12 The two forms have different colors. The color change in due to the inter conversation of one tautomeric form into other. One form mainly exists in acidic medium and the other in alkaline medium Thus, during titration the medium changes from acidic to alkaline or vice-versa. The change in pH converts one tautomeric form into other and thus, the color change occurs . Quinonoid theory can be illustrated as follows: Phenolphthalein: Phenolphthalein has benzenoid form in acidic medium and thus, it is colourless while it has quinonoid form in alkaline medium which has pink colour.
- 13. 9/14/2020acid-base titration.(HRB)13 Mixed indicators - In some cases, the pH range is very narrow and the color change over this range must be very sharp. This is not easily possible with ordinary acid-base indicators. Since the color change extends over the two units of pH. But the required results may be achieved by the use of the suitable mixture of indicators. These are generally selected so that their pK values are close together and the overlapping colors are complementary at an intermediate pH value. Example: 1. A Mixture of phenolphthalein (3parts of 0.1 %) and α-naptholphtalein (1 parts 0.1 %) passes from pale rose to violet at pH 8.9. 2. A mixture of thymol blue (3 parts of a 0.1 % aq. solution the sodium salt) and cresol red (1 parts of a 0.1 % aq. solution of the sodium salt) changes from yellow to violet at pH 8.3.
- 14. 9/14/2020acid-base titration.(HRB)14 Graphical representation of titration curves
- 15. 9/14/202015 References- 1. A Textbook of Pharmaceutical Analysis (volume – I) by DR A V Kasture, DR H N More, DR K R Mahadik, DR S G Wadodkar, Nirali Prakashan, Pg.no. 52-72. 2. A Textbook of Pharmaceutical Analysis by David. G. Watson, Churchill Livingstone, Pg.no. - 51 3. www.google.com.
- 16. 9/14/202016