SlideShare a Scribd company logo
1 of 2
Download to read offline
© 2017 Jones Lang LaSalle IP, Inc. All rights reserved. All information contained herein is from sources deemed reliable; however, no representation or warranty is made to the accuracy thereof.
Q4 2017
Grand Rapids
Office Insight
Grand Rapids’ office market saw healthy growth in the fourth quarter of 2017
as rents continue to increase and vacancies steadily decline. The average
asking rent in the Grand Rapids market is now $17.84 per square foot while
overall vacancy sits at 12.9 percent. New construction has begun and other
projects continue to fill the pipeline. Residential brokerage firms ReMax and
Berkshire Hathaway both announced plans to build offices in the market.
Leasing activity was steady in fourth quarter, with a few deals of note - Service
Express Inc. signed a 40,000-square-foot lease at Bridge Pointe Office Park
and Nolan Transport leased 9,000 square feet at 3040 Charlevoix Drive. Both
deals closed in the Southeast Grand Rapids submarket. A new co-working
space, Blueprint Collective, opened on the West Side at 859 Fulton West.
The Blodgett Building at 15 Ionia SW traded, with the new owner planning a
large-scale renovation to reposition the asset. Warner Tower is under
construction, which will bring 118,000 square feet to the downtown office
market and the Meijer Development on the west side will add 56,000 square
feet of space. The 201 Market development has the potential to add more
Class A space to downtown Grand Rapids, while the Studio C! development
south of Van Andel Arena’s office component is looking for a tenant.
Outlook
Looking ahead into 2018, we can expect conditions to remain steady. Rent
growth may slow as vacancies plateau. After seeing a spike in activity earlier
this year, the west side of downtown will see continued increases in leasing
and sales activity due to it’s “up-and-coming” attractiveness. It will be
interesting to keep an eye on the new construction activity, how much office
space will be included in mixed-use developments and how much speculative
construction will begin to take place. After a strong year, the Grand Rapids
office market is set up nicely for continued growth in the new year.
Fundamentals Forecast
2017 net Absorption -73,719 ▲
Under construction 174,000 s.f. ▲
Total vacancy 12.9% ▼
Average asking rent (gross) $17.84 p.s.f. ▲
Concessions Stable ▶
0
200,000
400,000
2013 2014 2015 2016 2017
Supply and demand (s.f.) Net absorption
Deliveries
Market remains steady with construction on horizon
20.8%
16.5% 15.1% 14.8%
12.9%
2013 2014 2015 2016 2017
Total vacancy
$0.00
$10.00
$20.00
2013 2014 2015 2016 2017
Average asking rents ($/s.f.) Class A
Class B
For more information, contact: Harrison West | harrison.west@am.jll.com
• Rent and vacancy trends continue to improve, as seen throughout 2017
• Building conversions remain common in the CBD, as downtown
vacancies have seen a slight increase and net absorption is negative due
to inventory loss
• Two major developments could provide new Class A space to the
downtown area
© 2017 Jones Lang LaSalle IP, Inc. All rights reserved. All information contained herein is from sources deemed reliable; however, no representation or warranty is made to the accuracy thereof.
Q4 2017
Grand Rapids
Office Statistics
For more information, contact: Harrison West | harrison.west@am.jll.com
Class
Inventory
(s.f.)
Total net
absorption
(s.f)
YTD total net
absorption
(s.f.)
YTD total net
absorption
(% of stock)
Direct
vacancy
(%)
Total
vacancy
(%)
Average
asking rent
($ p.s.f.)
YTD
completions
(s.f.)
Under
construction
(s.f.)
Downtown Totals 5,487,602 -47,704 -62,251 -1.1% 11.7% 12.2% $20.16 35,000 174,000
Northeast Totals 769,744 5,811 -874 -0.1% 10.9% 10.9% $15.86 0 0
Northwest Totals 411,996 0 0 0.0% 0.0% 7.5% $19.95 0 0
Southeast Totals 3,884,259 47,434 -16,152 -0.4% 13.7% 14.6% $15.77 0 0
Southwest Totals 461,442 -1,208 5,558 1.2% 12.8% 13.7% $13.52 0 0
Suburbs Totals 5,527,441 52,037 -11,468 -0.2% 12.2% 13.5% $15.76 35,000 0
Totals Totals 11,015,043 4,333 -73,719 -0.7% 12.0% 12.9% $17.84 35,000 174,000
Downtown A 1,739,199 490 -20,750 -1.2% 15.2% 15.8% $22.63 35,000 174,000
Northeast A 121,746 0 0 0.0% 0.0% 0.0% NA 0 0
Southeast A 574,983 12,199 -26,323 -4.6% 17.2% 17.2% $18.35 0 0
Southwest A 18,800 0 0 0.0% 0.0% 0.0% NA 0 0
Suburbs A 715,529 12,199 -26,323 -3.7% 13.8% 13.8% $18.35 35,000 0
Totals A 2,454,728 12,689 -47,073 -1.9% 0 15.2% $21.50 35,000 174,000
Downtown B 3,748,403 -48,194 -41,501 -1.1% 10.1% 10.5% $18.44 0 0
Northeast B 647,998 5,811 -874 -0.1% 13.0% 13.0% $15.86 0 0
Northwest B 411,996 0 0 0.0% 0.0% 7.5% $19.95 0 0
Southeast B 3,309,276 35,235 10,171 0.3% 13.1% 14.2% $15.22 0 0
Southwest B 442,642 -1,208 5,558 1.3% 13.3% 14.2% $13.52 0 0
Suburbs B 4,811,912 39,838 14,855 0.3% 12.0% 13.5% $15.37 0 0
Totals B 8,560,315 -8,356 -26,646 -0.3% 11.1% 12.2% $16.53 0 0

More Related Content

What's hot

JLL Grand Rapids Office Insight & Statistics - Q2 2019
JLL Grand Rapids Office Insight & Statistics - Q2 2019JLL Grand Rapids Office Insight & Statistics - Q2 2019
JLL Grand Rapids Office Insight & Statistics - Q2 2019Harrison West
 
JLL West Michigan Industrial Insight & Statistics - Q1 2019
JLL West Michigan Industrial Insight & Statistics - Q1 2019JLL West Michigan Industrial Insight & Statistics - Q1 2019
JLL West Michigan Industrial Insight & Statistics - Q1 2019Harrison West
 
JLL West Michigan Industrial Insight & Statistics - Q1 2018
JLL West Michigan Industrial Insight & Statistics - Q1 2018JLL West Michigan Industrial Insight & Statistics - Q1 2018
JLL West Michigan Industrial Insight & Statistics - Q1 2018Harrison West
 
JLL Grand Rapids Office Insight & Statistics - Q3 2017
JLL Grand Rapids Office Insight & Statistics - Q3 2017JLL Grand Rapids Office Insight & Statistics - Q3 2017
JLL Grand Rapids Office Insight & Statistics - Q3 2017Harrison West
 
JLL West Michigan Industrial Insight & Statistics - Q4 2018
JLL West Michigan Industrial Insight & Statistics - Q4 2018JLL West Michigan Industrial Insight & Statistics - Q4 2018
JLL West Michigan Industrial Insight & Statistics - Q4 2018Harrison West
 
JLL Pittsburgh Office Insight & Statistics - Q1 2018
JLL Pittsburgh Office Insight & Statistics - Q1 2018JLL Pittsburgh Office Insight & Statistics - Q1 2018
JLL Pittsburgh Office Insight & Statistics - Q1 2018Tobiah Bilski
 
JLL West Michigan Industrial Insight & Statistics - Q2 2019
JLL West Michigan Industrial Insight & Statistics - Q2 2019JLL West Michigan Industrial Insight & Statistics - Q2 2019
JLL West Michigan Industrial Insight & Statistics - Q2 2019Harrison West
 
JLL Pittsburgh Industrial Insight & Statistics - Q4 2021
JLL Pittsburgh Industrial Insight & Statistics - Q4 2021JLL Pittsburgh Industrial Insight & Statistics - Q4 2021
JLL Pittsburgh Industrial Insight & Statistics - Q4 2021Tobiah Bilski
 
JLL Detroit Industrial Insight & Statistics - Q4 2017
JLL Detroit Industrial Insight & Statistics - Q4 2017JLL Detroit Industrial Insight & Statistics - Q4 2017
JLL Detroit Industrial Insight & Statistics - Q4 2017Harrison West
 
JLL Pittsburgh Industrial Insight & Statistics - Q3 2021
JLL Pittsburgh Industrial Insight & Statistics - Q3 2021JLL Pittsburgh Industrial Insight & Statistics - Q3 2021
JLL Pittsburgh Industrial Insight & Statistics - Q3 2021Tobiah Bilski
 
JLL Grand Rapids Industrial Insight - Fall 2016
JLL Grand Rapids Industrial Insight - Fall 2016JLL Grand Rapids Industrial Insight - Fall 2016
JLL Grand Rapids Industrial Insight - Fall 2016Aaron Moore
 
JLL Detroit Industrial Insight & Statistics - Q1 2019
JLL Detroit Industrial Insight & Statistics - Q1 2019JLL Detroit Industrial Insight & Statistics - Q1 2019
JLL Detroit Industrial Insight & Statistics - Q1 2019Harrison West
 
JLL Pittsburgh Office Insight & Statistics - Q3 2021
JLL Pittsburgh Office Insight & Statistics - Q3 2021JLL Pittsburgh Office Insight & Statistics - Q3 2021
JLL Pittsburgh Office Insight & Statistics - Q3 2021Tobiah Bilski
 
JLL West Michigan Industrial Insight & Statistics - Q1 2020
JLL West Michigan Industrial Insight & Statistics - Q1 2020JLL West Michigan Industrial Insight & Statistics - Q1 2020
JLL West Michigan Industrial Insight & Statistics - Q1 2020Harrison West
 

What's hot (19)

JLL Grand Rapids Office Insight & Statistics - Q2 2019
JLL Grand Rapids Office Insight & Statistics - Q2 2019JLL Grand Rapids Office Insight & Statistics - Q2 2019
JLL Grand Rapids Office Insight & Statistics - Q2 2019
 
JLL West Michigan Industrial Insight & Statistics - Q1 2019
JLL West Michigan Industrial Insight & Statistics - Q1 2019JLL West Michigan Industrial Insight & Statistics - Q1 2019
JLL West Michigan Industrial Insight & Statistics - Q1 2019
 
JLL West Michigan Industrial Insight & Statistics - Q1 2018
JLL West Michigan Industrial Insight & Statistics - Q1 2018JLL West Michigan Industrial Insight & Statistics - Q1 2018
JLL West Michigan Industrial Insight & Statistics - Q1 2018
 
JLL Grand Rapids Office Insight & Statistics - Q3 2017
JLL Grand Rapids Office Insight & Statistics - Q3 2017JLL Grand Rapids Office Insight & Statistics - Q3 2017
JLL Grand Rapids Office Insight & Statistics - Q3 2017
 
JLL West Michigan Industrial Insight & Statistics - Q4 2018
JLL West Michigan Industrial Insight & Statistics - Q4 2018JLL West Michigan Industrial Insight & Statistics - Q4 2018
JLL West Michigan Industrial Insight & Statistics - Q4 2018
 
JLL Pittsburgh Office Insight & Statistics - Q1 2018
JLL Pittsburgh Office Insight & Statistics - Q1 2018JLL Pittsburgh Office Insight & Statistics - Q1 2018
JLL Pittsburgh Office Insight & Statistics - Q1 2018
 
Q1 2018 | Fort Bend | Submarket Snapshot
Q1 2018 | Fort Bend | Submarket SnapshotQ1 2018 | Fort Bend | Submarket Snapshot
Q1 2018 | Fort Bend | Submarket Snapshot
 
Cincinnati office insight q2 2015
Cincinnati office insight   q2 2015Cincinnati office insight   q2 2015
Cincinnati office insight q2 2015
 
Q3 2017 | Austin Industrial | Research & Forecast Report
Q3 2017 | Austin Industrial | Research & Forecast ReportQ3 2017 | Austin Industrial | Research & Forecast Report
Q3 2017 | Austin Industrial | Research & Forecast Report
 
JLL West Michigan Industrial Insight & Statistics - Q2 2019
JLL West Michigan Industrial Insight & Statistics - Q2 2019JLL West Michigan Industrial Insight & Statistics - Q2 2019
JLL West Michigan Industrial Insight & Statistics - Q2 2019
 
JLL Pittsburgh Industrial Insight & Statistics - Q4 2021
JLL Pittsburgh Industrial Insight & Statistics - Q4 2021JLL Pittsburgh Industrial Insight & Statistics - Q4 2021
JLL Pittsburgh Industrial Insight & Statistics - Q4 2021
 
JLL Detroit Industrial Insight & Statistics - Q4 2017
JLL Detroit Industrial Insight & Statistics - Q4 2017JLL Detroit Industrial Insight & Statistics - Q4 2017
JLL Detroit Industrial Insight & Statistics - Q4 2017
 
Q2 2017 Austin Industrial Research & Forecast Report
Q2 2017 Austin Industrial Research & Forecast Report Q2 2017 Austin Industrial Research & Forecast Report
Q2 2017 Austin Industrial Research & Forecast Report
 
JLL Pittsburgh Industrial Insight & Statistics - Q3 2021
JLL Pittsburgh Industrial Insight & Statistics - Q3 2021JLL Pittsburgh Industrial Insight & Statistics - Q3 2021
JLL Pittsburgh Industrial Insight & Statistics - Q3 2021
 
Q4 2017 | Austin Industrial | Research & Forecast Report
Q4 2017 | Austin Industrial | Research & Forecast ReportQ4 2017 | Austin Industrial | Research & Forecast Report
Q4 2017 | Austin Industrial | Research & Forecast Report
 
JLL Grand Rapids Industrial Insight - Fall 2016
JLL Grand Rapids Industrial Insight - Fall 2016JLL Grand Rapids Industrial Insight - Fall 2016
JLL Grand Rapids Industrial Insight - Fall 2016
 
JLL Detroit Industrial Insight & Statistics - Q1 2019
JLL Detroit Industrial Insight & Statistics - Q1 2019JLL Detroit Industrial Insight & Statistics - Q1 2019
JLL Detroit Industrial Insight & Statistics - Q1 2019
 
JLL Pittsburgh Office Insight & Statistics - Q3 2021
JLL Pittsburgh Office Insight & Statistics - Q3 2021JLL Pittsburgh Office Insight & Statistics - Q3 2021
JLL Pittsburgh Office Insight & Statistics - Q3 2021
 
JLL West Michigan Industrial Insight & Statistics - Q1 2020
JLL West Michigan Industrial Insight & Statistics - Q1 2020JLL West Michigan Industrial Insight & Statistics - Q1 2020
JLL West Michigan Industrial Insight & Statistics - Q1 2020
 

Similar to JLL Grand Rapids Office Insight & Statistics - Q4 2017

JLL Grand Rapids Office Insight & Statistics - Q2 2018
JLL Grand Rapids Office Insight & Statistics - Q2 2018JLL Grand Rapids Office Insight & Statistics - Q2 2018
JLL Grand Rapids Office Insight & Statistics - Q2 2018Harrison West
 
JLL Louisville Office Outlook - Q2 2018
JLL Louisville Office Outlook - Q2 2018JLL Louisville Office Outlook - Q2 2018
JLL Louisville Office Outlook - Q2 2018Alex Westcott
 
JLL Grand Rapids Office Insight & Statistics - Q4 2018
JLL Grand Rapids Office Insight & Statistics - Q4 2018JLL Grand Rapids Office Insight & Statistics - Q4 2018
JLL Grand Rapids Office Insight & Statistics - Q4 2018Harrison West
 
JLL Grand Rapids Office Insight & Statistics - Q4 2019
JLL Grand Rapids Office Insight & Statistics - Q4 2019JLL Grand Rapids Office Insight & Statistics - Q4 2019
JLL Grand Rapids Office Insight & Statistics - Q4 2019Harrison West
 
JLL Grand Rapids Office Insight & Statistics - Q1 2019
JLL Grand Rapids Office Insight & Statistics - Q1 2019JLL Grand Rapids Office Insight & Statistics - Q1 2019
JLL Grand Rapids Office Insight & Statistics - Q1 2019Harrison West
 
JLL Cleveland Office Outlook: Q1 2017
JLL Cleveland Office Outlook: Q1 2017JLL Cleveland Office Outlook: Q1 2017
JLL Cleveland Office Outlook: Q1 2017Andrew Batson
 
JLL Grand Rapids Office Insight & Statistics - Q1 2020
JLL Grand Rapids Office Insight & Statistics - Q1 2020JLL Grand Rapids Office Insight & Statistics - Q1 2020
JLL Grand Rapids Office Insight & Statistics - Q1 2020Harrison West
 
Jll memphis industrial review q1 2017
Jll memphis industrial review q1 2017Jll memphis industrial review q1 2017
Jll memphis industrial review q1 2017Hensley Loeb
 
Jll nashville office review q2 2017
Jll nashville office review q2 2017Jll nashville office review q2 2017
Jll nashville office review q2 2017Hensley Loeb
 
JLL West Michigan Industrial Insight & Statistics - Q3 2017
JLL West Michigan Industrial Insight & Statistics - Q3 2017JLL West Michigan Industrial Insight & Statistics - Q3 2017
JLL West Michigan Industrial Insight & Statistics - Q3 2017Harrison West
 
Broward County Office Outlook - Q4 2018
Broward County Office Outlook - Q4 2018Broward County Office Outlook - Q4 2018
Broward County Office Outlook - Q4 2018JLL Florida
 
Jll nashville industrial review q2 2017
Jll nashville industrial review q2 2017Jll nashville industrial review q2 2017
Jll nashville industrial review q2 2017Hensley Loeb
 
JLL Cleveland Office Outlook: Q3 2017
JLL Cleveland Office Outlook: Q3 2017JLL Cleveland Office Outlook: Q3 2017
JLL Cleveland Office Outlook: Q3 2017Andrew Batson
 
JLL West Michigan Industrial Insight & Statistics - Q4 2019
JLL West Michigan Industrial Insight & Statistics - Q4 2019JLL West Michigan Industrial Insight & Statistics - Q4 2019
JLL West Michigan Industrial Insight & Statistics - Q4 2019Harrison West
 
JLL Grand Rapids Office Insight - Fall 2016
JLL Grand Rapids Office Insight - Fall 2016JLL Grand Rapids Office Insight - Fall 2016
JLL Grand Rapids Office Insight - Fall 2016Aaron Moore
 
JLL Cleveland Office Outlook: Q1 2018
JLL Cleveland Office Outlook: Q1 2018JLL Cleveland Office Outlook: Q1 2018
JLL Cleveland Office Outlook: Q1 2018Andrew Batson
 
JLL Cleveland Office Outlook: Q1 2018
JLL Cleveland Office Outlook: Q1 2018JLL Cleveland Office Outlook: Q1 2018
JLL Cleveland Office Outlook: Q1 2018Andrew Batson
 
JLL Cleveland Office Outlook: Q1 2018
JLL Cleveland Office Outlook: Q1 2018JLL Cleveland Office Outlook: Q1 2018
JLL Cleveland Office Outlook: Q1 2018Andrew Batson
 
JLL West Michigan Industrial Insight & Statistics - Q3 2019
JLL West Michigan Industrial Insight & Statistics - Q3 2019JLL West Michigan Industrial Insight & Statistics - Q3 2019
JLL West Michigan Industrial Insight & Statistics - Q3 2019Harrison West
 
JLL Grand Rapids Office Insight & Statistics - Q3 2019
JLL Grand Rapids Office Insight & Statistics - Q3 2019JLL Grand Rapids Office Insight & Statistics - Q3 2019
JLL Grand Rapids Office Insight & Statistics - Q3 2019Harrison West
 

Similar to JLL Grand Rapids Office Insight & Statistics - Q4 2017 (20)

JLL Grand Rapids Office Insight & Statistics - Q2 2018
JLL Grand Rapids Office Insight & Statistics - Q2 2018JLL Grand Rapids Office Insight & Statistics - Q2 2018
JLL Grand Rapids Office Insight & Statistics - Q2 2018
 
JLL Louisville Office Outlook - Q2 2018
JLL Louisville Office Outlook - Q2 2018JLL Louisville Office Outlook - Q2 2018
JLL Louisville Office Outlook - Q2 2018
 
JLL Grand Rapids Office Insight & Statistics - Q4 2018
JLL Grand Rapids Office Insight & Statistics - Q4 2018JLL Grand Rapids Office Insight & Statistics - Q4 2018
JLL Grand Rapids Office Insight & Statistics - Q4 2018
 
JLL Grand Rapids Office Insight & Statistics - Q4 2019
JLL Grand Rapids Office Insight & Statistics - Q4 2019JLL Grand Rapids Office Insight & Statistics - Q4 2019
JLL Grand Rapids Office Insight & Statistics - Q4 2019
 
JLL Grand Rapids Office Insight & Statistics - Q1 2019
JLL Grand Rapids Office Insight & Statistics - Q1 2019JLL Grand Rapids Office Insight & Statistics - Q1 2019
JLL Grand Rapids Office Insight & Statistics - Q1 2019
 
JLL Cleveland Office Outlook: Q1 2017
JLL Cleveland Office Outlook: Q1 2017JLL Cleveland Office Outlook: Q1 2017
JLL Cleveland Office Outlook: Q1 2017
 
JLL Grand Rapids Office Insight & Statistics - Q1 2020
JLL Grand Rapids Office Insight & Statistics - Q1 2020JLL Grand Rapids Office Insight & Statistics - Q1 2020
JLL Grand Rapids Office Insight & Statistics - Q1 2020
 
Jll memphis industrial review q1 2017
Jll memphis industrial review q1 2017Jll memphis industrial review q1 2017
Jll memphis industrial review q1 2017
 
Jll nashville office review q2 2017
Jll nashville office review q2 2017Jll nashville office review q2 2017
Jll nashville office review q2 2017
 
JLL West Michigan Industrial Insight & Statistics - Q3 2017
JLL West Michigan Industrial Insight & Statistics - Q3 2017JLL West Michigan Industrial Insight & Statistics - Q3 2017
JLL West Michigan Industrial Insight & Statistics - Q3 2017
 
Broward County Office Outlook - Q4 2018
Broward County Office Outlook - Q4 2018Broward County Office Outlook - Q4 2018
Broward County Office Outlook - Q4 2018
 
Jll nashville industrial review q2 2017
Jll nashville industrial review q2 2017Jll nashville industrial review q2 2017
Jll nashville industrial review q2 2017
 
JLL Cleveland Office Outlook: Q3 2017
JLL Cleveland Office Outlook: Q3 2017JLL Cleveland Office Outlook: Q3 2017
JLL Cleveland Office Outlook: Q3 2017
 
JLL West Michigan Industrial Insight & Statistics - Q4 2019
JLL West Michigan Industrial Insight & Statistics - Q4 2019JLL West Michigan Industrial Insight & Statistics - Q4 2019
JLL West Michigan Industrial Insight & Statistics - Q4 2019
 
JLL Grand Rapids Office Insight - Fall 2016
JLL Grand Rapids Office Insight - Fall 2016JLL Grand Rapids Office Insight - Fall 2016
JLL Grand Rapids Office Insight - Fall 2016
 
JLL Cleveland Office Outlook: Q1 2018
JLL Cleveland Office Outlook: Q1 2018JLL Cleveland Office Outlook: Q1 2018
JLL Cleveland Office Outlook: Q1 2018
 
JLL Cleveland Office Outlook: Q1 2018
JLL Cleveland Office Outlook: Q1 2018JLL Cleveland Office Outlook: Q1 2018
JLL Cleveland Office Outlook: Q1 2018
 
JLL Cleveland Office Outlook: Q1 2018
JLL Cleveland Office Outlook: Q1 2018JLL Cleveland Office Outlook: Q1 2018
JLL Cleveland Office Outlook: Q1 2018
 
JLL West Michigan Industrial Insight & Statistics - Q3 2019
JLL West Michigan Industrial Insight & Statistics - Q3 2019JLL West Michigan Industrial Insight & Statistics - Q3 2019
JLL West Michigan Industrial Insight & Statistics - Q3 2019
 
JLL Grand Rapids Office Insight & Statistics - Q3 2019
JLL Grand Rapids Office Insight & Statistics - Q3 2019JLL Grand Rapids Office Insight & Statistics - Q3 2019
JLL Grand Rapids Office Insight & Statistics - Q3 2019
 

Recently uploaded

Call Girls in Sarai Kale Khan Delhi 💯Call Us 🔝8264348440🔝
Call Girls in Sarai Kale Khan Delhi 💯Call Us 🔝8264348440🔝Call Girls in Sarai Kale Khan Delhi 💯Call Us 🔝8264348440🔝
Call Girls in Sarai Kale Khan Delhi 💯Call Us 🔝8264348440🔝soniya singh
 
How to Build Multifamily and Laneway Suites in Toronto!! (feat. Expert Archi...
How to Build Multifamily and Laneway Suites  in Toronto!! (feat. Expert Archi...How to Build Multifamily and Laneway Suites  in Toronto!! (feat. Expert Archi...
How to Build Multifamily and Laneway Suites in Toronto!! (feat. Expert Archi...Volition Properties
 
Call Girls in Khan Market 9654467111 ESCORTS SERVICE
Call Girls in Khan Market 9654467111 ESCORTS SERVICECall Girls in Khan Market 9654467111 ESCORTS SERVICE
Call Girls in Khan Market 9654467111 ESCORTS SERVICESapana Sha
 
Purva Palm Hills Devanahalli, Bangalore E- Brochure.pdf
Purva Palm Hills Devanahalli, Bangalore E- Brochure.pdfPurva Palm Hills Devanahalli, Bangalore E- Brochure.pdf
Purva Palm Hills Devanahalli, Bangalore E- Brochure.pdffaheemali990101
 
Namrata 7 Plumeria Drive Pimpri Chinchwad Pune Brochure.pdf
Namrata 7 Plumeria Drive Pimpri Chinchwad Pune Brochure.pdfNamrata 7 Plumeria Drive Pimpri Chinchwad Pune Brochure.pdf
Namrata 7 Plumeria Drive Pimpri Chinchwad Pune Brochure.pdfPrachiRudram
 
9990771857 Call Girls in Noida Sector 11 Noida (Call Girls) Delhi
9990771857 Call Girls in Noida Sector 11 Noida (Call Girls) Delhi9990771857 Call Girls in Noida Sector 11 Noida (Call Girls) Delhi
9990771857 Call Girls in Noida Sector 11 Noida (Call Girls) Delhidelhimodel235
 
83770-87607 ۞Call Girls In Near The Park Hotel (Cp) Delhi
83770-87607 ۞Call Girls In Near The Park Hotel (Cp) Delhi83770-87607 ۞Call Girls In Near The Park Hotel (Cp) Delhi
83770-87607 ۞Call Girls In Near The Park Hotel (Cp) Delhidollysharma2066
 
Call Girls in Inderpuri Delhi 💯Call Us 🔝8264348440🔝
Call Girls in Inderpuri Delhi 💯Call Us 🔝8264348440🔝Call Girls in Inderpuri Delhi 💯Call Us 🔝8264348440🔝
Call Girls in Inderpuri Delhi 💯Call Us 🔝8264348440🔝soniya singh
 
Call Girls in Nehru Place Delhi 💯Call Us 🔝8264348440🔝
Call Girls in Nehru Place Delhi 💯Call Us 🔝8264348440🔝Call Girls in Nehru Place Delhi 💯Call Us 🔝8264348440🔝
Call Girls in Nehru Place Delhi 💯Call Us 🔝8264348440🔝soniya singh
 
Building Dreams: Newman Leech's Visionary Approach to Real Estate Investment
Building Dreams: Newman Leech's Visionary Approach to Real Estate InvestmentBuilding Dreams: Newman Leech's Visionary Approach to Real Estate Investment
Building Dreams: Newman Leech's Visionary Approach to Real Estate InvestmentNewman George Leech
 
Call Girls In Sahibabad Ghaziabad ❤️8860477959 Low Rate Escorts Service In 24...
Call Girls In Sahibabad Ghaziabad ❤️8860477959 Low Rate Escorts Service In 24...Call Girls In Sahibabad Ghaziabad ❤️8860477959 Low Rate Escorts Service In 24...
Call Girls In Sahibabad Ghaziabad ❤️8860477959 Low Rate Escorts Service In 24...lizamodels9
 
Call Girls In Madipur Metro Delhi꧁ +91)8447779280꧂Low Rate 2 short 2000 full ...
Call Girls In Madipur Metro Delhi꧁ +91)8447779280꧂Low Rate 2 short 2000 full ...Call Girls In Madipur Metro Delhi꧁ +91)8447779280꧂Low Rate 2 short 2000 full ...
Call Girls In Madipur Metro Delhi꧁ +91)8447779280꧂Low Rate 2 short 2000 full ...asmaqueen5
 
call girls in Shahdara (DELHI) 🔝 >༒9953330565🔝 genuine Escort Service 🔝✔️✔️
call girls in Shahdara (DELHI) 🔝 >༒9953330565🔝 genuine Escort Service 🔝✔️✔️call girls in Shahdara (DELHI) 🔝 >༒9953330565🔝 genuine Escort Service 🔝✔️✔️
call girls in Shahdara (DELHI) 🔝 >༒9953330565🔝 genuine Escort Service 🔝✔️✔️9953056974 Low Rate Call Girls In Saket, Delhi NCR
 
9990771857 Call Girls in Noida Sector 34 Noida (Call Girls) Delhi
9990771857 Call Girls in Noida Sector 34 Noida (Call Girls) Delhi9990771857 Call Girls in Noida Sector 34 Noida (Call Girls) Delhi
9990771857 Call Girls in Noida Sector 34 Noida (Call Girls) Delhidelhimodel235
 
Call Girls In Vasundhara Ghaziabad ❤️8860477959 Low Rate Escorts Service In 2...
Call Girls In Vasundhara Ghaziabad ❤️8860477959 Low Rate Escorts Service In 2...Call Girls In Vasundhara Ghaziabad ❤️8860477959 Low Rate Escorts Service In 2...
Call Girls In Vasundhara Ghaziabad ❤️8860477959 Low Rate Escorts Service In 2...lizamodels9
 
)_Call Girls In Radisson Blu Plaza Hotel, Delhi Airport ❤️8860477959 _Indepen...
)_Call Girls In Radisson Blu Plaza Hotel, Delhi Airport ❤️8860477959 _Indepen...)_Call Girls In Radisson Blu Plaza Hotel, Delhi Airport ❤️8860477959 _Indepen...
)_Call Girls In Radisson Blu Plaza Hotel, Delhi Airport ❤️8860477959 _Indepen...lizamodels9
 
Low Rate Call Girls in Triveni Complex Delhi Call 9990771857
Low Rate Call Girls in Triveni Complex Delhi Call 9990771857Low Rate Call Girls in Triveni Complex Delhi Call 9990771857
Low Rate Call Girls in Triveni Complex Delhi Call 9990771857delhimodel235
 

Recently uploaded (20)

Call Girls in Sarai Kale Khan Delhi 💯Call Us 🔝8264348440🔝
Call Girls in Sarai Kale Khan Delhi 💯Call Us 🔝8264348440🔝Call Girls in Sarai Kale Khan Delhi 💯Call Us 🔝8264348440🔝
Call Girls in Sarai Kale Khan Delhi 💯Call Us 🔝8264348440🔝
 
How to Build Multifamily and Laneway Suites in Toronto!! (feat. Expert Archi...
How to Build Multifamily and Laneway Suites  in Toronto!! (feat. Expert Archi...How to Build Multifamily and Laneway Suites  in Toronto!! (feat. Expert Archi...
How to Build Multifamily and Laneway Suites in Toronto!! (feat. Expert Archi...
 
Low Rate Call Girls in Triveni Complex Delhi Call 9873940964
Low Rate Call Girls in Triveni Complex Delhi Call 9873940964Low Rate Call Girls in Triveni Complex Delhi Call 9873940964
Low Rate Call Girls in Triveni Complex Delhi Call 9873940964
 
Call Girls in Khan Market 9654467111 ESCORTS SERVICE
Call Girls in Khan Market 9654467111 ESCORTS SERVICECall Girls in Khan Market 9654467111 ESCORTS SERVICE
Call Girls in Khan Market 9654467111 ESCORTS SERVICE
 
Call Girls in Mahavir Nagar whatsaap call US +919953056974
Call Girls in Mahavir Nagar  whatsaap call US  +919953056974Call Girls in Mahavir Nagar  whatsaap call US  +919953056974
Call Girls in Mahavir Nagar whatsaap call US +919953056974
 
Hot call girls in Moti Bagh🔝 9953056974 🔝 escort Service
Hot call girls in Moti Bagh🔝 9953056974 🔝 escort ServiceHot call girls in Moti Bagh🔝 9953056974 🔝 escort Service
Hot call girls in Moti Bagh🔝 9953056974 🔝 escort Service
 
Purva Palm Hills Devanahalli, Bangalore E- Brochure.pdf
Purva Palm Hills Devanahalli, Bangalore E- Brochure.pdfPurva Palm Hills Devanahalli, Bangalore E- Brochure.pdf
Purva Palm Hills Devanahalli, Bangalore E- Brochure.pdf
 
Namrata 7 Plumeria Drive Pimpri Chinchwad Pune Brochure.pdf
Namrata 7 Plumeria Drive Pimpri Chinchwad Pune Brochure.pdfNamrata 7 Plumeria Drive Pimpri Chinchwad Pune Brochure.pdf
Namrata 7 Plumeria Drive Pimpri Chinchwad Pune Brochure.pdf
 
9990771857 Call Girls in Noida Sector 11 Noida (Call Girls) Delhi
9990771857 Call Girls in Noida Sector 11 Noida (Call Girls) Delhi9990771857 Call Girls in Noida Sector 11 Noida (Call Girls) Delhi
9990771857 Call Girls in Noida Sector 11 Noida (Call Girls) Delhi
 
83770-87607 ۞Call Girls In Near The Park Hotel (Cp) Delhi
83770-87607 ۞Call Girls In Near The Park Hotel (Cp) Delhi83770-87607 ۞Call Girls In Near The Park Hotel (Cp) Delhi
83770-87607 ۞Call Girls In Near The Park Hotel (Cp) Delhi
 
Call Girls in Inderpuri Delhi 💯Call Us 🔝8264348440🔝
Call Girls in Inderpuri Delhi 💯Call Us 🔝8264348440🔝Call Girls in Inderpuri Delhi 💯Call Us 🔝8264348440🔝
Call Girls in Inderpuri Delhi 💯Call Us 🔝8264348440🔝
 
Call Girls in Nehru Place Delhi 💯Call Us 🔝8264348440🔝
Call Girls in Nehru Place Delhi 💯Call Us 🔝8264348440🔝Call Girls in Nehru Place Delhi 💯Call Us 🔝8264348440🔝
Call Girls in Nehru Place Delhi 💯Call Us 🔝8264348440🔝
 
Building Dreams: Newman Leech's Visionary Approach to Real Estate Investment
Building Dreams: Newman Leech's Visionary Approach to Real Estate InvestmentBuilding Dreams: Newman Leech's Visionary Approach to Real Estate Investment
Building Dreams: Newman Leech's Visionary Approach to Real Estate Investment
 
Call Girls In Sahibabad Ghaziabad ❤️8860477959 Low Rate Escorts Service In 24...
Call Girls In Sahibabad Ghaziabad ❤️8860477959 Low Rate Escorts Service In 24...Call Girls In Sahibabad Ghaziabad ❤️8860477959 Low Rate Escorts Service In 24...
Call Girls In Sahibabad Ghaziabad ❤️8860477959 Low Rate Escorts Service In 24...
 
Call Girls In Madipur Metro Delhi꧁ +91)8447779280꧂Low Rate 2 short 2000 full ...
Call Girls In Madipur Metro Delhi꧁ +91)8447779280꧂Low Rate 2 short 2000 full ...Call Girls In Madipur Metro Delhi꧁ +91)8447779280꧂Low Rate 2 short 2000 full ...
Call Girls In Madipur Metro Delhi꧁ +91)8447779280꧂Low Rate 2 short 2000 full ...
 
call girls in Shahdara (DELHI) 🔝 >༒9953330565🔝 genuine Escort Service 🔝✔️✔️
call girls in Shahdara (DELHI) 🔝 >༒9953330565🔝 genuine Escort Service 🔝✔️✔️call girls in Shahdara (DELHI) 🔝 >༒9953330565🔝 genuine Escort Service 🔝✔️✔️
call girls in Shahdara (DELHI) 🔝 >༒9953330565🔝 genuine Escort Service 🔝✔️✔️
 
9990771857 Call Girls in Noida Sector 34 Noida (Call Girls) Delhi
9990771857 Call Girls in Noida Sector 34 Noida (Call Girls) Delhi9990771857 Call Girls in Noida Sector 34 Noida (Call Girls) Delhi
9990771857 Call Girls in Noida Sector 34 Noida (Call Girls) Delhi
 
Call Girls In Vasundhara Ghaziabad ❤️8860477959 Low Rate Escorts Service In 2...
Call Girls In Vasundhara Ghaziabad ❤️8860477959 Low Rate Escorts Service In 2...Call Girls In Vasundhara Ghaziabad ❤️8860477959 Low Rate Escorts Service In 2...
Call Girls In Vasundhara Ghaziabad ❤️8860477959 Low Rate Escorts Service In 2...
 
)_Call Girls In Radisson Blu Plaza Hotel, Delhi Airport ❤️8860477959 _Indepen...
)_Call Girls In Radisson Blu Plaza Hotel, Delhi Airport ❤️8860477959 _Indepen...)_Call Girls In Radisson Blu Plaza Hotel, Delhi Airport ❤️8860477959 _Indepen...
)_Call Girls In Radisson Blu Plaza Hotel, Delhi Airport ❤️8860477959 _Indepen...
 
Low Rate Call Girls in Triveni Complex Delhi Call 9990771857
Low Rate Call Girls in Triveni Complex Delhi Call 9990771857Low Rate Call Girls in Triveni Complex Delhi Call 9990771857
Low Rate Call Girls in Triveni Complex Delhi Call 9990771857
 

JLL Grand Rapids Office Insight & Statistics - Q4 2017

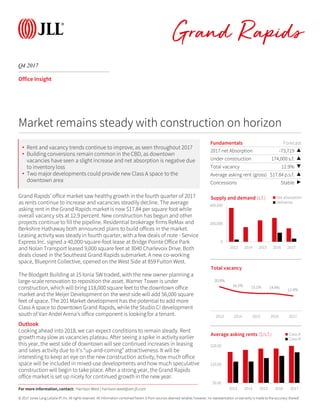
  • 1. © 2017 Jones Lang LaSalle IP, Inc. All rights reserved. All information contained herein is from sources deemed reliable; however, no representation or warranty is made to the accuracy thereof. Q4 2017 Grand Rapids Office Insight Grand Rapids’ office market saw healthy growth in the fourth quarter of 2017 as rents continue to increase and vacancies steadily decline. The average asking rent in the Grand Rapids market is now $17.84 per square foot while overall vacancy sits at 12.9 percent. New construction has begun and other projects continue to fill the pipeline. Residential brokerage firms ReMax and Berkshire Hathaway both announced plans to build offices in the market. Leasing activity was steady in fourth quarter, with a few deals of note - Service Express Inc. signed a 40,000-square-foot lease at Bridge Pointe Office Park and Nolan Transport leased 9,000 square feet at 3040 Charlevoix Drive. Both deals closed in the Southeast Grand Rapids submarket. A new co-working space, Blueprint Collective, opened on the West Side at 859 Fulton West. The Blodgett Building at 15 Ionia SW traded, with the new owner planning a large-scale renovation to reposition the asset. Warner Tower is under construction, which will bring 118,000 square feet to the downtown office market and the Meijer Development on the west side will add 56,000 square feet of space. The 201 Market development has the potential to add more Class A space to downtown Grand Rapids, while the Studio C! development south of Van Andel Arena’s office component is looking for a tenant. Outlook Looking ahead into 2018, we can expect conditions to remain steady. Rent growth may slow as vacancies plateau. After seeing a spike in activity earlier this year, the west side of downtown will see continued increases in leasing and sales activity due to it’s “up-and-coming” attractiveness. It will be interesting to keep an eye on the new construction activity, how much office space will be included in mixed-use developments and how much speculative construction will begin to take place. After a strong year, the Grand Rapids office market is set up nicely for continued growth in the new year. Fundamentals Forecast 2017 net Absorption -73,719 ▲ Under construction 174,000 s.f. ▲ Total vacancy 12.9% ▼ Average asking rent (gross) $17.84 p.s.f. ▲ Concessions Stable ▶ 0 200,000 400,000 2013 2014 2015 2016 2017 Supply and demand (s.f.) Net absorption Deliveries Market remains steady with construction on horizon 20.8% 16.5% 15.1% 14.8% 12.9% 2013 2014 2015 2016 2017 Total vacancy $0.00 $10.00 $20.00 2013 2014 2015 2016 2017 Average asking rents ($/s.f.) Class A Class B For more information, contact: Harrison West | harrison.west@am.jll.com • Rent and vacancy trends continue to improve, as seen throughout 2017 • Building conversions remain common in the CBD, as downtown vacancies have seen a slight increase and net absorption is negative due to inventory loss • Two major developments could provide new Class A space to the downtown area
  • 2. © 2017 Jones Lang LaSalle IP, Inc. All rights reserved. All information contained herein is from sources deemed reliable; however, no representation or warranty is made to the accuracy thereof. Q4 2017 Grand Rapids Office Statistics For more information, contact: Harrison West | harrison.west@am.jll.com Class Inventory (s.f.) Total net absorption (s.f) YTD total net absorption (s.f.) YTD total net absorption (% of stock) Direct vacancy (%) Total vacancy (%) Average asking rent ($ p.s.f.) YTD completions (s.f.) Under construction (s.f.) Downtown Totals 5,487,602 -47,704 -62,251 -1.1% 11.7% 12.2% $20.16 35,000 174,000 Northeast Totals 769,744 5,811 -874 -0.1% 10.9% 10.9% $15.86 0 0 Northwest Totals 411,996 0 0 0.0% 0.0% 7.5% $19.95 0 0 Southeast Totals 3,884,259 47,434 -16,152 -0.4% 13.7% 14.6% $15.77 0 0 Southwest Totals 461,442 -1,208 5,558 1.2% 12.8% 13.7% $13.52 0 0 Suburbs Totals 5,527,441 52,037 -11,468 -0.2% 12.2% 13.5% $15.76 35,000 0 Totals Totals 11,015,043 4,333 -73,719 -0.7% 12.0% 12.9% $17.84 35,000 174,000 Downtown A 1,739,199 490 -20,750 -1.2% 15.2% 15.8% $22.63 35,000 174,000 Northeast A 121,746 0 0 0.0% 0.0% 0.0% NA 0 0 Southeast A 574,983 12,199 -26,323 -4.6% 17.2% 17.2% $18.35 0 0 Southwest A 18,800 0 0 0.0% 0.0% 0.0% NA 0 0 Suburbs A 715,529 12,199 -26,323 -3.7% 13.8% 13.8% $18.35 35,000 0 Totals A 2,454,728 12,689 -47,073 -1.9% 0 15.2% $21.50 35,000 174,000 Downtown B 3,748,403 -48,194 -41,501 -1.1% 10.1% 10.5% $18.44 0 0 Northeast B 647,998 5,811 -874 -0.1% 13.0% 13.0% $15.86 0 0 Northwest B 411,996 0 0 0.0% 0.0% 7.5% $19.95 0 0 Southeast B 3,309,276 35,235 10,171 0.3% 13.1% 14.2% $15.22 0 0 Southwest B 442,642 -1,208 5,558 1.3% 13.3% 14.2% $13.52 0 0 Suburbs B 4,811,912 39,838 14,855 0.3% 12.0% 13.5% $15.37 0 0 Totals B 8,560,315 -8,356 -26,646 -0.3% 11.1% 12.2% $16.53 0 0