SlideShare a Scribd company logo
1 of 2
© 2019 Jones Lang LaSalle IP, Inc. All rights reserved. All information contained herein is from sources deemed reliable; however, no representation or warranty is made to the accuracy thereof.
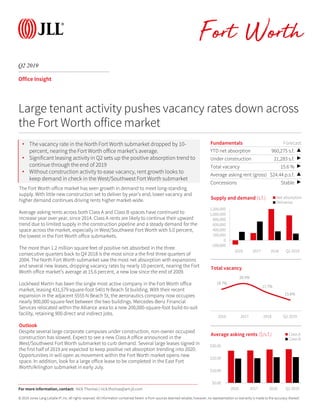
The Fort Worth office market has seen growth in demand to meet long-standing
supply. With little new construction set to deliver by year’s end, lower vacancy and
higher demand continues driving rents higher market-wide.
Average asking rents across both Class A and Class B spaces have continued to
increase year over year, since 2014. Class A rents are likely to continue their upward
trend due to limited supply in the construction pipeline and a steady demand for the
space across the market, especially in West/Southwest Fort Worth with 5.0 percent,
the lowest in the Fort Worth office submarkets.
The more than 1.2 million square feet of positive net absorbed in the three
consecutive quarters back to Q4 2018 is the most since a the first three quarters of
2004. The North Fort Worth submarket saw the most net absorption with expansions
and several new leases, dropping vacancy rates by nearly 10-percent, nearing the Fort
Worth office market’s average at 15.6 percent, a new low since the end of 2009.
Lockheed Martin has been the single most active company in the Fort Worth office
market, leasing 431,579 square-foot 5401 N Beach St building. With their recent
expansion in the adjacent 5555 N Beach St, the aeronautics company now occupies
nearly 900,000 square feet between the two buildings. Mercedes-Benz Financial
Services relocated within the Alliance area to a new 200,000-square-foot build-to-suit
facility, retaining 900 direct and indirect jobs.
Outlook
Despite several large corporate campuses under construction, non-owner occupied
construction has slowed. Expect to see a new Class A office announced in the
West/Southwest Fort Worth submarket to curb demand. Several large leases signed in
the first half of 2019 are expected to keep positive net absorption trending into 2020.
Opportunities in will open as movement within the Fort Worth market opens new
space. In addition, look for a large office lease to be completed in the East Fort
Worth/Arlington submarket in early July.
Q2 2019
Fort Worth
Office Insight
Fundamentals Forecast
YTD net absorption 960,275 s.f. ▲
Under construction 21,283 s.f. ▶
Total vacancy 15.6 % ▶
Average asking rent (gross) $24.44 p.s.f. ▲
Concessions Stable ▶
-200,000
0
200,000
400,000
600,000
800,000
1,000,000
1,200,000
2016 2017 2018 Q2 2019
Supply and demand (s.f.) Net absorption
Deliveries
Large tenant activity pushes vacancy rates down across
the Fort Worth office market
18.7%
20.4%
17.7%
15.6%
2016 2017 2018 Q2 2019
Total vacancy
$0.00
$10.00
$20.00
$30.00
2016 2017 2018 Q2 2019
Average asking rents ($/s.f.) Class A
Class B
For more information, contact: Nick Thomas | nick.thomas@am.jll.com
• The vacancy rate in the North Fort Worth submarket dropped by 10-
percent, nearing the Fort Worth office market’s average.
• Significant leasing activity in Q2 sets up the positive absorption trend to
continue through the end of 2019
• Without construction activity to ease vacancy, rent growth looks to
keep demand in check in the West/Southwest Fort Worth submarket
Fort Worth
Q2 2019
Office Statistics
Building
Count
Inventory
(s.f.)
Total net
absorption
(s.f.)
YTD total net
absorption
(s.f.)
YTD total net
absorption (%
of stock)
Direct vacancy
(%)
Total vacancy
(%)
Average
direct asking
rent ($ p.s.f.)
YTD
Completions
(s.f.)
Under
Development
(s.f.)
Market Totals
Fort Worth CBD 56 9,215,271 55,124 34,455 0.4% 15.3% 15.9% $28.38 0 0
Downtown Fort Worth 56 9,215,271 55,124 34,455 0.4% 15.3% 15.9% $28.38 0 0
Arlington/East Fort Worth 95 6,396,663 69,726 90,901 1.4% 11.1% 11.3% $18.98 0 0
HEB/Haltom City 59 4,510,043 -15,492 103,543 2.3% 14.4% 14.6% $18.03 0 0
North Fort Worth 32 3,794,499 551,105 539,707 14.2% 18.5% 18.5% $22.48 200,000 21,283
West/Southwest Fort Worth 73 5,301,560 56,262 84,053 1.6% 6.2% 7.0% $25.52 27,850 0
Westlake/Southlake 59 4,643,510 28,612 107,616 2.3% 27.9% 29.2% $27.38 30,000 0
Suburban Fort Worth 318 24,646,275 690,213 925,820 3.8% 15.0% 15.5% $23.04 257,850 21,283
Fort Worth 374 33,861,546 745,337 960,275 2.8% 15.1% 15.6% $24.44 257,850 21,283
Class A
Fort Worth CBD 18 5,688,408 40,036 19,289 0.3% 16.6% 16.9% $30.96 0 0
Downtown Fort Worth 18 5,688,408 40,036 19,289 0.3% 16.6% 16.9% $30.96 0 0
Arlington/East Fort Worth 15 2,020,812 9,788 38,238 1.9% 10.4% 11.0% $21.65 0 0
HEB/Haltom City 10 1,402,307 -4,350 773 0.1% 17.1% 17.6% $19.77 0 0
North Fort Worth 8 1,331,531 87,875 97,291 7.3% 31.3% 31.3% $21.82 200,000 21,283
West/Southwest Fort Worth 15 1,883,852 34,151 30,756 1.6% 4.3% 5.0% $28.69 0 0
Westlake/Southlake 15 2,308,411 12,972 98,641 4.3% 43.1% 44.3% $28.14 0 0
Suburban Fort Worth 63 8,946,913 140,436 265,699 3.0% 21.7% 22.4% $25.52 200,000 21,283
Fort Worth 81 14,635,321 180,472 284,988 1.9% 19.7% 20.2% $27.38 200,000 21,283
Class B
Fort Worth CBD 38 3,526,863 15,088 15,166 0.4% 13.2% 14.3% $23.31 0 0
Downtown Fort Worth 38 3,526,863 15,088 15,166 0.4% 13.2% 14.3% $23.31 0 0
Arlington/East Fort Worth 80 4,375,851 59,938 52,663 1.2% 11.4% 11.5% $17.58 0 0
HEB/Haltom City 49 3,107,736 -11,142 102,770 3.3% 13.2% 13.2% $17.32 0 0
North Fort Worth 24 2,462,968 463,230 442,416 18.0% 11.6% 11.6% $23.00 0 0
West/Southwest Fort Worth 58 3,417,708 22,111 53,297 1.6% 7.2% 8.2% $23.81 27,850 0
Westlake/Southlake 44 2,335,099 15,640 8,975 0.4% 13.0% 14.3% $24.67 30,000 0
Suburban Fort Worth 255 15,699,362 549,777 660,121 4.2% 11.1% 11.5% $20.61 57,850 0
Fort Worth 293 19,226,225 564,865 675,287 3.5% 11.5% 12.0% $21.15 57,850 0
Note: Statistical set include Class A and Class B single- and multi-tenant office buildings 20,000 square feet and larger, excluding fully owner-occupied, medical office, and buildings owned by
government entities.
Nick Thomas | Senior Analyst, Research
201 Main Street, Suite 500, Fort Worth, TX 76102 | tel +1 817 334 8128 | nick.thomas@am.jll.com
© 2019 Jones Lang LaSalle IP, Inc. All rights reserved.

More Related Content

What's hot

JLL Detroit Industrial Insight & Statistics - Q2 2017
JLL Detroit Industrial Insight & Statistics - Q2 2017JLL Detroit Industrial Insight & Statistics - Q2 2017
JLL Detroit Industrial Insight & Statistics - Q2 2017Harrison West
 
JLL Pittsburgh Office Insight & Statistics - Q3 2021
JLL Pittsburgh Office Insight & Statistics - Q3 2021JLL Pittsburgh Office Insight & Statistics - Q3 2021
JLL Pittsburgh Office Insight & Statistics - Q3 2021Tobiah Bilski
 
JLL Pittsburgh Office Insight & Statistics - Q2 2021
JLL Pittsburgh Office Insight & Statistics - Q2 2021JLL Pittsburgh Office Insight & Statistics - Q2 2021
JLL Pittsburgh Office Insight & Statistics - Q2 2021Tobiah Bilski
 
JLL Pittsburgh Industrial Insight & Statistics - Q3 2017
JLL Pittsburgh Industrial Insight & Statistics - Q3 2017JLL Pittsburgh Industrial Insight & Statistics - Q3 2017
JLL Pittsburgh Industrial Insight & Statistics - Q3 2017Tobiah Bilski
 
Cushman toronto office leasing market report 2014
Cushman   toronto office leasing market report 2014Cushman   toronto office leasing market report 2014
Cushman toronto office leasing market report 2014Chris Fyvie
 
JLL Cincinnati Industrial Outlook Q4 2020
JLL Cincinnati Industrial Outlook Q4 2020JLL Cincinnati Industrial Outlook Q4 2020
JLL Cincinnati Industrial Outlook Q4 2020Abby Armbruster
 
JLL Cleveland Industrial Outlook: Q3 2019
JLL Cleveland Industrial Outlook: Q3 2019JLL Cleveland Industrial Outlook: Q3 2019
JLL Cleveland Industrial Outlook: Q3 2019Johnathan Miller
 
JLL Pittsburgh Office Outlook - Q4 2015
JLL Pittsburgh Office Outlook - Q4 2015JLL Pittsburgh Office Outlook - Q4 2015
JLL Pittsburgh Office Outlook - Q4 2015Andrew Batson
 
JLL Pittsburgh Industrial Insight & Statistics - Q2 2018
JLL Pittsburgh Industrial Insight & Statistics - Q2 2018JLL Pittsburgh Industrial Insight & Statistics - Q2 2018
JLL Pittsburgh Industrial Insight & Statistics - Q2 2018Tobiah Bilski
 
JLL Pittsburgh Industrial Insight & Statistics - Q2 2020
JLL Pittsburgh Industrial Insight & Statistics - Q2 2020JLL Pittsburgh Industrial Insight & Statistics - Q2 2020
JLL Pittsburgh Industrial Insight & Statistics - Q2 2020Tobiah Bilski
 
Colliers toronto office leasing market report 2014
Colliers toronto office leasing market report 2014Colliers toronto office leasing market report 2014
Colliers toronto office leasing market report 2014Chris Fyvie
 
Cushman & Wakefield's Canadian Office Statistical Summary Q4 2018
Cushman & Wakefield's Canadian Office Statistical Summary Q4 2018Cushman & Wakefield's Canadian Office Statistical Summary Q4 2018
Cushman & Wakefield's Canadian Office Statistical Summary Q4 2018Guy Masse
 
JLL Cincinnati Industrial Outlook - Q3 2016
JLL Cincinnati Industrial Outlook - Q3 2016JLL Cincinnati Industrial Outlook - Q3 2016
JLL Cincinnati Industrial Outlook - Q3 2016Ross Bratcher
 
JLL Detroit Industrial Insight & Statistics - Q2 2016
JLL Detroit Industrial Insight & Statistics - Q2 2016JLL Detroit Industrial Insight & Statistics - Q2 2016
JLL Detroit Industrial Insight & Statistics - Q2 2016Aaron Moore
 
JLL West Michigan Industrial Insight & Statistics - Q1 2020
JLL West Michigan Industrial Insight & Statistics - Q1 2020JLL West Michigan Industrial Insight & Statistics - Q1 2020
JLL West Michigan Industrial Insight & Statistics - Q1 2020Harrison West
 
JLL Cincinnati Industrial Outlook Q3 2020
JLL Cincinnati Industrial Outlook Q3 2020JLL Cincinnati Industrial Outlook Q3 2020
JLL Cincinnati Industrial Outlook Q3 2020Abby Armbruster
 
JLL Pittsburgh Industrial Insight & Statistics - Q2 2021
JLL Pittsburgh Industrial Insight & Statistics - Q2 2021JLL Pittsburgh Industrial Insight & Statistics - Q2 2021
JLL Pittsburgh Industrial Insight & Statistics - Q2 2021Tobiah Bilski
 
JLL Cleveland Industrial Outlook: Q3 2018
JLL Cleveland Industrial Outlook: Q3 2018JLL Cleveland Industrial Outlook: Q3 2018
JLL Cleveland Industrial Outlook: Q3 2018Andrew Batson
 
JLL Cleveland Industrial Outlook Q4 2019
JLL Cleveland Industrial Outlook Q4 2019JLL Cleveland Industrial Outlook Q4 2019
JLL Cleveland Industrial Outlook Q4 2019Johnathan Miller
 
Toronto office market report q3 2014
Toronto office market report q3 2014Toronto office market report q3 2014
Toronto office market report q3 2014Chris Fyvie
 

What's hot (20)

JLL Detroit Industrial Insight & Statistics - Q2 2017
JLL Detroit Industrial Insight & Statistics - Q2 2017JLL Detroit Industrial Insight & Statistics - Q2 2017
JLL Detroit Industrial Insight & Statistics - Q2 2017
 
JLL Pittsburgh Office Insight & Statistics - Q3 2021
JLL Pittsburgh Office Insight & Statistics - Q3 2021JLL Pittsburgh Office Insight & Statistics - Q3 2021
JLL Pittsburgh Office Insight & Statistics - Q3 2021
 
JLL Pittsburgh Office Insight & Statistics - Q2 2021
JLL Pittsburgh Office Insight & Statistics - Q2 2021JLL Pittsburgh Office Insight & Statistics - Q2 2021
JLL Pittsburgh Office Insight & Statistics - Q2 2021
 
JLL Pittsburgh Industrial Insight & Statistics - Q3 2017
JLL Pittsburgh Industrial Insight & Statistics - Q3 2017JLL Pittsburgh Industrial Insight & Statistics - Q3 2017
JLL Pittsburgh Industrial Insight & Statistics - Q3 2017
 
Cushman toronto office leasing market report 2014
Cushman   toronto office leasing market report 2014Cushman   toronto office leasing market report 2014
Cushman toronto office leasing market report 2014
 
JLL Cincinnati Industrial Outlook Q4 2020
JLL Cincinnati Industrial Outlook Q4 2020JLL Cincinnati Industrial Outlook Q4 2020
JLL Cincinnati Industrial Outlook Q4 2020
 
JLL Cleveland Industrial Outlook: Q3 2019
JLL Cleveland Industrial Outlook: Q3 2019JLL Cleveland Industrial Outlook: Q3 2019
JLL Cleveland Industrial Outlook: Q3 2019
 
JLL Pittsburgh Office Outlook - Q4 2015
JLL Pittsburgh Office Outlook - Q4 2015JLL Pittsburgh Office Outlook - Q4 2015
JLL Pittsburgh Office Outlook - Q4 2015
 
JLL Pittsburgh Industrial Insight & Statistics - Q2 2018
JLL Pittsburgh Industrial Insight & Statistics - Q2 2018JLL Pittsburgh Industrial Insight & Statistics - Q2 2018
JLL Pittsburgh Industrial Insight & Statistics - Q2 2018
 
JLL Pittsburgh Industrial Insight & Statistics - Q2 2020
JLL Pittsburgh Industrial Insight & Statistics - Q2 2020JLL Pittsburgh Industrial Insight & Statistics - Q2 2020
JLL Pittsburgh Industrial Insight & Statistics - Q2 2020
 
Colliers toronto office leasing market report 2014
Colliers toronto office leasing market report 2014Colliers toronto office leasing market report 2014
Colliers toronto office leasing market report 2014
 
Cushman & Wakefield's Canadian Office Statistical Summary Q4 2018
Cushman & Wakefield's Canadian Office Statistical Summary Q4 2018Cushman & Wakefield's Canadian Office Statistical Summary Q4 2018
Cushman & Wakefield's Canadian Office Statistical Summary Q4 2018
 
JLL Cincinnati Industrial Outlook - Q3 2016
JLL Cincinnati Industrial Outlook - Q3 2016JLL Cincinnati Industrial Outlook - Q3 2016
JLL Cincinnati Industrial Outlook - Q3 2016
 
JLL Detroit Industrial Insight & Statistics - Q2 2016
JLL Detroit Industrial Insight & Statistics - Q2 2016JLL Detroit Industrial Insight & Statistics - Q2 2016
JLL Detroit Industrial Insight & Statistics - Q2 2016
 
JLL West Michigan Industrial Insight & Statistics - Q1 2020
JLL West Michigan Industrial Insight & Statistics - Q1 2020JLL West Michigan Industrial Insight & Statistics - Q1 2020
JLL West Michigan Industrial Insight & Statistics - Q1 2020
 
JLL Cincinnati Industrial Outlook Q3 2020
JLL Cincinnati Industrial Outlook Q3 2020JLL Cincinnati Industrial Outlook Q3 2020
JLL Cincinnati Industrial Outlook Q3 2020
 
JLL Pittsburgh Industrial Insight & Statistics - Q2 2021
JLL Pittsburgh Industrial Insight & Statistics - Q2 2021JLL Pittsburgh Industrial Insight & Statistics - Q2 2021
JLL Pittsburgh Industrial Insight & Statistics - Q2 2021
 
JLL Cleveland Industrial Outlook: Q3 2018
JLL Cleveland Industrial Outlook: Q3 2018JLL Cleveland Industrial Outlook: Q3 2018
JLL Cleveland Industrial Outlook: Q3 2018
 
JLL Cleveland Industrial Outlook Q4 2019
JLL Cleveland Industrial Outlook Q4 2019JLL Cleveland Industrial Outlook Q4 2019
JLL Cleveland Industrial Outlook Q4 2019
 
Toronto office market report q3 2014
Toronto office market report q3 2014Toronto office market report q3 2014
Toronto office market report q3 2014
 

Similar to Office Insight and Statistics: Fort Worth (2019-Q2)

JLL Pittsburgh Office Insight & Statistics - Q3 2019
 JLL Pittsburgh Office Insight & Statistics - Q3 2019 JLL Pittsburgh Office Insight & Statistics - Q3 2019
JLL Pittsburgh Office Insight & Statistics - Q3 2019Tobiah Bilski
 
JLL Pittsburgh Industrial Insight & Statistics - Q1 2018
JLL Pittsburgh Industrial Insight & Statistics - Q1 2018JLL Pittsburgh Industrial Insight & Statistics - Q1 2018
JLL Pittsburgh Industrial Insight & Statistics - Q1 2018Tobiah Bilski
 
Industrial Insight and Statistics: Dallas-Fort Worth (2019-Q2)
Industrial Insight and Statistics: Dallas-Fort Worth (2019-Q2)Industrial Insight and Statistics: Dallas-Fort Worth (2019-Q2)
Industrial Insight and Statistics: Dallas-Fort Worth (2019-Q2)Nick Thomas
 
JLL Cleveland Industrial Outlook: Q3 2020
JLL Cleveland Industrial Outlook: Q3 2020JLL Cleveland Industrial Outlook: Q3 2020
JLL Cleveland Industrial Outlook: Q3 2020Andrew Batson
 
JLL Cleveland Industrial Outlook: Q4 2018
JLL Cleveland Industrial Outlook: Q4 2018JLL Cleveland Industrial Outlook: Q4 2018
JLL Cleveland Industrial Outlook: Q4 2018Andrew Batson
 
JLL Cleveland Industrial Outlook: Q4 2018
JLL Cleveland Industrial Outlook: Q4 2018JLL Cleveland Industrial Outlook: Q4 2018
JLL Cleveland Industrial Outlook: Q4 2018Andrew Batson
 
JLL Pittsburgh Office Insight & Statistics - Q4 2019
JLL Pittsburgh Office Insight & Statistics - Q4 2019JLL Pittsburgh Office Insight & Statistics - Q4 2019
JLL Pittsburgh Office Insight & Statistics - Q4 2019Tobiah Bilski
 
Colliers St. Louis 1Q20 Industrial Market Snapshot
Colliers St. Louis 1Q20 Industrial Market SnapshotColliers St. Louis 1Q20 Industrial Market Snapshot
Colliers St. Louis 1Q20 Industrial Market SnapshotColliersSTL
 
JLL Pittsburgh Office Insight & Statistics - Q2 2020
JLL Pittsburgh Office Insight & Statistics - Q2 2020JLL Pittsburgh Office Insight & Statistics - Q2 2020
JLL Pittsburgh Office Insight & Statistics - Q2 2020Tobiah Bilski
 
Cushman & Wakefield's Americas Market Beat~ Industrial Philadelphia q32016
Cushman & Wakefield's Americas Market Beat~ Industrial Philadelphia q32016Cushman & Wakefield's Americas Market Beat~ Industrial Philadelphia q32016
Cushman & Wakefield's Americas Market Beat~ Industrial Philadelphia q32016Matthew Marshall
 
JLL Cincinnati Industrial Outlook Q4 2017
JLL Cincinnati Industrial Outlook Q4 2017JLL Cincinnati Industrial Outlook Q4 2017
JLL Cincinnati Industrial Outlook Q4 2017Abby Armbruster
 
JLL Cleveland Industrial Outlook Q3 2019
JLL Cleveland Industrial Outlook   Q3 2019JLL Cleveland Industrial Outlook   Q3 2019
JLL Cleveland Industrial Outlook Q3 2019Johnathan Miller
 
JLL Grand Rapids Office Insight & Statistics - Q3 2018
JLL Grand Rapids Office Insight & Statistics - Q3 2018JLL Grand Rapids Office Insight & Statistics - Q3 2018
JLL Grand Rapids Office Insight & Statistics - Q3 2018Harrison West
 
JLL - Tampa Bay 2018 Q2 Industrial Outlook
JLL - Tampa Bay 2018 Q2 Industrial OutlookJLL - Tampa Bay 2018 Q2 Industrial Outlook
JLL - Tampa Bay 2018 Q2 Industrial OutlookKyle Koller
 
JLL Detroit Office Insight & Statistics - Q4 2018
JLL Detroit Office Insight & Statistics - Q4 2018JLL Detroit Office Insight & Statistics - Q4 2018
JLL Detroit Office Insight & Statistics - Q4 2018Harrison West
 
JLL Detroit Office Insight & Statistics – Q2 2016
JLL Detroit Office Insight & Statistics – Q2 2016JLL Detroit Office Insight & Statistics – Q2 2016
JLL Detroit Office Insight & Statistics – Q2 2016Aaron Moore
 
JLL Cleveland Industrial Outlook: Q1 2019
JLL Cleveland Industrial Outlook: Q1 2019JLL Cleveland Industrial Outlook: Q1 2019
JLL Cleveland Industrial Outlook: Q1 2019Andrew Batson
 
2019 Q4 Industrial St. Louis Report Colliers
2019 Q4 Industrial St. Louis Report Colliers2019 Q4 Industrial St. Louis Report Colliers
2019 Q4 Industrial St. Louis Report ColliersColliersSTL
 
JLL Cleveland Office Outlook: Q4 2020
JLL Cleveland Office Outlook: Q4 2020JLL Cleveland Office Outlook: Q4 2020
JLL Cleveland Office Outlook: Q4 2020Andrew Batson
 
JLL Pittsburgh Office Insight & Statistics - Q2 2019
JLL Pittsburgh Office Insight & Statistics - Q2 2019JLL Pittsburgh Office Insight & Statistics - Q2 2019
JLL Pittsburgh Office Insight & Statistics - Q2 2019Tobiah Bilski
 

Similar to Office Insight and Statistics: Fort Worth (2019-Q2) (20)

JLL Pittsburgh Office Insight & Statistics - Q3 2019
 JLL Pittsburgh Office Insight & Statistics - Q3 2019 JLL Pittsburgh Office Insight & Statistics - Q3 2019
JLL Pittsburgh Office Insight & Statistics - Q3 2019
 
JLL Pittsburgh Industrial Insight & Statistics - Q1 2018
JLL Pittsburgh Industrial Insight & Statistics - Q1 2018JLL Pittsburgh Industrial Insight & Statistics - Q1 2018
JLL Pittsburgh Industrial Insight & Statistics - Q1 2018
 
Industrial Insight and Statistics: Dallas-Fort Worth (2019-Q2)
Industrial Insight and Statistics: Dallas-Fort Worth (2019-Q2)Industrial Insight and Statistics: Dallas-Fort Worth (2019-Q2)
Industrial Insight and Statistics: Dallas-Fort Worth (2019-Q2)
 
JLL Cleveland Industrial Outlook: Q3 2020
JLL Cleveland Industrial Outlook: Q3 2020JLL Cleveland Industrial Outlook: Q3 2020
JLL Cleveland Industrial Outlook: Q3 2020
 
JLL Cleveland Industrial Outlook: Q4 2018
JLL Cleveland Industrial Outlook: Q4 2018JLL Cleveland Industrial Outlook: Q4 2018
JLL Cleveland Industrial Outlook: Q4 2018
 
JLL Cleveland Industrial Outlook: Q4 2018
JLL Cleveland Industrial Outlook: Q4 2018JLL Cleveland Industrial Outlook: Q4 2018
JLL Cleveland Industrial Outlook: Q4 2018
 
JLL Pittsburgh Office Insight & Statistics - Q4 2019
JLL Pittsburgh Office Insight & Statistics - Q4 2019JLL Pittsburgh Office Insight & Statistics - Q4 2019
JLL Pittsburgh Office Insight & Statistics - Q4 2019
 
Colliers St. Louis 1Q20 Industrial Market Snapshot
Colliers St. Louis 1Q20 Industrial Market SnapshotColliers St. Louis 1Q20 Industrial Market Snapshot
Colliers St. Louis 1Q20 Industrial Market Snapshot
 
JLL Pittsburgh Office Insight & Statistics - Q2 2020
JLL Pittsburgh Office Insight & Statistics - Q2 2020JLL Pittsburgh Office Insight & Statistics - Q2 2020
JLL Pittsburgh Office Insight & Statistics - Q2 2020
 
Cushman & Wakefield's Americas Market Beat~ Industrial Philadelphia q32016
Cushman & Wakefield's Americas Market Beat~ Industrial Philadelphia q32016Cushman & Wakefield's Americas Market Beat~ Industrial Philadelphia q32016
Cushman & Wakefield's Americas Market Beat~ Industrial Philadelphia q32016
 
JLL Cincinnati Industrial Outlook Q4 2017
JLL Cincinnati Industrial Outlook Q4 2017JLL Cincinnati Industrial Outlook Q4 2017
JLL Cincinnati Industrial Outlook Q4 2017
 
JLL Cleveland Industrial Outlook Q3 2019
JLL Cleveland Industrial Outlook   Q3 2019JLL Cleveland Industrial Outlook   Q3 2019
JLL Cleveland Industrial Outlook Q3 2019
 
JLL Grand Rapids Office Insight & Statistics - Q3 2018
JLL Grand Rapids Office Insight & Statistics - Q3 2018JLL Grand Rapids Office Insight & Statistics - Q3 2018
JLL Grand Rapids Office Insight & Statistics - Q3 2018
 
JLL - Tampa Bay 2018 Q2 Industrial Outlook
JLL - Tampa Bay 2018 Q2 Industrial OutlookJLL - Tampa Bay 2018 Q2 Industrial Outlook
JLL - Tampa Bay 2018 Q2 Industrial Outlook
 
JLL Detroit Office Insight & Statistics - Q4 2018
JLL Detroit Office Insight & Statistics - Q4 2018JLL Detroit Office Insight & Statistics - Q4 2018
JLL Detroit Office Insight & Statistics - Q4 2018
 
JLL Detroit Office Insight & Statistics – Q2 2016
JLL Detroit Office Insight & Statistics – Q2 2016JLL Detroit Office Insight & Statistics – Q2 2016
JLL Detroit Office Insight & Statistics – Q2 2016
 
JLL Cleveland Industrial Outlook: Q1 2019
JLL Cleveland Industrial Outlook: Q1 2019JLL Cleveland Industrial Outlook: Q1 2019
JLL Cleveland Industrial Outlook: Q1 2019
 
2019 Q4 Industrial St. Louis Report Colliers
2019 Q4 Industrial St. Louis Report Colliers2019 Q4 Industrial St. Louis Report Colliers
2019 Q4 Industrial St. Louis Report Colliers
 
JLL Cleveland Office Outlook: Q4 2020
JLL Cleveland Office Outlook: Q4 2020JLL Cleveland Office Outlook: Q4 2020
JLL Cleveland Office Outlook: Q4 2020
 
JLL Pittsburgh Office Insight & Statistics - Q2 2019
JLL Pittsburgh Office Insight & Statistics - Q2 2019JLL Pittsburgh Office Insight & Statistics - Q2 2019
JLL Pittsburgh Office Insight & Statistics - Q2 2019
 

Recently uploaded

Shapoorji Pallonji Joyville Vista Pune | Spend Your Family Time Together
Shapoorji Pallonji Joyville Vista Pune | Spend Your Family Time TogetherShapoorji Pallonji Joyville Vista Pune | Spend Your Family Time Together
Shapoorji Pallonji Joyville Vista Pune | Spend Your Family Time Togetheraidasheikh47
 
Greater Vancouver Realtors Statistics Package April 2024
Greater Vancouver Realtors Statistics Package April 2024Greater Vancouver Realtors Statistics Package April 2024
Greater Vancouver Realtors Statistics Package April 2024VickyAulakh1
 
Purva Soukhyam in Guduvancheri Chennai.pdf
Purva Soukhyam in Guduvancheri Chennai.pdfPurva Soukhyam in Guduvancheri Chennai.pdf
Purva Soukhyam in Guduvancheri Chennai.pdfpritika141199
 
Call Girls In Vasant Vihar Delhi 💯Call Us 🔝8264348440🔝
Call Girls In Vasant Vihar Delhi 💯Call Us 🔝8264348440🔝Call Girls In Vasant Vihar Delhi 💯Call Us 🔝8264348440🔝
Call Girls In Vasant Vihar Delhi 💯Call Us 🔝8264348440🔝soniya singh
 
Best Deal Virtual Space in Satya The Hive Tata Zudio 750 Sqft 1.89 Cr All inc...
Best Deal Virtual Space in Satya The Hive Tata Zudio 750 Sqft 1.89 Cr All inc...Best Deal Virtual Space in Satya The Hive Tata Zudio 750 Sqft 1.89 Cr All inc...
Best Deal Virtual Space in Satya The Hive Tata Zudio 750 Sqft 1.89 Cr All inc...ApartmentWala1
 
call girls in ganesh nagar Delhi 8264348440 ✅ call girls ❤️
call girls in ganesh nagar Delhi 8264348440 ✅ call girls ❤️call girls in ganesh nagar Delhi 8264348440 ✅ call girls ❤️
call girls in ganesh nagar Delhi 8264348440 ✅ call girls ❤️soniya singh
 
Call girls in new Ashok NagarDelhi꧁ 8447779280꧂ Escort Service Women Seeking ...
Call girls in new Ashok NagarDelhi꧁ 8447779280꧂ Escort Service Women Seeking ...Call girls in new Ashok NagarDelhi꧁ 8447779280꧂ Escort Service Women Seeking ...
Call girls in new Ashok NagarDelhi꧁ 8447779280꧂ Escort Service Women Seeking ...asmaqueen5
 
Call Girls in shastri nagar Delhi 8264348440 ✅ call girls ❤️
Call Girls in shastri nagar Delhi 8264348440 ✅ call girls ❤️Call Girls in shastri nagar Delhi 8264348440 ✅ call girls ❤️
Call Girls in shastri nagar Delhi 8264348440 ✅ call girls ❤️soniya singh
 
Call Girls in Noida Sector 13 Noida 💯Call Us 🔝 9582086666 🔝 South Delhi Escor...
Call Girls in Noida Sector 13 Noida 💯Call Us 🔝 9582086666 🔝 South Delhi Escor...Call Girls in Noida Sector 13 Noida 💯Call Us 🔝 9582086666 🔝 South Delhi Escor...
Call Girls in Noida Sector 13 Noida 💯Call Us 🔝 9582086666 🔝 South Delhi Escor...delhimodel235
 
9990771857 Call Girls in Dwarka Sector 137 Noida (Call Girls) Delhi
9990771857 Call Girls in Dwarka Sector 137 Noida (Call Girls) Delhi9990771857 Call Girls in Dwarka Sector 137 Noida (Call Girls) Delhi
9990771857 Call Girls in Dwarka Sector 137 Noida (Call Girls) Delhidelhimodel235
 
Premium Villa Projects in Sarjapur Road Bengaluru
Premium Villa Projects in Sarjapur Road BengaluruPremium Villa Projects in Sarjapur Road Bengaluru
Premium Villa Projects in Sarjapur Road BengaluruShivaSeo3
 
TENANT SCREENING REPORT SERVICES​ How Tenant Screening Reports Work
TENANT SCREENING REPORT SERVICES​ How Tenant Screening Reports WorkTENANT SCREENING REPORT SERVICES​ How Tenant Screening Reports Work
TENANT SCREENING REPORT SERVICES​ How Tenant Screening Reports WorkTurbo Tenant
 
Call Girls in Noida Sector 11 Noida 💯Call Us 🔝 9582086666 🔝 South Delhi Escor...
Call Girls in Noida Sector 11 Noida 💯Call Us 🔝 9582086666 🔝 South Delhi Escor...Call Girls in Noida Sector 11 Noida 💯Call Us 🔝 9582086666 🔝 South Delhi Escor...
Call Girls in Noida Sector 11 Noida 💯Call Us 🔝 9582086666 🔝 South Delhi Escor...delhimodel235
 
Call Girls In Chand Nagar (Delhi)+918447779280 Welcome To Vip Women Seeking M...
Call Girls In Chand Nagar (Delhi)+918447779280 Welcome To Vip Women Seeking M...Call Girls In Chand Nagar (Delhi)+918447779280 Welcome To Vip Women Seeking M...
Call Girls In Chand Nagar (Delhi)+918447779280 Welcome To Vip Women Seeking M...asmaqueen5
 
Kolte Patil Kharadi Pune E Brochure.pdf
Kolte Patil Kharadi Pune E  Brochure.pdfKolte Patil Kharadi Pune E  Brochure.pdf
Kolte Patil Kharadi Pune E Brochure.pdfabbu831446
 
9990771857 Call Girls in Dwarka Sector 1 Delhi (Call Girls) Delhi
9990771857 Call Girls in Dwarka Sector 1 Delhi (Call Girls) Delhi9990771857 Call Girls in Dwarka Sector 1 Delhi (Call Girls) Delhi
9990771857 Call Girls in Dwarka Sector 1 Delhi (Call Girls) Delhidelhimodel235
 
Magarpatta Nova Elegance Mundhwa Pune E-Brochure.pdf
Magarpatta Nova Elegance Mundhwa Pune  E-Brochure.pdfMagarpatta Nova Elegance Mundhwa Pune  E-Brochure.pdf
Magarpatta Nova Elegance Mundhwa Pune E-Brochure.pdfManishSaxena95
 
Low Rate ↬Call Girls in Trilokpuri Delhi ↫8447779280}Escorts Service In Delhi
Low Rate ↬Call Girls in Trilokpuri Delhi ↫8447779280}Escorts Service In DelhiLow Rate ↬Call Girls in Trilokpuri Delhi ↫8447779280}Escorts Service In Delhi
Low Rate ↬Call Girls in Trilokpuri Delhi ↫8447779280}Escorts Service In Delhiasmaqueen5
 
Mahindra Happinest Tathawade Pune Brochure.pdf
Mahindra Happinest Tathawade Pune Brochure.pdfMahindra Happinest Tathawade Pune Brochure.pdf
Mahindra Happinest Tathawade Pune Brochure.pdfBabyrudram
 
Call Girls In Laxmi Nagar Delhi +91-8447779280! !Best Woman Seeking Man Escor...
Call Girls In Laxmi Nagar Delhi +91-8447779280! !Best Woman Seeking Man Escor...Call Girls In Laxmi Nagar Delhi +91-8447779280! !Best Woman Seeking Man Escor...
Call Girls In Laxmi Nagar Delhi +91-8447779280! !Best Woman Seeking Man Escor...asmaqueen5
 

Recently uploaded (20)

Shapoorji Pallonji Joyville Vista Pune | Spend Your Family Time Together
Shapoorji Pallonji Joyville Vista Pune | Spend Your Family Time TogetherShapoorji Pallonji Joyville Vista Pune | Spend Your Family Time Together
Shapoorji Pallonji Joyville Vista Pune | Spend Your Family Time Together
 
Greater Vancouver Realtors Statistics Package April 2024
Greater Vancouver Realtors Statistics Package April 2024Greater Vancouver Realtors Statistics Package April 2024
Greater Vancouver Realtors Statistics Package April 2024
 
Purva Soukhyam in Guduvancheri Chennai.pdf
Purva Soukhyam in Guduvancheri Chennai.pdfPurva Soukhyam in Guduvancheri Chennai.pdf
Purva Soukhyam in Guduvancheri Chennai.pdf
 
Call Girls In Vasant Vihar Delhi 💯Call Us 🔝8264348440🔝
Call Girls In Vasant Vihar Delhi 💯Call Us 🔝8264348440🔝Call Girls In Vasant Vihar Delhi 💯Call Us 🔝8264348440🔝
Call Girls In Vasant Vihar Delhi 💯Call Us 🔝8264348440🔝
 
Best Deal Virtual Space in Satya The Hive Tata Zudio 750 Sqft 1.89 Cr All inc...
Best Deal Virtual Space in Satya The Hive Tata Zudio 750 Sqft 1.89 Cr All inc...Best Deal Virtual Space in Satya The Hive Tata Zudio 750 Sqft 1.89 Cr All inc...
Best Deal Virtual Space in Satya The Hive Tata Zudio 750 Sqft 1.89 Cr All inc...
 
call girls in ganesh nagar Delhi 8264348440 ✅ call girls ❤️
call girls in ganesh nagar Delhi 8264348440 ✅ call girls ❤️call girls in ganesh nagar Delhi 8264348440 ✅ call girls ❤️
call girls in ganesh nagar Delhi 8264348440 ✅ call girls ❤️
 
Call girls in new Ashok NagarDelhi꧁ 8447779280꧂ Escort Service Women Seeking ...
Call girls in new Ashok NagarDelhi꧁ 8447779280꧂ Escort Service Women Seeking ...Call girls in new Ashok NagarDelhi꧁ 8447779280꧂ Escort Service Women Seeking ...
Call girls in new Ashok NagarDelhi꧁ 8447779280꧂ Escort Service Women Seeking ...
 
Call Girls in shastri nagar Delhi 8264348440 ✅ call girls ❤️
Call Girls in shastri nagar Delhi 8264348440 ✅ call girls ❤️Call Girls in shastri nagar Delhi 8264348440 ✅ call girls ❤️
Call Girls in shastri nagar Delhi 8264348440 ✅ call girls ❤️
 
Call Girls in Noida Sector 13 Noida 💯Call Us 🔝 9582086666 🔝 South Delhi Escor...
Call Girls in Noida Sector 13 Noida 💯Call Us 🔝 9582086666 🔝 South Delhi Escor...Call Girls in Noida Sector 13 Noida 💯Call Us 🔝 9582086666 🔝 South Delhi Escor...
Call Girls in Noida Sector 13 Noida 💯Call Us 🔝 9582086666 🔝 South Delhi Escor...
 
9990771857 Call Girls in Dwarka Sector 137 Noida (Call Girls) Delhi
9990771857 Call Girls in Dwarka Sector 137 Noida (Call Girls) Delhi9990771857 Call Girls in Dwarka Sector 137 Noida (Call Girls) Delhi
9990771857 Call Girls in Dwarka Sector 137 Noida (Call Girls) Delhi
 
Premium Villa Projects in Sarjapur Road Bengaluru
Premium Villa Projects in Sarjapur Road BengaluruPremium Villa Projects in Sarjapur Road Bengaluru
Premium Villa Projects in Sarjapur Road Bengaluru
 
TENANT SCREENING REPORT SERVICES​ How Tenant Screening Reports Work
TENANT SCREENING REPORT SERVICES​ How Tenant Screening Reports WorkTENANT SCREENING REPORT SERVICES​ How Tenant Screening Reports Work
TENANT SCREENING REPORT SERVICES​ How Tenant Screening Reports Work
 
Call Girls in Noida Sector 11 Noida 💯Call Us 🔝 9582086666 🔝 South Delhi Escor...
Call Girls in Noida Sector 11 Noida 💯Call Us 🔝 9582086666 🔝 South Delhi Escor...Call Girls in Noida Sector 11 Noida 💯Call Us 🔝 9582086666 🔝 South Delhi Escor...
Call Girls in Noida Sector 11 Noida 💯Call Us 🔝 9582086666 🔝 South Delhi Escor...
 
Call Girls In Chand Nagar (Delhi)+918447779280 Welcome To Vip Women Seeking M...
Call Girls In Chand Nagar (Delhi)+918447779280 Welcome To Vip Women Seeking M...Call Girls In Chand Nagar (Delhi)+918447779280 Welcome To Vip Women Seeking M...
Call Girls In Chand Nagar (Delhi)+918447779280 Welcome To Vip Women Seeking M...
 
Kolte Patil Kharadi Pune E Brochure.pdf
Kolte Patil Kharadi Pune E  Brochure.pdfKolte Patil Kharadi Pune E  Brochure.pdf
Kolte Patil Kharadi Pune E Brochure.pdf
 
9990771857 Call Girls in Dwarka Sector 1 Delhi (Call Girls) Delhi
9990771857 Call Girls in Dwarka Sector 1 Delhi (Call Girls) Delhi9990771857 Call Girls in Dwarka Sector 1 Delhi (Call Girls) Delhi
9990771857 Call Girls in Dwarka Sector 1 Delhi (Call Girls) Delhi
 
Magarpatta Nova Elegance Mundhwa Pune E-Brochure.pdf
Magarpatta Nova Elegance Mundhwa Pune  E-Brochure.pdfMagarpatta Nova Elegance Mundhwa Pune  E-Brochure.pdf
Magarpatta Nova Elegance Mundhwa Pune E-Brochure.pdf
 
Low Rate ↬Call Girls in Trilokpuri Delhi ↫8447779280}Escorts Service In Delhi
Low Rate ↬Call Girls in Trilokpuri Delhi ↫8447779280}Escorts Service In DelhiLow Rate ↬Call Girls in Trilokpuri Delhi ↫8447779280}Escorts Service In Delhi
Low Rate ↬Call Girls in Trilokpuri Delhi ↫8447779280}Escorts Service In Delhi
 
Mahindra Happinest Tathawade Pune Brochure.pdf
Mahindra Happinest Tathawade Pune Brochure.pdfMahindra Happinest Tathawade Pune Brochure.pdf
Mahindra Happinest Tathawade Pune Brochure.pdf
 
Call Girls In Laxmi Nagar Delhi +91-8447779280! !Best Woman Seeking Man Escor...
Call Girls In Laxmi Nagar Delhi +91-8447779280! !Best Woman Seeking Man Escor...Call Girls In Laxmi Nagar Delhi +91-8447779280! !Best Woman Seeking Man Escor...
Call Girls In Laxmi Nagar Delhi +91-8447779280! !Best Woman Seeking Man Escor...
 

Office Insight and Statistics: Fort Worth (2019-Q2)

  • 1. © 2019 Jones Lang LaSalle IP, Inc. All rights reserved. All information contained herein is from sources deemed reliable; however, no representation or warranty is made to the accuracy thereof. The Fort Worth office market has seen growth in demand to meet long-standing supply. With little new construction set to deliver by year’s end, lower vacancy and higher demand continues driving rents higher market-wide. Average asking rents across both Class A and Class B spaces have continued to increase year over year, since 2014. Class A rents are likely to continue their upward trend due to limited supply in the construction pipeline and a steady demand for the space across the market, especially in West/Southwest Fort Worth with 5.0 percent, the lowest in the Fort Worth office submarkets. The more than 1.2 million square feet of positive net absorbed in the three consecutive quarters back to Q4 2018 is the most since a the first three quarters of 2004. The North Fort Worth submarket saw the most net absorption with expansions and several new leases, dropping vacancy rates by nearly 10-percent, nearing the Fort Worth office market’s average at 15.6 percent, a new low since the end of 2009. Lockheed Martin has been the single most active company in the Fort Worth office market, leasing 431,579 square-foot 5401 N Beach St building. With their recent expansion in the adjacent 5555 N Beach St, the aeronautics company now occupies nearly 900,000 square feet between the two buildings. Mercedes-Benz Financial Services relocated within the Alliance area to a new 200,000-square-foot build-to-suit facility, retaining 900 direct and indirect jobs. Outlook Despite several large corporate campuses under construction, non-owner occupied construction has slowed. Expect to see a new Class A office announced in the West/Southwest Fort Worth submarket to curb demand. Several large leases signed in the first half of 2019 are expected to keep positive net absorption trending into 2020. Opportunities in will open as movement within the Fort Worth market opens new space. In addition, look for a large office lease to be completed in the East Fort Worth/Arlington submarket in early July. Q2 2019 Fort Worth Office Insight Fundamentals Forecast YTD net absorption 960,275 s.f. ▲ Under construction 21,283 s.f. ▶ Total vacancy 15.6 % ▶ Average asking rent (gross) $24.44 p.s.f. ▲ Concessions Stable ▶ -200,000 0 200,000 400,000 600,000 800,000 1,000,000 1,200,000 2016 2017 2018 Q2 2019 Supply and demand (s.f.) Net absorption Deliveries Large tenant activity pushes vacancy rates down across the Fort Worth office market 18.7% 20.4% 17.7% 15.6% 2016 2017 2018 Q2 2019 Total vacancy $0.00 $10.00 $20.00 $30.00 2016 2017 2018 Q2 2019 Average asking rents ($/s.f.) Class A Class B For more information, contact: Nick Thomas | nick.thomas@am.jll.com • The vacancy rate in the North Fort Worth submarket dropped by 10- percent, nearing the Fort Worth office market’s average. • Significant leasing activity in Q2 sets up the positive absorption trend to continue through the end of 2019 • Without construction activity to ease vacancy, rent growth looks to keep demand in check in the West/Southwest Fort Worth submarket
  • 2. Fort Worth Q2 2019 Office Statistics Building Count Inventory (s.f.) Total net absorption (s.f.) YTD total net absorption (s.f.) YTD total net absorption (% of stock) Direct vacancy (%) Total vacancy (%) Average direct asking rent ($ p.s.f.) YTD Completions (s.f.) Under Development (s.f.) Market Totals Fort Worth CBD 56 9,215,271 55,124 34,455 0.4% 15.3% 15.9% $28.38 0 0 Downtown Fort Worth 56 9,215,271 55,124 34,455 0.4% 15.3% 15.9% $28.38 0 0 Arlington/East Fort Worth 95 6,396,663 69,726 90,901 1.4% 11.1% 11.3% $18.98 0 0 HEB/Haltom City 59 4,510,043 -15,492 103,543 2.3% 14.4% 14.6% $18.03 0 0 North Fort Worth 32 3,794,499 551,105 539,707 14.2% 18.5% 18.5% $22.48 200,000 21,283 West/Southwest Fort Worth 73 5,301,560 56,262 84,053 1.6% 6.2% 7.0% $25.52 27,850 0 Westlake/Southlake 59 4,643,510 28,612 107,616 2.3% 27.9% 29.2% $27.38 30,000 0 Suburban Fort Worth 318 24,646,275 690,213 925,820 3.8% 15.0% 15.5% $23.04 257,850 21,283 Fort Worth 374 33,861,546 745,337 960,275 2.8% 15.1% 15.6% $24.44 257,850 21,283 Class A Fort Worth CBD 18 5,688,408 40,036 19,289 0.3% 16.6% 16.9% $30.96 0 0 Downtown Fort Worth 18 5,688,408 40,036 19,289 0.3% 16.6% 16.9% $30.96 0 0 Arlington/East Fort Worth 15 2,020,812 9,788 38,238 1.9% 10.4% 11.0% $21.65 0 0 HEB/Haltom City 10 1,402,307 -4,350 773 0.1% 17.1% 17.6% $19.77 0 0 North Fort Worth 8 1,331,531 87,875 97,291 7.3% 31.3% 31.3% $21.82 200,000 21,283 West/Southwest Fort Worth 15 1,883,852 34,151 30,756 1.6% 4.3% 5.0% $28.69 0 0 Westlake/Southlake 15 2,308,411 12,972 98,641 4.3% 43.1% 44.3% $28.14 0 0 Suburban Fort Worth 63 8,946,913 140,436 265,699 3.0% 21.7% 22.4% $25.52 200,000 21,283 Fort Worth 81 14,635,321 180,472 284,988 1.9% 19.7% 20.2% $27.38 200,000 21,283 Class B Fort Worth CBD 38 3,526,863 15,088 15,166 0.4% 13.2% 14.3% $23.31 0 0 Downtown Fort Worth 38 3,526,863 15,088 15,166 0.4% 13.2% 14.3% $23.31 0 0 Arlington/East Fort Worth 80 4,375,851 59,938 52,663 1.2% 11.4% 11.5% $17.58 0 0 HEB/Haltom City 49 3,107,736 -11,142 102,770 3.3% 13.2% 13.2% $17.32 0 0 North Fort Worth 24 2,462,968 463,230 442,416 18.0% 11.6% 11.6% $23.00 0 0 West/Southwest Fort Worth 58 3,417,708 22,111 53,297 1.6% 7.2% 8.2% $23.81 27,850 0 Westlake/Southlake 44 2,335,099 15,640 8,975 0.4% 13.0% 14.3% $24.67 30,000 0 Suburban Fort Worth 255 15,699,362 549,777 660,121 4.2% 11.1% 11.5% $20.61 57,850 0 Fort Worth 293 19,226,225 564,865 675,287 3.5% 11.5% 12.0% $21.15 57,850 0 Note: Statistical set include Class A and Class B single- and multi-tenant office buildings 20,000 square feet and larger, excluding fully owner-occupied, medical office, and buildings owned by government entities. Nick Thomas | Senior Analyst, Research 201 Main Street, Suite 500, Fort Worth, TX 76102 | tel +1 817 334 8128 | nick.thomas@am.jll.com © 2019 Jones Lang LaSalle IP, Inc. All rights reserved.