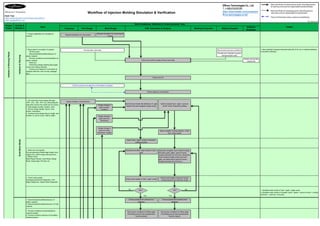
Workflow of Injection Molding Simulation and Verification

Technology of injection molding simulation has been advancing for decades. Nowadays, almost all of the companies in industry have applied this technology more or less, in-house or outsourcing, to reduce risk of having poor part design or mold design which makes the planned mass production get nowhere; and to save development cost and time caused by iterative process of trial and error. More and more companies have considered the work of injection molding simulation as an important DFM (Design for Manufacturing) element in their standard process chain of product and project development which involves plastic part. For more insights of this workflow, link https://www.linkedin.com/pulse/workflow-injection-molding-simulation-verification-hank-tsai/ .

Recommended
Recommended
More Related Content
What's hot
What's hot (17)
Similar to Workflow of Injection Molding Simulation and Verification
Similar to Workflow of Injection Molding Simulation and Verification (20)
Recently uploaded
Recently uploaded (20)
Workflow of Injection Molding Simulation and Verification
- 1. V0: xxxx.xx.xx Customer 1. Project registration for simulation & analysis. BuildMeshModel 1. 3D model file of part design (file type: .PRT, .STL, .IGS, .STP, etc.) Recording the date when receive the model and its version. 2. Gate design (number, location, size) 3. Runner design (length, layout, cross section, dimension) 4. Cooling chnnel design (layout, length, size, location vs. part & runner, inlet & outlet) Design change in part thickness Build 3D part model with attribution of gate location and size assigned (single cavity) Build complete "part + gate + sprue & runner" mesh model (full cavities) 1. Mesh size and density: Per part geometry:Global edge length (mm), height (mm), IGES merge tolerance(mm). 2. Refine mesh: Mesh Repair Wizard, Insert Node, Merge Node, Swap Edge, Fill Hole, etc. 1. Qualified mesh model of "part + gate", single cavity. 2. Qualified mesh model of complete "parts + gates + sprue & runner + cooling channels + mold box", full-cavity. 1. Name/Grade/Brand/Manufacturer of plastic material. 2. Name/Grade/Brand/Manufacturer of mold material. Choose plastic/mold material from database 1. Check mesh quality: Overlapping Elements Diagnositc, Free Edges Diagnositc, Aspect Ratio Diagnositc. Check mesh quality of "part + gate" model Check mesh quality of sprue & runner, cooling channel and mold box model Choose plastic/mold material from database 1. Process conditions recommended by material supplier. 2. Process condition interface of simulation software/system: Set process conditions for filling stage (Test filling time for fast /medium/slow injection speed) Set process conditions for filling stage (Test filling time for fast /medium/slow injection speed) Generate and refine mesh model of "part + gate" Generate complete mesh model including full-cavity parts, gates, sprue & runner, cooling channels and mold box. (Duplicate mesh model of single cavity's part and gate, and refine that of sprue & runner, cooling channels and mold box.) Design change in gate (number, location) Design change in gate (size and dimension) Design change in sprue & runner (dimension, length) Build complete "cooling channel + mold box" mesh model Import "part + gate" model to simulation software/system Workflow of Injection Molding Simulation & Verification Recommend process conditions 1. New material's property characterization file (if it's not in material database of simultion software). Provide new material's property characterization data Collect and confirm quality of basic input data Create and provide material file Initiation&PlanningPhase Initiation&Planning Request simulation for new project Request simulation for improving old project 1. Basic data for simulation & analysis - 3D file of part - Name/Grade/Brand/Manufacturer of plastic material - Process conditions recommendation for plastic material - Mold size - Preliminary design drawing about gate, runner and cooling channels - Purpose and objective of simulation & analysis (weld line, sink, air trap, warpage, etc.) Provide basic input data Project kick off Confirm purpose and objective of simulation & analysis Define objective of simulation Input Activity & Milestone Work Breakdown, Workflow & Cross-functional Team Output Part Design Mold Design CAE, Simulation & Analysis Molding Production Material Supplier Software Developer Project Phase Start and finish of individual key work, directing (arrow) to next key work and its responsible functional team. Start and finish of supporting work, directing (dot) to next work and its responsible functional team. Flow of information share, review and feedback. OK? Yes No OK? Yes No Hank Tsai https://www.linkedin.com/in/hank-tsai-effinno/ hank.tsai@effinno.com Effinno Technologies Co., Ltd. T: (+886)435095395 https://www.linkedin.com/company/e ffinno-technologies-co-ltd/
- 2. 1. Theoretical number of molding cycle to start stable injection molding (after which cooling environment is stable) 1. Theoretical cooling time for part solidification. 1. Distribution of mold surface temperature (moving half, stationary half and temperature difference) Recommend process conditions of filling stage 1. Recommended process conditions by material supplier: - Melt temperature - Mold temperature 2. Capacity of injection molding machine: - Screw size - Maximum injection pressure - Maximum injection speed 3. Obtained filling time by preliminary filling analysis 4. V-P switch volume and screw stroke 5. Process conditions (injection speed, injection pressure) Set process conditions of filling stage as injection molding machine interface. - Define sensor node at each gate Confirm machine capacity and process conditions of filling stage TransientCollingAnalysis 1. Cooling chnnel design (layout, length, size, location vs. part & runner, inlet & outlet) 2. Mold size (LxWxH) 3. Process conditions: - Coolant inlets & outlets - Total length of cooling line from coolant exit of mold temperature controller to its entrance. - Pressure drop between coolant exit and entrance of mold temperature controller. - Size (diameter) of cooling channel - Flow rate calculation of coolant - Initial mold temperature - Melt temperature - Cooling time - Cycle time 4. Ejection temperature of part Confirm pump's pressure capacity of mold temperature controller./ Length, diameter of external cooling hoses./ Coolant inlet and outlet assignment.Implement transient cooling analysis 1. Confirmation of part design feasibility 2. Confirmation of mold design feasibility Check, under stable cooling, surface temperature distribution of part @ ejection: - Highest temperature - Surface temperature distribution of moving half (surface temperature vs. area) - Surface temperature distribution of stationary half (surface temperature vs. area) - Distribution of surface temperature difference between moving and stationary halves 1. Cycle time in project quotation (Cooling time = cycle time - filling time - packing & holding time - mold open & close time) 2. Confirmation of part design feasibility Provide material's HDT data and information about its test. Design change in cooling channels (layout, length, size, location vs. part & runner, inlet & outlet) Obtain number of molding cycle to start stable injection molding (related to the set ejection temperature) 1. Confirmation of part design feasibility 2. Confirmation of mold design feasibility 3. Confirmation of process conditions feasibility Obtain cooling time needed to make part solidified (part temperature under the set ejection temperature) 1. Melt front advancement during filling stage 2. Distribution of part's average volumetric temperature @ end of filling - Short shot risk evaluation (average volumetric temperature vs. stop-flow temperature of material) 3. Distribution of melt front temperature 4. Distribution of cavity pressure @ end of filling 5. Pressure curve @ gate (single cavity model) and machine nozzle (full cavity model) 6. Clamping force curve 7. Locations of weld lines 8. Locations of air traps 9. Distribution of cooling time Check melt filling pattern within part cavity: - Balance in melt filling? - Hesitation? - Weld line? - Air trap? Check melt filling balance cavity-to-cavity Implement single-cavity model's preliminary filling analysis Implement full-cavitiy model's preliminary filling analysis PreliminaryFillingAnalysis - Melt temperature - Mold temperature - Filling time OK? YesNo OK? No Yes OK? No OK? No Yes Yes
- 3. 1. Melt front advancement during filling stage (indivudal cavity & full cavities) 2. Distribution of average volumetric temperature @ end of filling (individual cavity and full cavities) - Evaluate risk of short shot (average volumetric temperature vs. stop-flow temperature of material) 3. Distribution of melt front temperature 4. Distribution of pressure @ end of filling (individual cavity and full cavities) 5. Maximum filling pressure @ machine nozzle - Evaluate risk of short shot (maximum filling pressure vs. set value of injection pressure vs. machine capacity) 6. Pressure curve @ machine nozzle 7. Curve of clamping force 8. Pressure curve @ gate 9. Locations of weld lines 10. Locations of air traps 11. Distribution of cooling time (part + sprue & runner) 1. Process conditions for packing & holding stage (pressure and time) 1. Confirmation of mold design feasibility 2. Confirmation of process conditions feasibility 1. Distribution of average volumetric temperature (individual cavity and full cavities) @ end of packing @ holding stage 2. Distribution of pressure (individual cavity and full cavities) @ end of packing @ holding stage 3. Distribution of density (individual cavity and full cavities) @ end of packing @ holding stage 4. Distribution of volumetric shrinkage (individual cavity and full cavities) @ end of packing @ holding stage 5. Distribution of sink index (individual cavity and full cavities) @ end of packing @ holding stage 6. Distribution of frozen layer (individual cavity and full cavities) @ end of packing @ holding stage 7. Distribution of average volumetric temperature higher than ejection temperature (individual cavity and full cavities) @ end of packing @ holding stage 8. Pressure curve @ machine nozzle during packing & holding stage 9. Curve of clamping force during packing & holding stage 10. Pressure curve @ each gate 11. Pressure curve @ end-filling location of each cavity 12. Solidification time of each gate 13. Curves of shot weight & part weight ExecutionPhase s 1. Process conditions: - Coolant inlets & outlets assignment on mold - Total length of cooling line from coolant exit of mold temperature controller to its entrance. - Pressure drop between coolant exit and entrance of mold temperature controller. - Size (diameter) of cooling channel - Flow rate calculation of coolant - mold temperature - Melt temperature - Cooling time - Ejection time + Mold open & close time - Cycle time 2. Ejection temperature of part Set process conditions of cooling stage as injection molding machine interface. - Define sensor node at each gate - Define sensor node at end-filling location of each cavity - Define sensor node at the thickest location of each cavity - Define sensor node at the thickest location of full model including sprue and runner (ex. bottom of tapered sprue) Confirm pump's pressure capacity of mold temperature controller./ Length, diameter of external cooling hoses./ Coolant inlet and outlet assignment. Recommend process conditions of cooling stage Implement cooling analysis Recommend process conditions of packing & holding stage Implement packing & holding analysis Check quality of packing & holding effect: - Effective pressure reaches gate and end- filling location - Packing time - Holding time for gate solidification. - Pressure distribution within cavity Implement static filling analysis FillingAnalysis 1. Confirmation of part design feasibility 2. Confirmation of mold design feasibility 3. Confirmation of process conditions feasibility Packing&HoldingAnalysis Set process conditions of packing & holding stage as injection molding machine interface. - Define sensor node at each gate - Define sensor node at end-filling location of each cavity Confirm machine capacity and process conditions of packing & holding stage Check quality of melt filling: - Melt filling balance intra-cavity (within cavity) - Melt filling balance inter-cavity (cavity to cavity) - Hesitation - Weld lines - Air traps - Predicted maximum pressure vs. machine capacity - Temperature change of melt OK? No Yes OK? No Yes
- 4. 1. Confirmation of process conditions feasibility 1. Cooling time 2. Cycle time 3. Distribution of average volumetric temperature @ end of cooling (individual cavity and full cavities) 4. Distribution of density @ end of cooling (individual cavity and full cavities) 5. Temperature curves @ gate, end-filling location, thickest location of part and thickest location of full model 6. Distribution of part surface temperature @ end of cooling stage (individual cavity and full cavities) - Surface temperature of moving half - Surface temperature of stationary half - Surface temperature difference between moving and stationary halves 7. Distribution of mold box temperature (cross sections) @ end of cooling stage 8. Efficiency of cooling channels 9. Temperature rise of coolant 1. Confirmation of part design feasibility 2. Confirmation of mold design feasibility 3. Confirmation of process conditions feasibility 1. Displacement, dimension and shrinkage rate @ X direction 2. Displacement, dimension and shrinkage rate @ Y direction 3. Displacement, dimension and shrinkage rate @ Z direction 4. Value of co-planarity and warpage/ Deformed curve illustration made by sensor node values 5. Contributors to warpage (total displacement): thermal effect, fiber effect, PVT effect 6. Critical part dimensions 7. Differences among cavity to cavity. 1. Project simulation analysis report & presentation 2. Approval @ part design, mold design and process condition design 1. Mold design drawing 2. Project simulation analysis report Confirm the latest version's mold desig and its real fabricated status Check simulation model's compliance with the latest version's mold design drawing - Runner & gate design (gate lication on part/ gate number/ gate type/ gate dimension/ runner layout/ runner cross section/ runner diameter) - Orientation of part in cavity - Cooling channel design (mold box size LxWxH/ location of "part + sprue & runner" in mold box/ cooling channel layout/ distance between cooling channel and part/ distance between heater bar and part/ diameter of cooling channel/ inlets & outlets assignment on mold) SimulationReporting& DesignApproval Confirm product design and feedback Confirm mold design and feedback Confirm process conditions and feedback Generate written simulation analysis report & reporting ration 1. 2D part design drawing (latest version) 2. 3D part design model (latest version) 3. Project simulation analysis report Confirm 2D drawing and 3D model of the latest version's part design Check simulation model's compliance with 2D drawing & 3D model of the latest version's part design - Length x Width x Height - Nominal thickness - Maximum thickness - Minimum thickness WarpageAnalysis Set conditions for warpage analysis: - Glass fiber effect (turn on) - In-mold constraint effect (turn on) - At each cavity, define sensor nodes on surface where specifies co-planarity Provide property data about glass-fiber-enhanced material (elastic modulus, poisson ratio, etc.) Create and provide material file Implement warpage analysis Check quality of warpage effect - Co-planarity (amount of warpage) - Contributors of warpage * Thermal effect * Fiber effect * PVT effect CoolingAnalys Check quality of cooling effect: - Cooling time - Distribution of surface temperature of part @ ejection (end of cooling stage) * Highest temperature * Surface temperature distribution of moving half (surface temperature vs. area) * Surface temperature distribution of stationary half (surface temperature vs. area) * Distribution of surface temperature difference between moving and stationary halve OK? No Yes OK? No Yes PVTeffect PVTeffect Thermaleffect Fibereffect
- 5. 1. Specification of part warpage ultComparison Compare results of packing & holding stage (actual vs. simulation) - Maximum packing & holding pressure @ machine nozzle - Pressure curve @ machine nozzle - Packing time - Holding time - Shot weight & individual part weights - Clamping force 1. Final injection molding conditions record for mass production 2. Final samples (5 shots) 3. Real data of filling stage: 3-1. 20%, 40%, 60%, 80%, 90% filled samples and photos 3-2. filling time on machine 3-3. maximum injection pressure on machine @ machine nozzle 3-4. pressure curve on machine @ machine nozzle 3-5. weld line locations and photos 3-6. air trap locations and photos 4. Real data of packing & holding stage: 4-1. maximum injection pressure on machine @ machine nozzle 4-2. pressure curve on machine @ machine nozzle 4-3. packing time on machine 4-4. holding time on machine 4-5. shot weight and individual part weights 4-6. clamping force 5. Real data of cooling stage: 5-1. Coolant flow rate @ exit & entrance on mold temperature controller 5-2. cooling time (= theoretical holding time set on machine + cooling time set on machine, not including theoretical packing time set on machine) 5-3. Cycle time on machine 5-4. Temperature measured on mold surface: moving half/ stationary half/ difference between moving and stationary halves 6. Measured value of co-planarity and warpage 7. Sink mark locations and photos 8. Measured value of part length, width and height; and shrinkage rates at the three directions 1. Injection molding process conditions record 2. Project simulation analysis report Check intented process conditions Filling stage: - melt temperature - injection speed - injection pressure - machine capacity (temperature/ injection speed/ injection pressure) Packing & holding stage: - packing & holding pressure - packing & holding time - machine capacity (packing & holding pressure) Cooling stage: - mold temperature - cooling time - mold open & close time - cycle time - inlets & outlets assignment on mold - pump pressure capacity of mold temperature controller Confirm process conditions/ machine capacity/ mold temperature controller capacity Compare results of filling stage (actual vs. simulation) - Short shot status - Filling time - Maximum injection pressure @ machine nozzle - Pressure curve @ machine nozzle - Clamping force - Weld line locations - Air trap locations 1. Material filling pattern comparison: short shot samples vs. melt front advancement 2. Filling time comparison: value on machine vs. value in simulation 3. Maximum injection pressure @ machine nozzle comparison: value on machine vs. value in simulation 4. Pressure curve @ machine nozzle comparison: curve on machine vs. curve in simulation 5. Clamping force comparison: value on machine vs. value in simulation 6. Weld line location comparison: sample vs. simulation 7. Air trap location comparison: sample vs. simulation 1. Maximum packing & holding pressure @ machine nozzle comparison: value on machine vs. value in simulation 2. Pressure curve @ machine nozzle comparison: curve on machine vs. curve in simulation 3. Packing time comparison: value on machine vs. value in simulation 4. Holding time comparison: value on machine vs. value in simulation 5. Shot weight & individual part weights comparison: value measured vs. value in simulation 6. Clamping force comparison: value on machine vs. value in simulation 1. Compliance check list of part design, mold design and fabricated status, and machine capacity (with simulation model and intended process conditions). VerificationPhase Pre-molding-trialPreparMoldingTrial 1. Process conditions in simulation analysis report 2. Procedure of scientific injection molding condition set up Trial (Process conditions for simulation analysis) Trial (Scientific injection molding condition set up) Check quality of molded part - Short shot/ sink mark/ warpage OK? No Yes No OK? No Yes
- 6. 1. Project simulation verification report & presentation 1. Simulation database ClosingPhase BuildDatabase Build database of simulation - Predict co-planarity & warpage - Predict shrinkage rate - Predict molded dimension 1. Relationship between actual co-planarity & warpage vs. output value in simulation 2. Relationship between actual shrinkage rate vs. value in simulation 3. Relationship between molded dimension vs. value in simulation (Data collected: plastic material/ part thickness (nominal, thickest, thinnest)/ material's maximum flow length/ part weight, length, width, height/ datum length for warpage measurement/ datum area for co-planarity measurement/ perpendicular or parallel to material flow direction/ cavity number/ maximum pressure during filling stage (actual value on machine vs. value in simulation)/ cavity pressure distribution @ end of filling stage (simulation)/ maximum pressure during packing & holding stage (actual value on machine vs. value in simulation)/ cavity pressure distribution @ end of packing & holding stage (simulation)/ surface temperature difference between mold's moving and stationary halves @ end of cooling stage (actual value vs. value in simulation)/ direction of material flow/ percentages of contributors to warpage (thermal effect, fiber effect and PVT effect)(simulation)/ cavity pressure distribution @ end of cooling stage (simulation)/ part volumetric shrinkage distribution @ end of cooling stage (simulation)/ part density distribution @ end of cooling stage (simulation)/ etc.] ClosingMoldingResultvs.SimulationRes Compare results of cooling stage (actual vs. simulation) - Coolant flow rate & Reynold number - Cooling time - Cycle time - Part surface temperature of moving half, stationary half and its difference between the two halves Compare results of warpage stage (actual vs. simulation) - Sink mark location - Co-planarity & warpage - Shrinkage rate @ length, width and height directions For each cavity part: 1. Sink mark location comparison: sample vs. simulation 2. Co-planarity and warpage comparison: value measured vs. value in simulation 3. Shrinkage rate comparison @ length, width, height directions: value measured vs. value in simulation 4. Critical part dimension comparison: value measured vs. value in simulation CompleteVerification& Reporting Generate written simulation verification report & reporting 1. Coolant flow rate & Reynold number comparison: value measured or claculated vs. value in simulation 2. Cooling time comparison: value on machine (= holding time set on machine + cooling time set on machine, not including packing time set on machine) vs. value in simulation 3. Cycle time comparison: value on machine vs. value in simulation 4. Surface temperature comparison of mold's moving half: value measured vs. value in simulation 5. Surface temperature comparison of mold's stationary half: value measured vs. value in simulation 6. Comparison of surface temperature difference between mold's moving/stationary halves: value measured and calculated vs. value in simulation 1. Comparison list of actual molded result and simulation analysis (Note: Judgement "Ok or not" here refers to satisfaction of the completeness of comparison work, not about satisfaction of the accuracy of simulation result whose related effort should be made before molding trial.) OK? No Yes Close