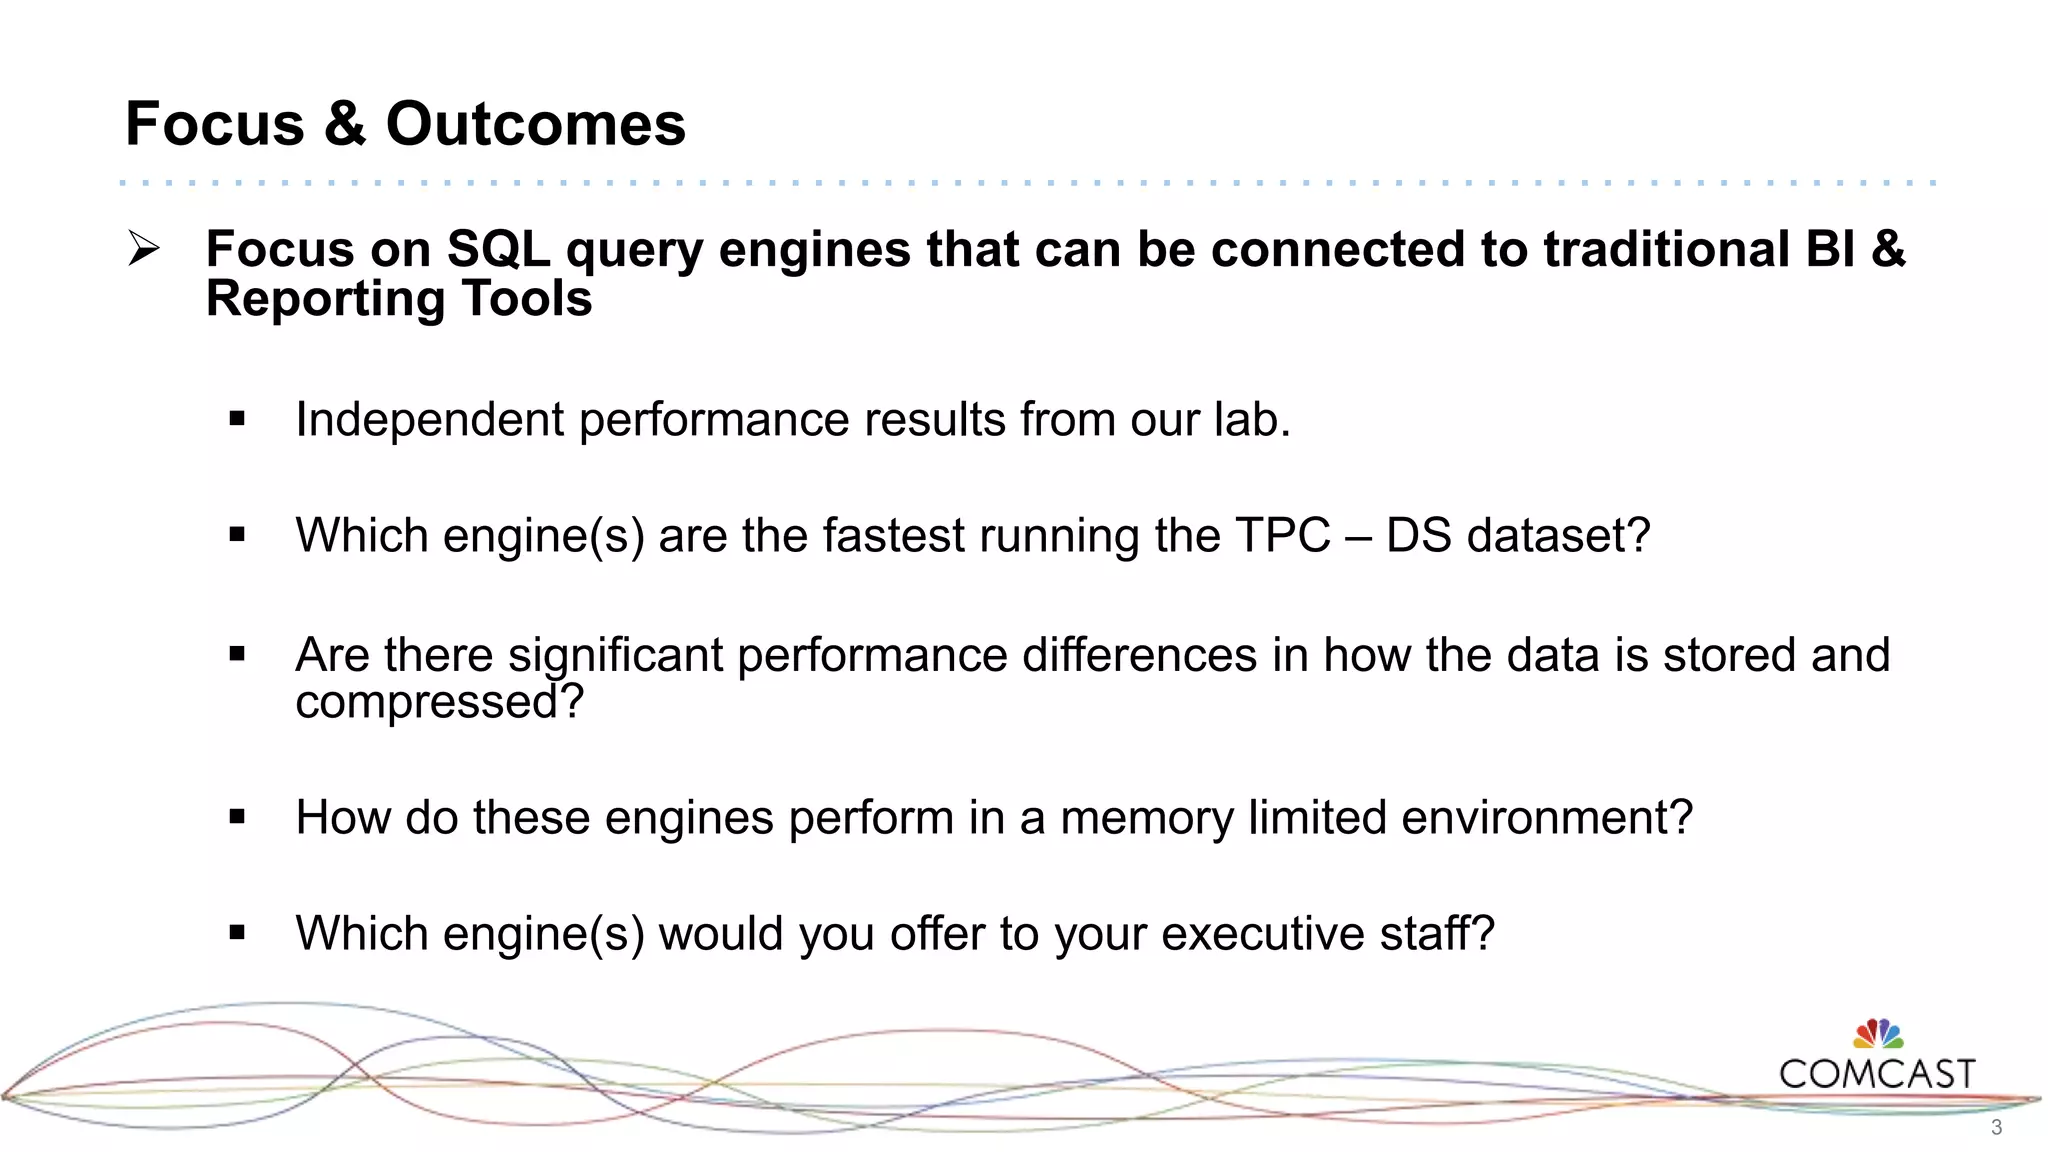
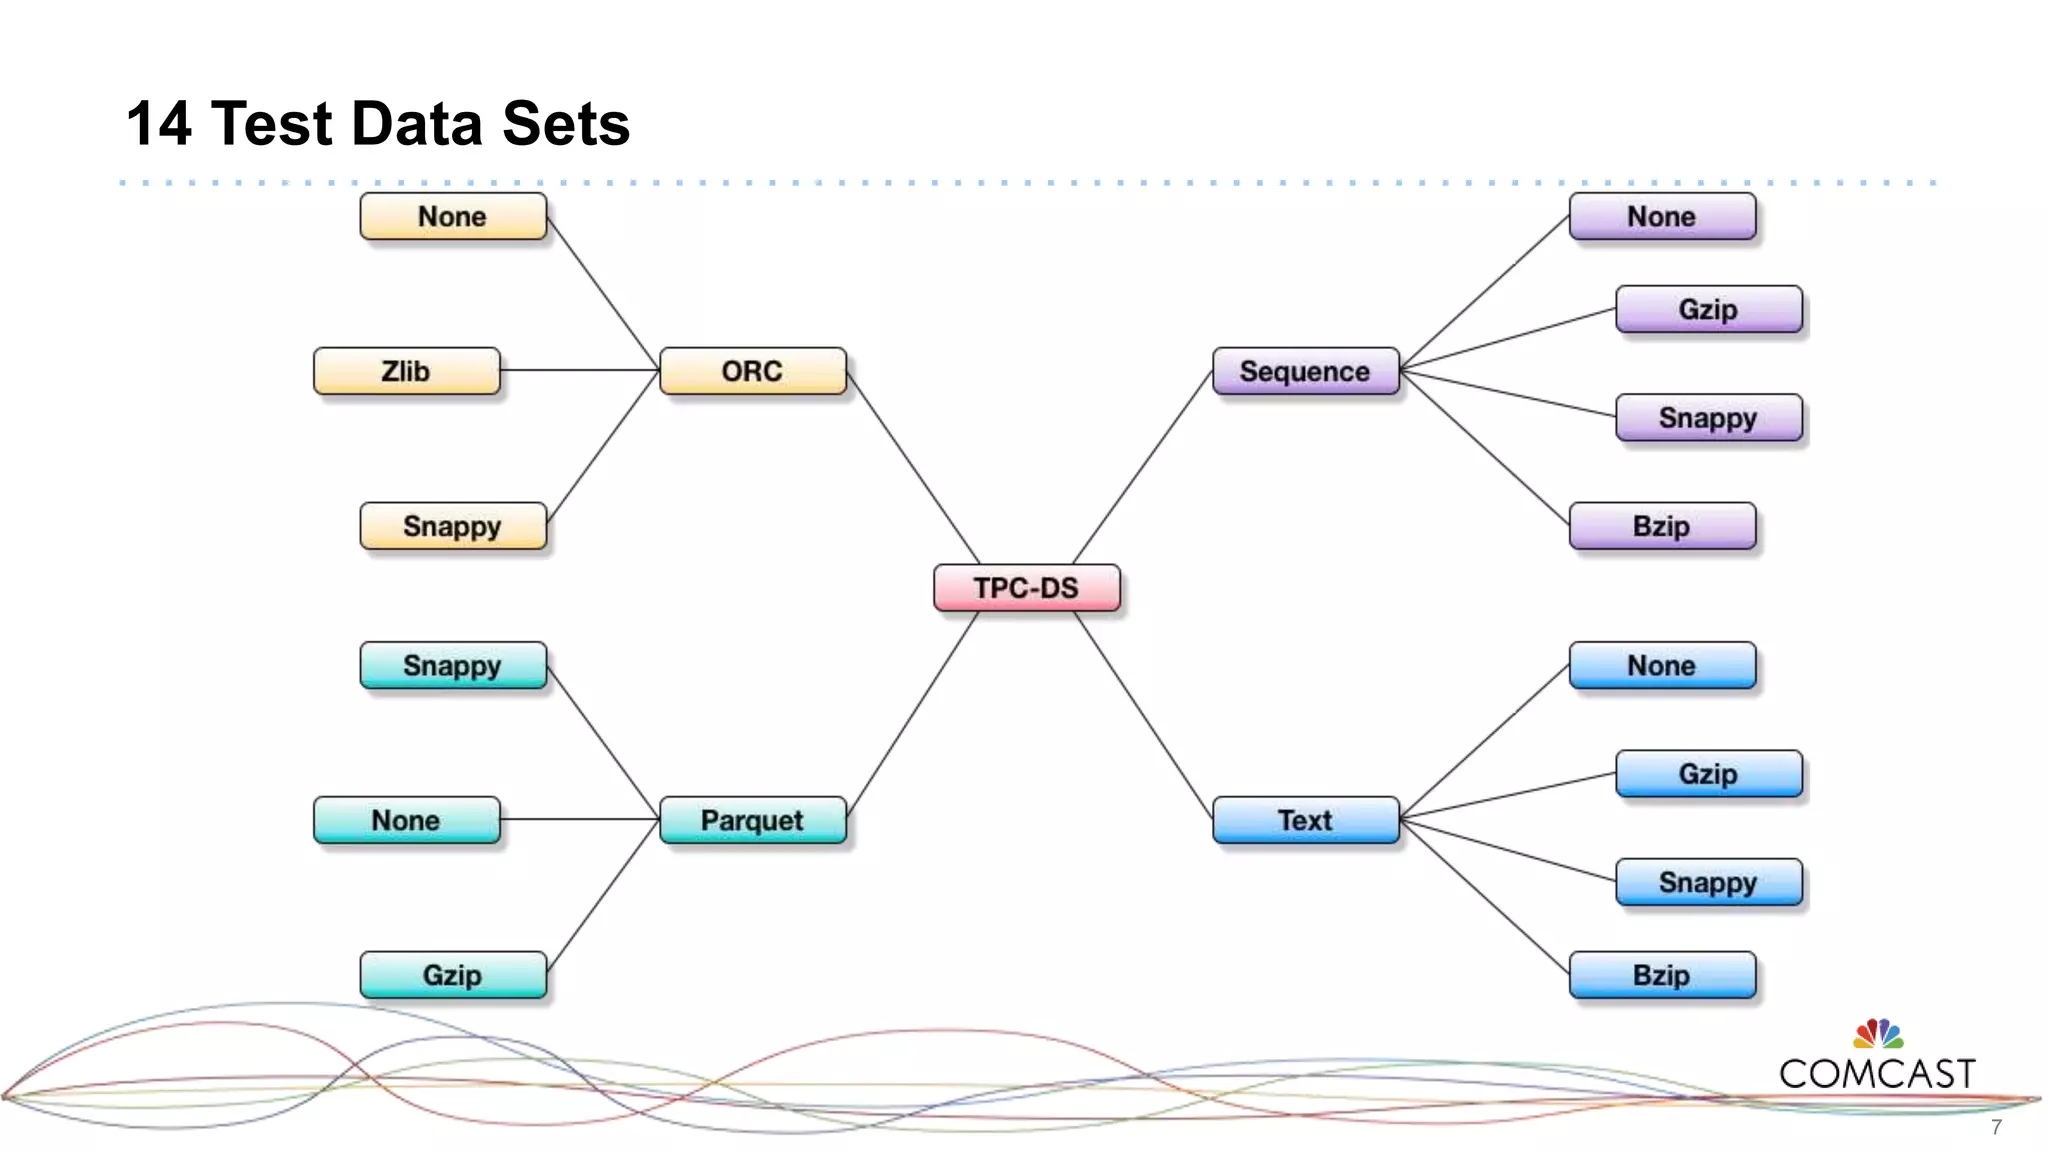
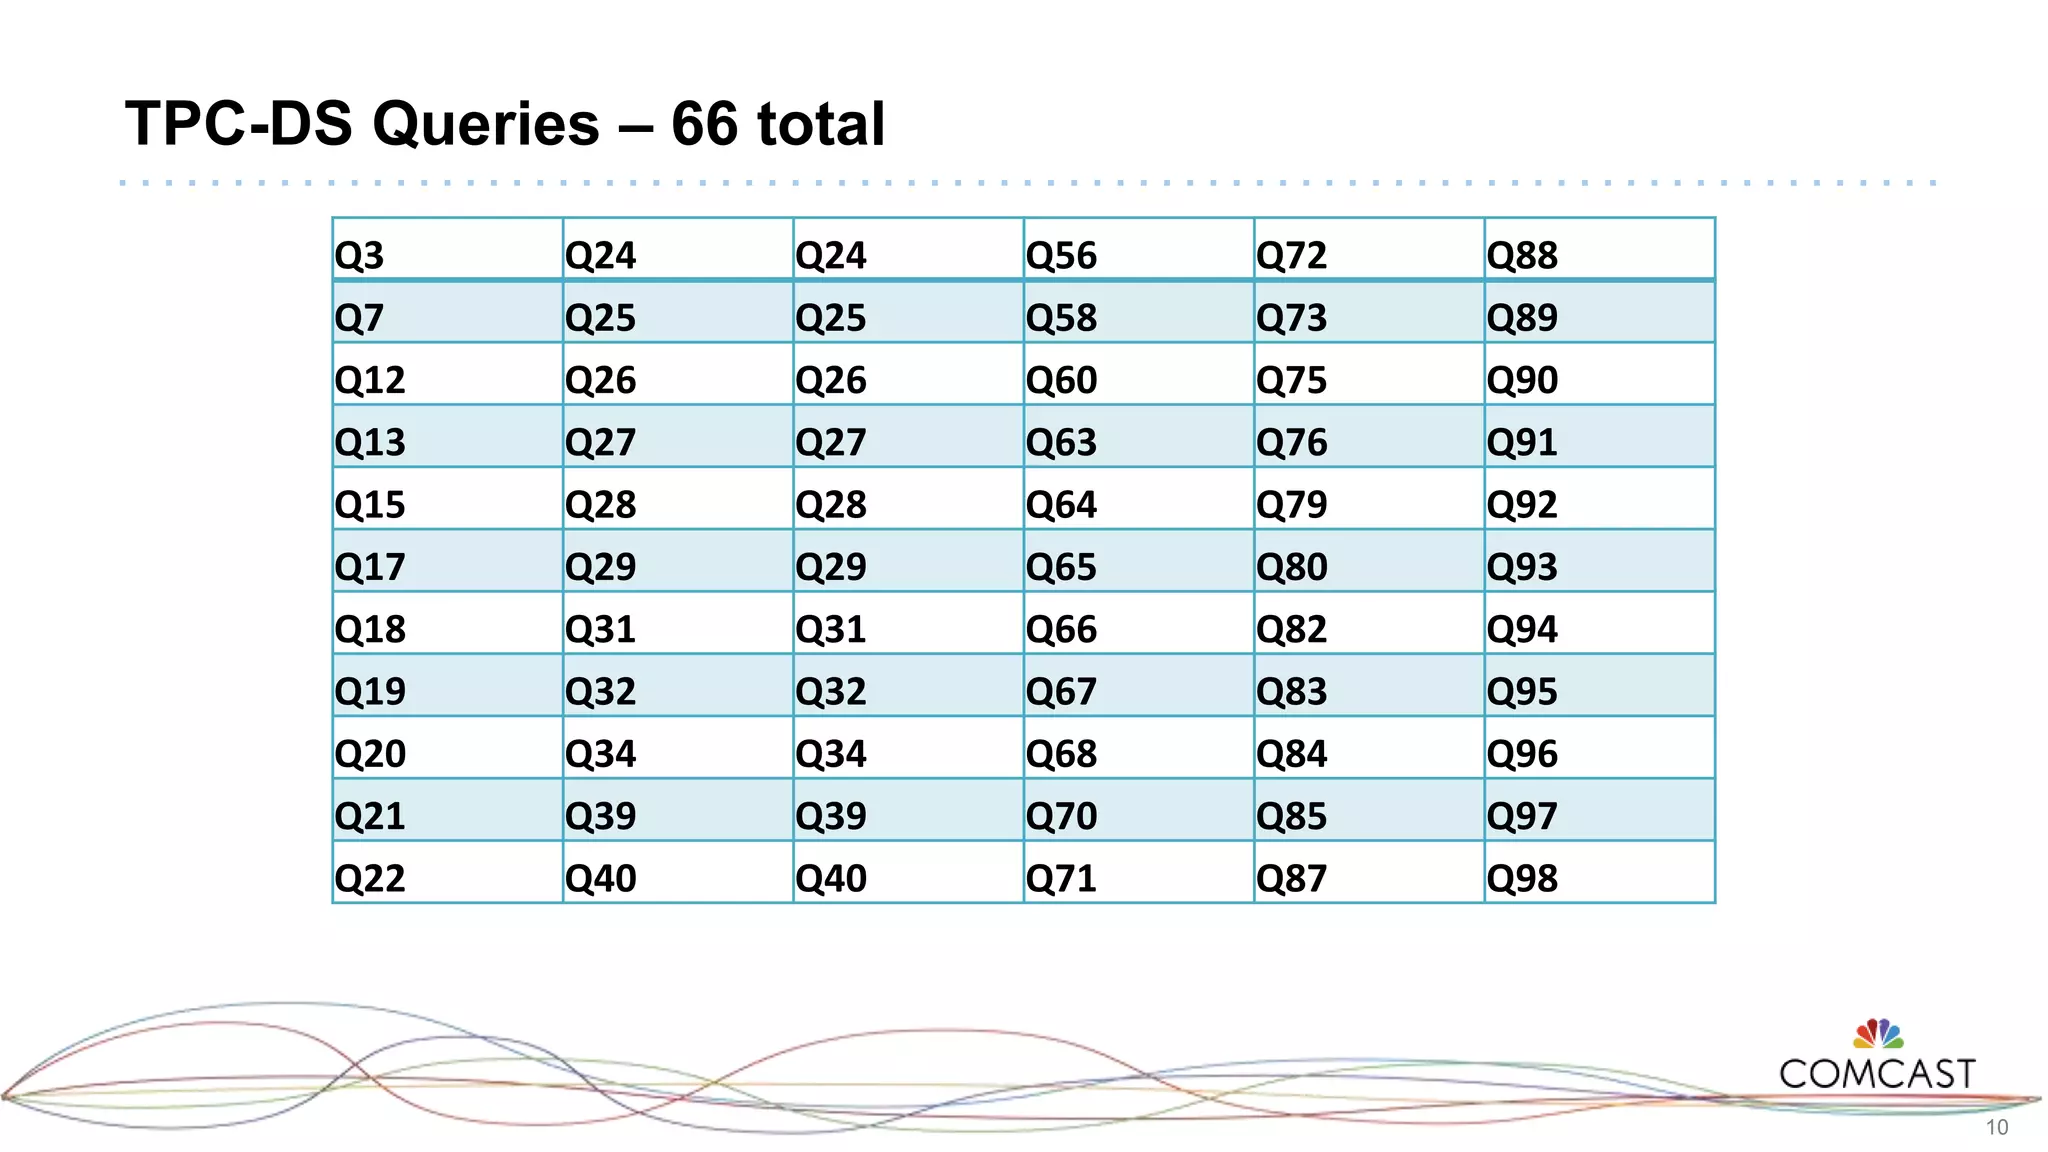
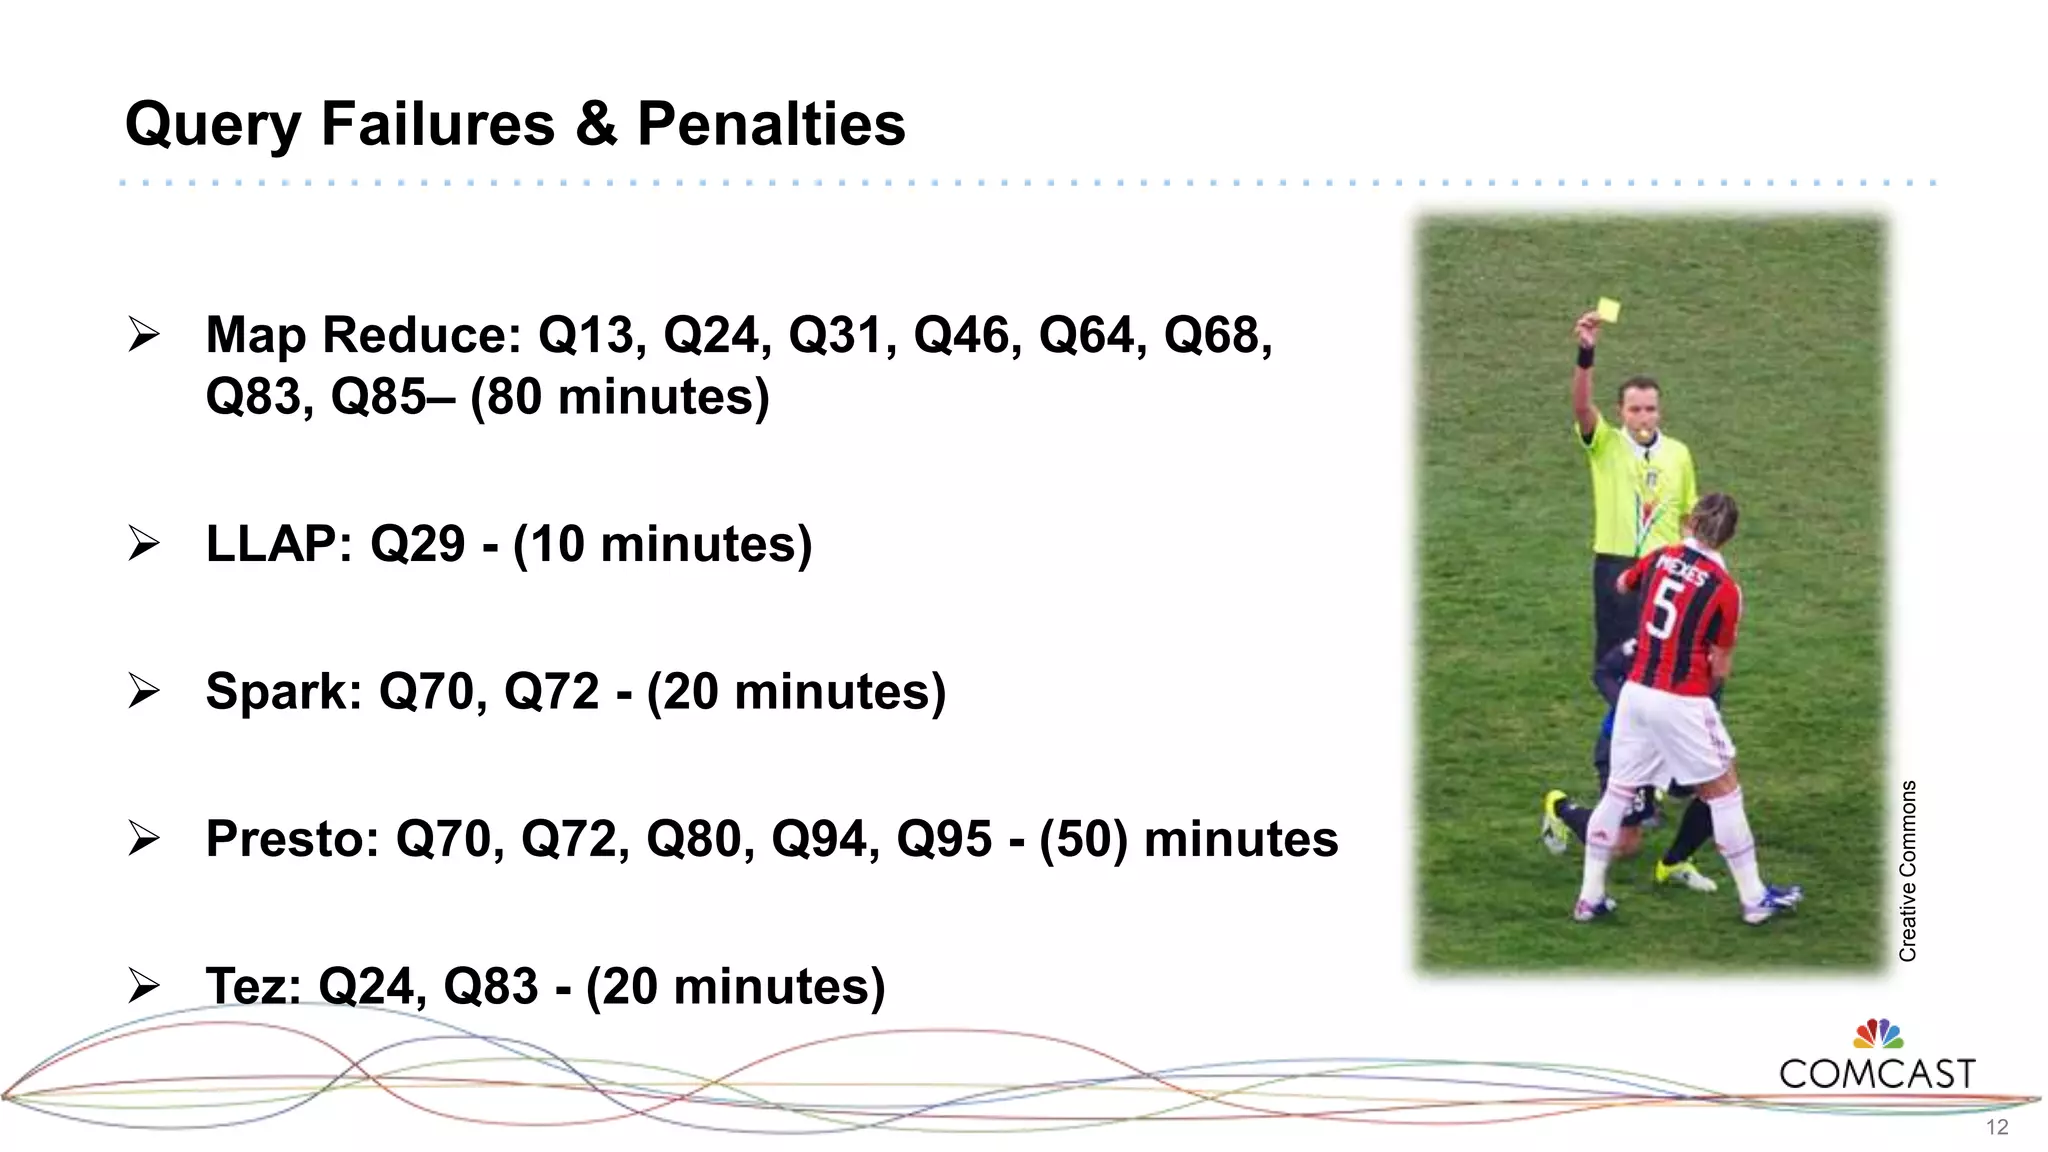
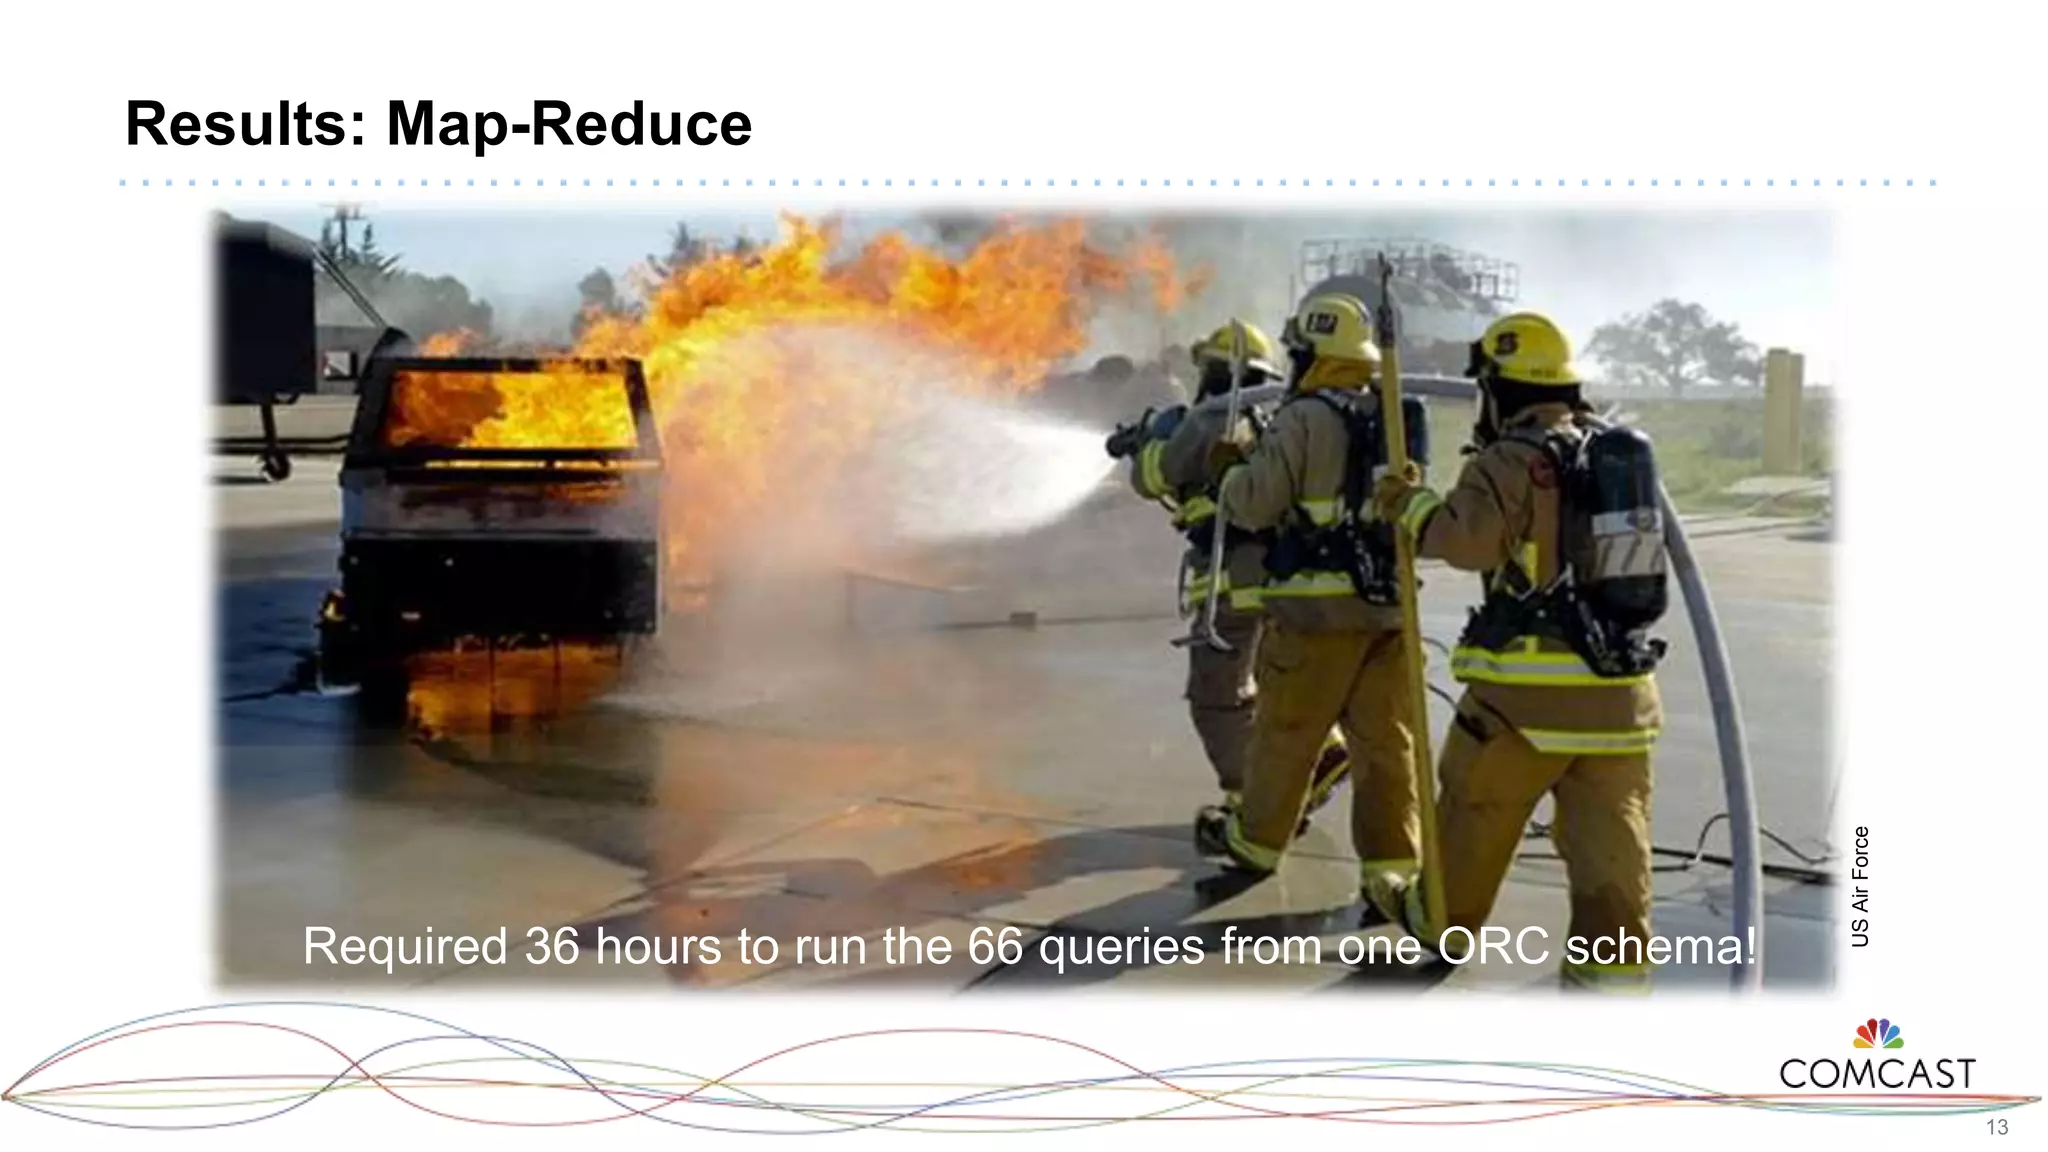
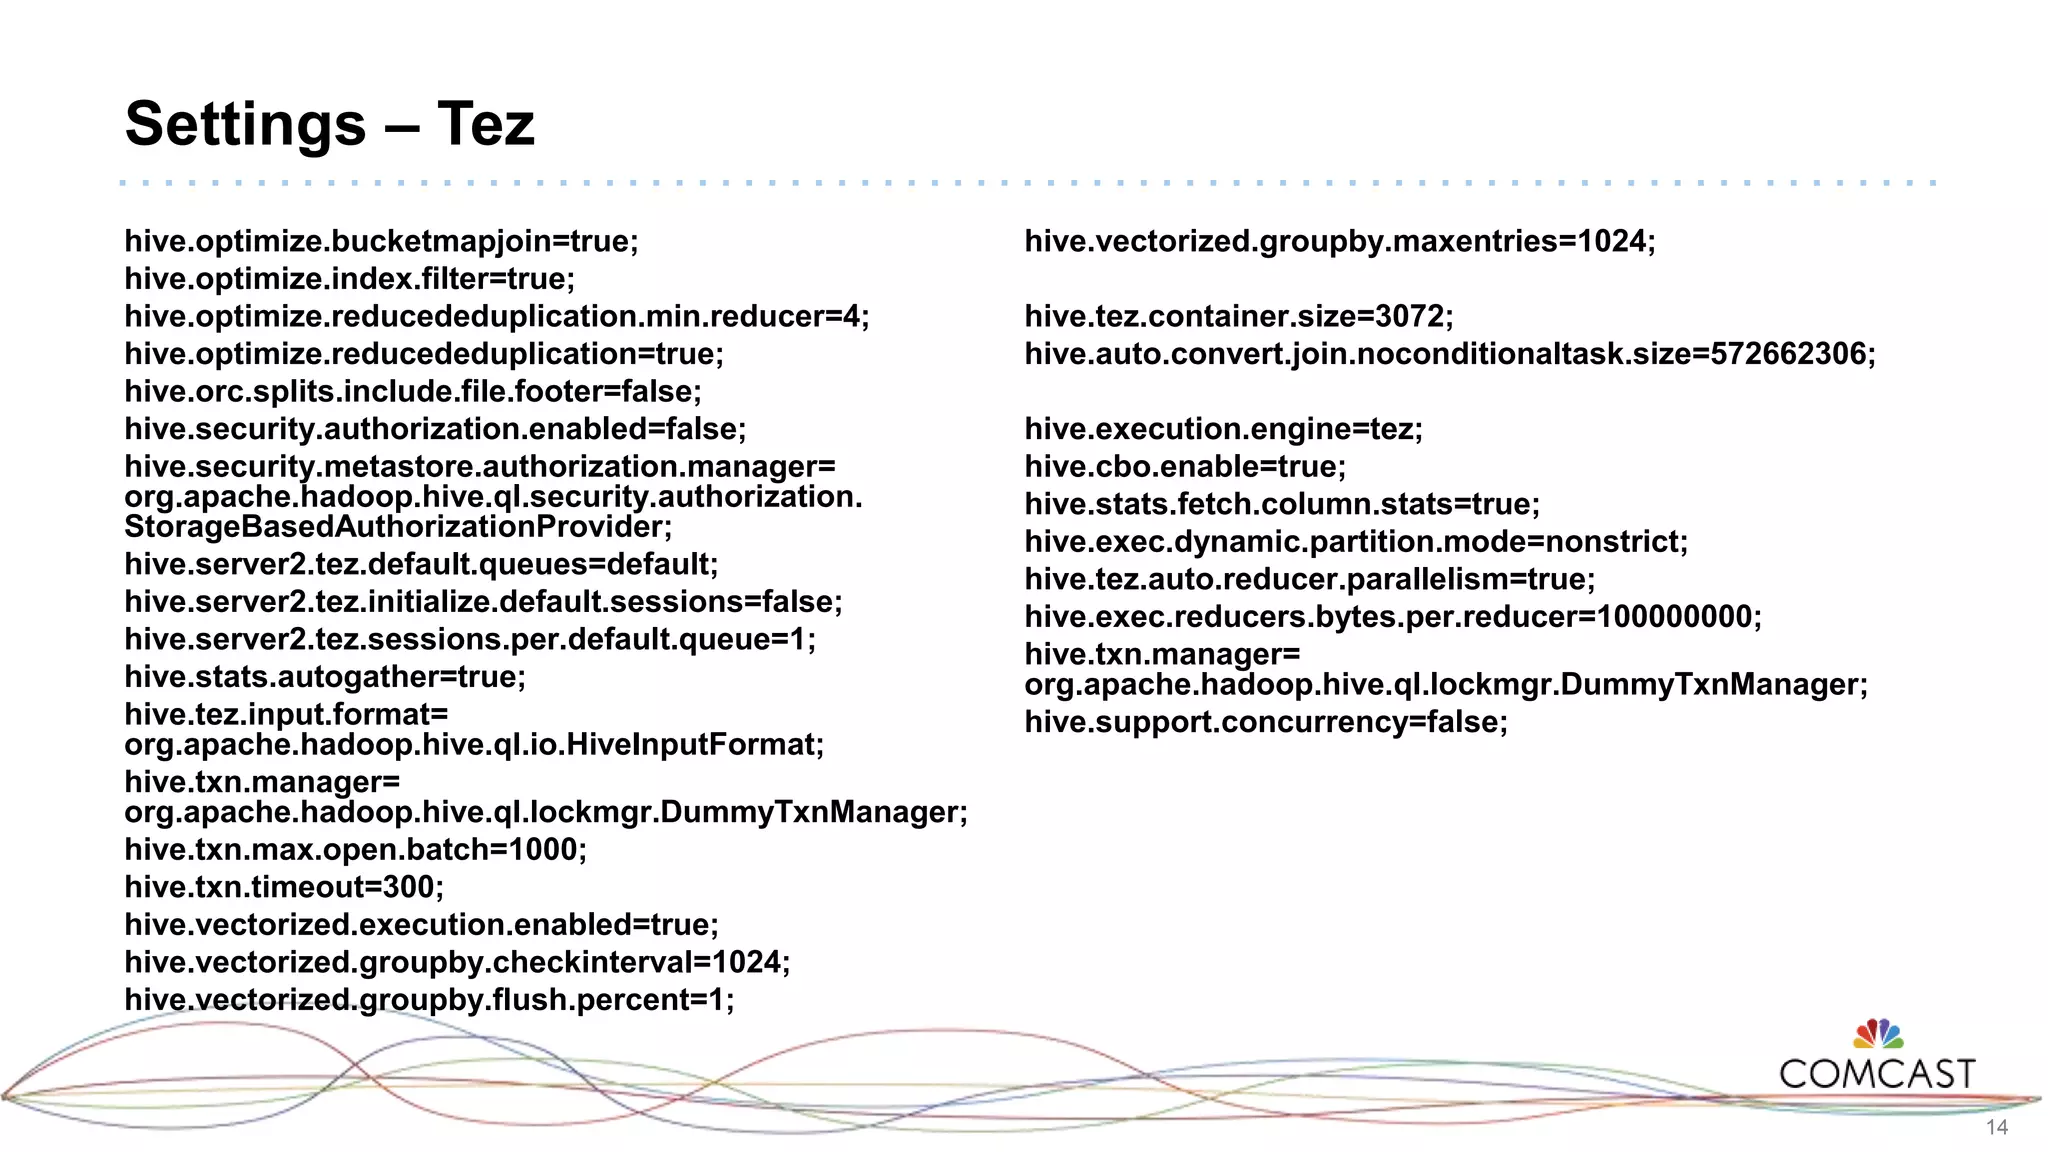
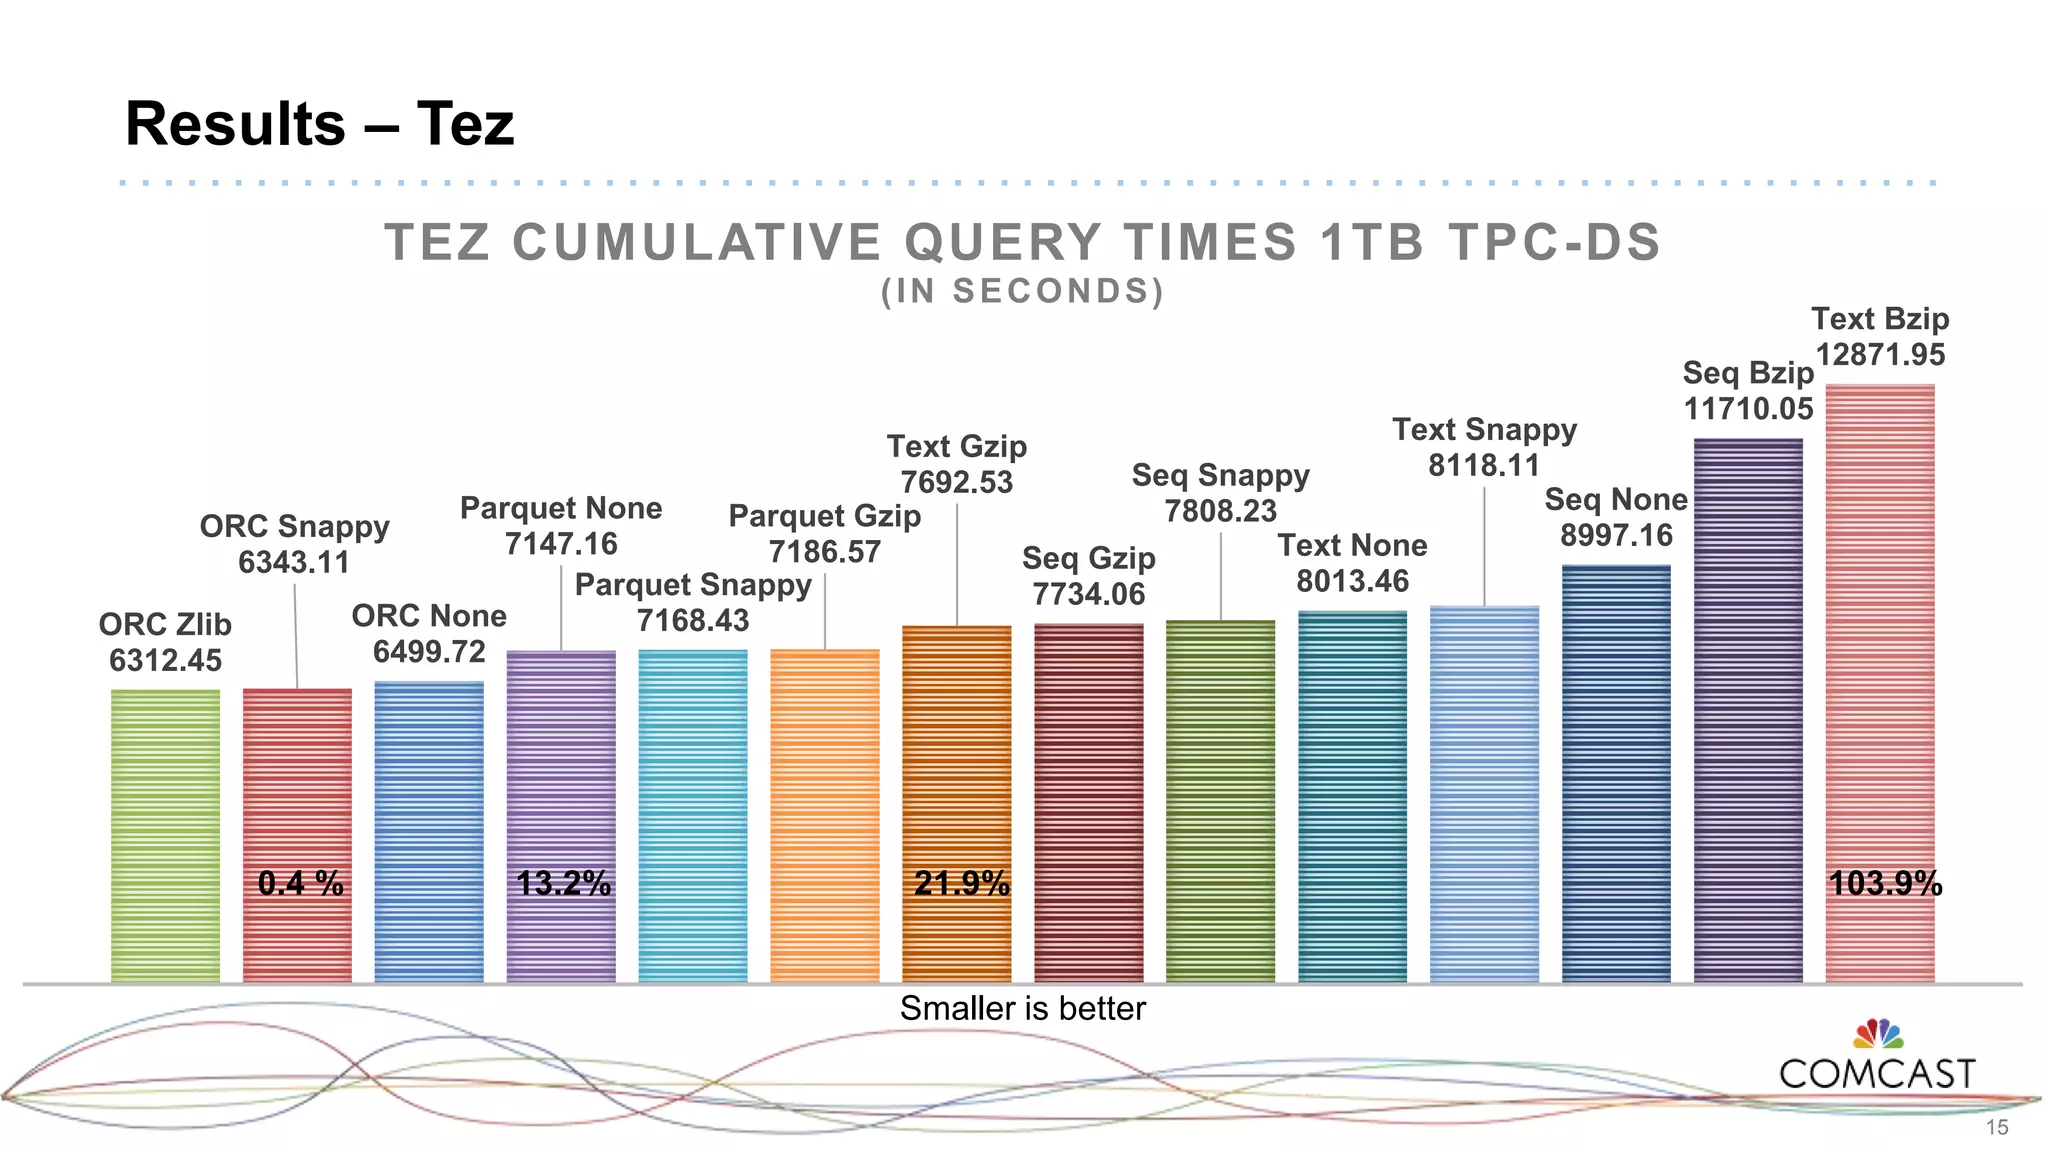
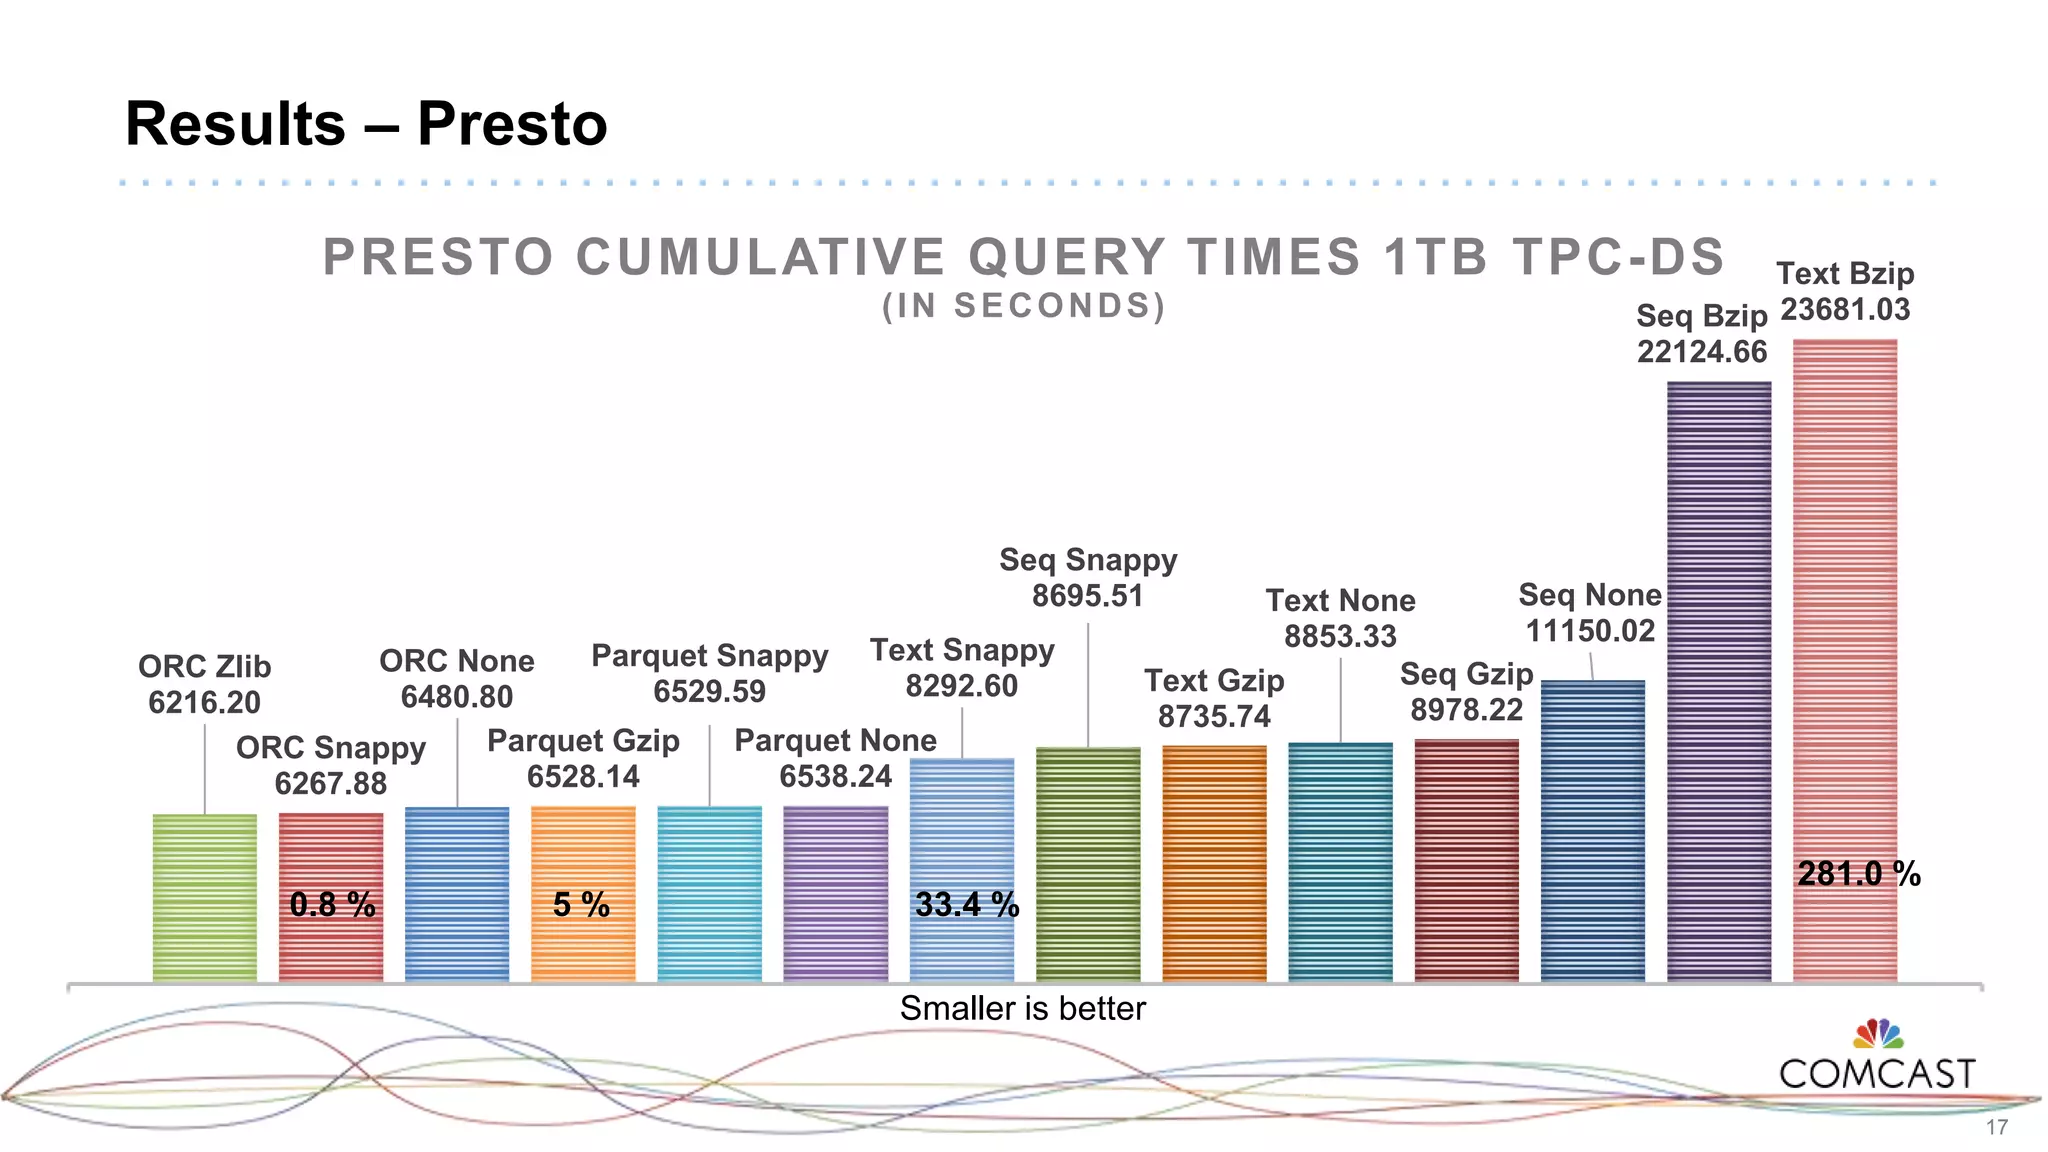
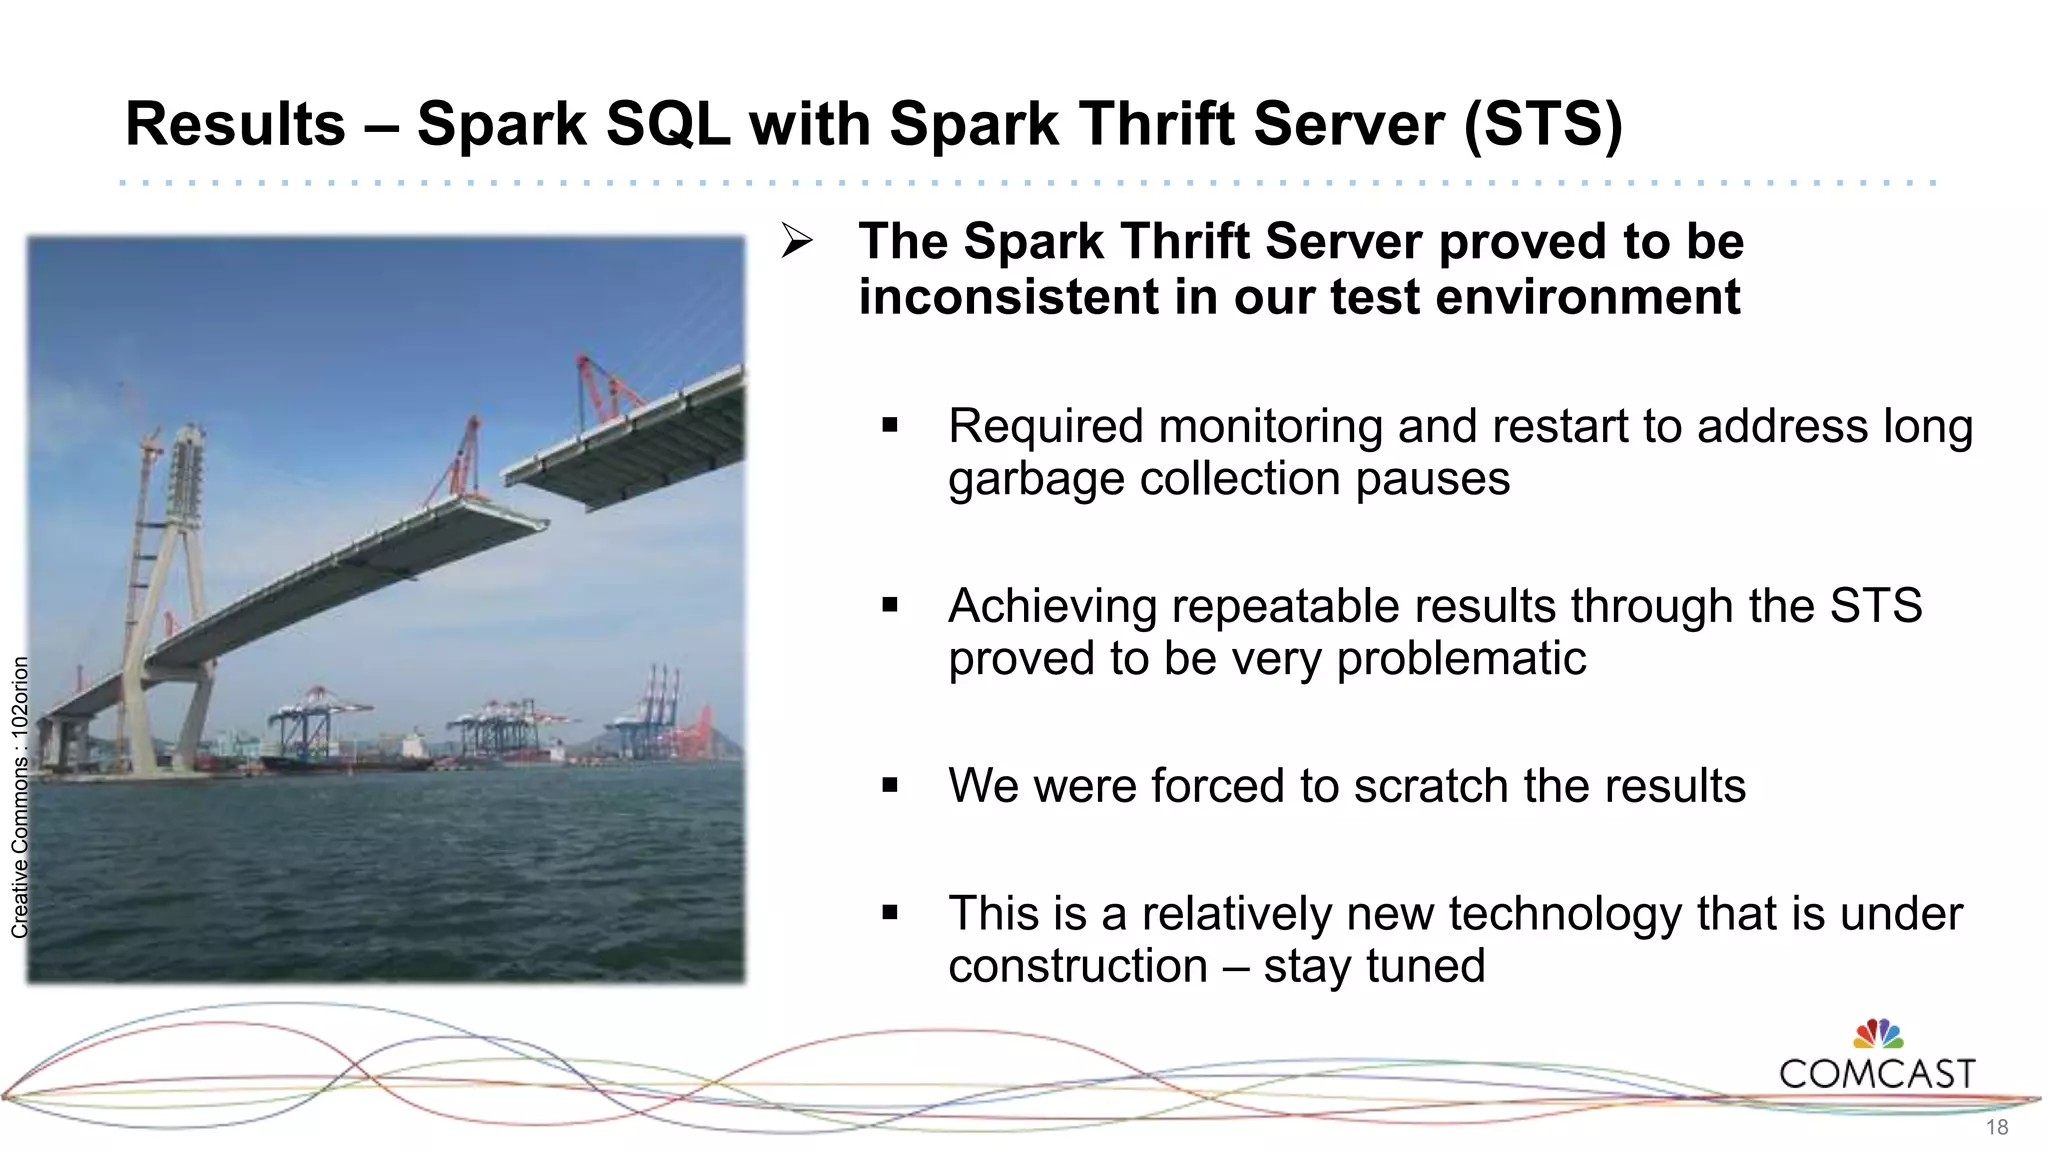
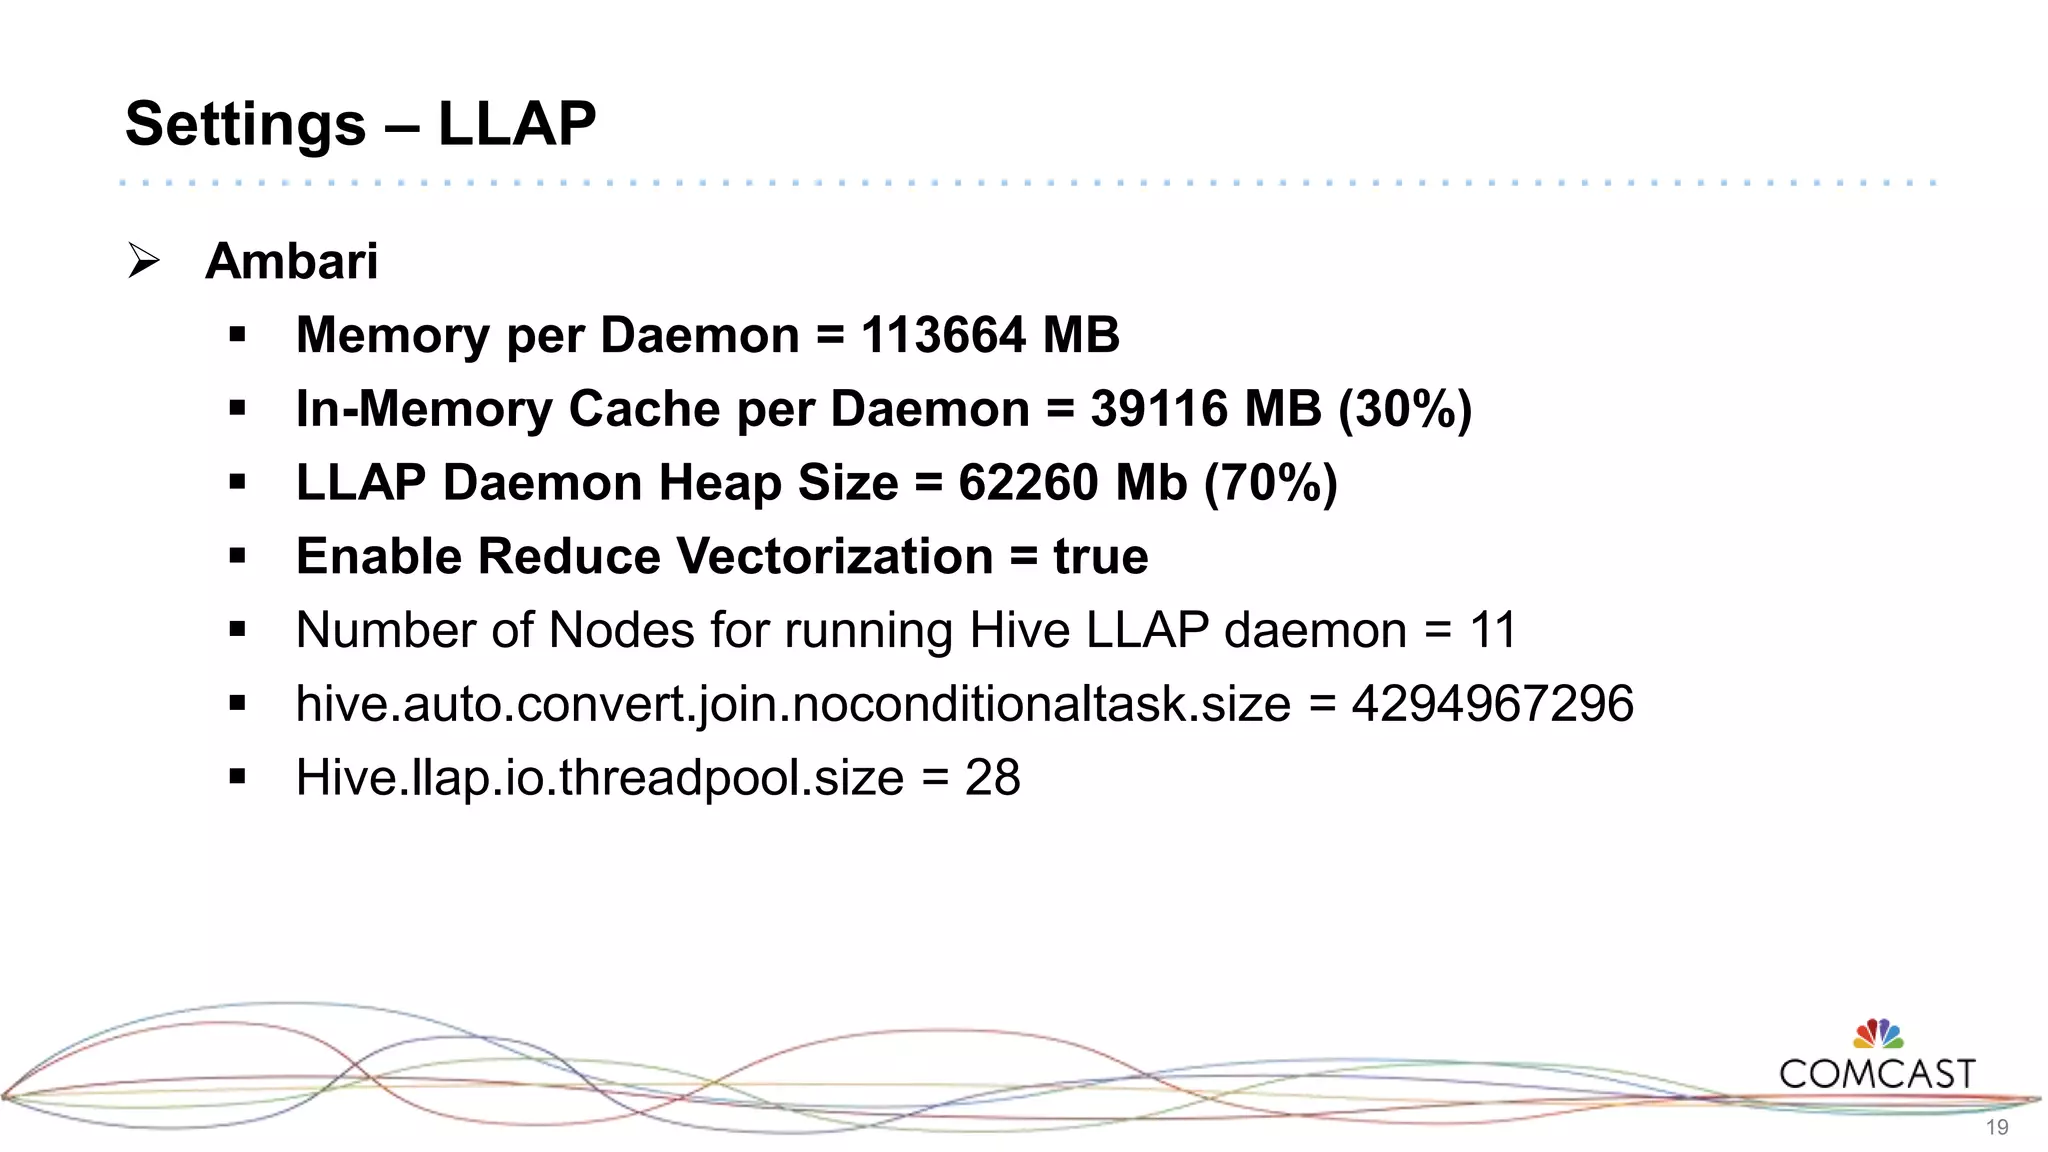
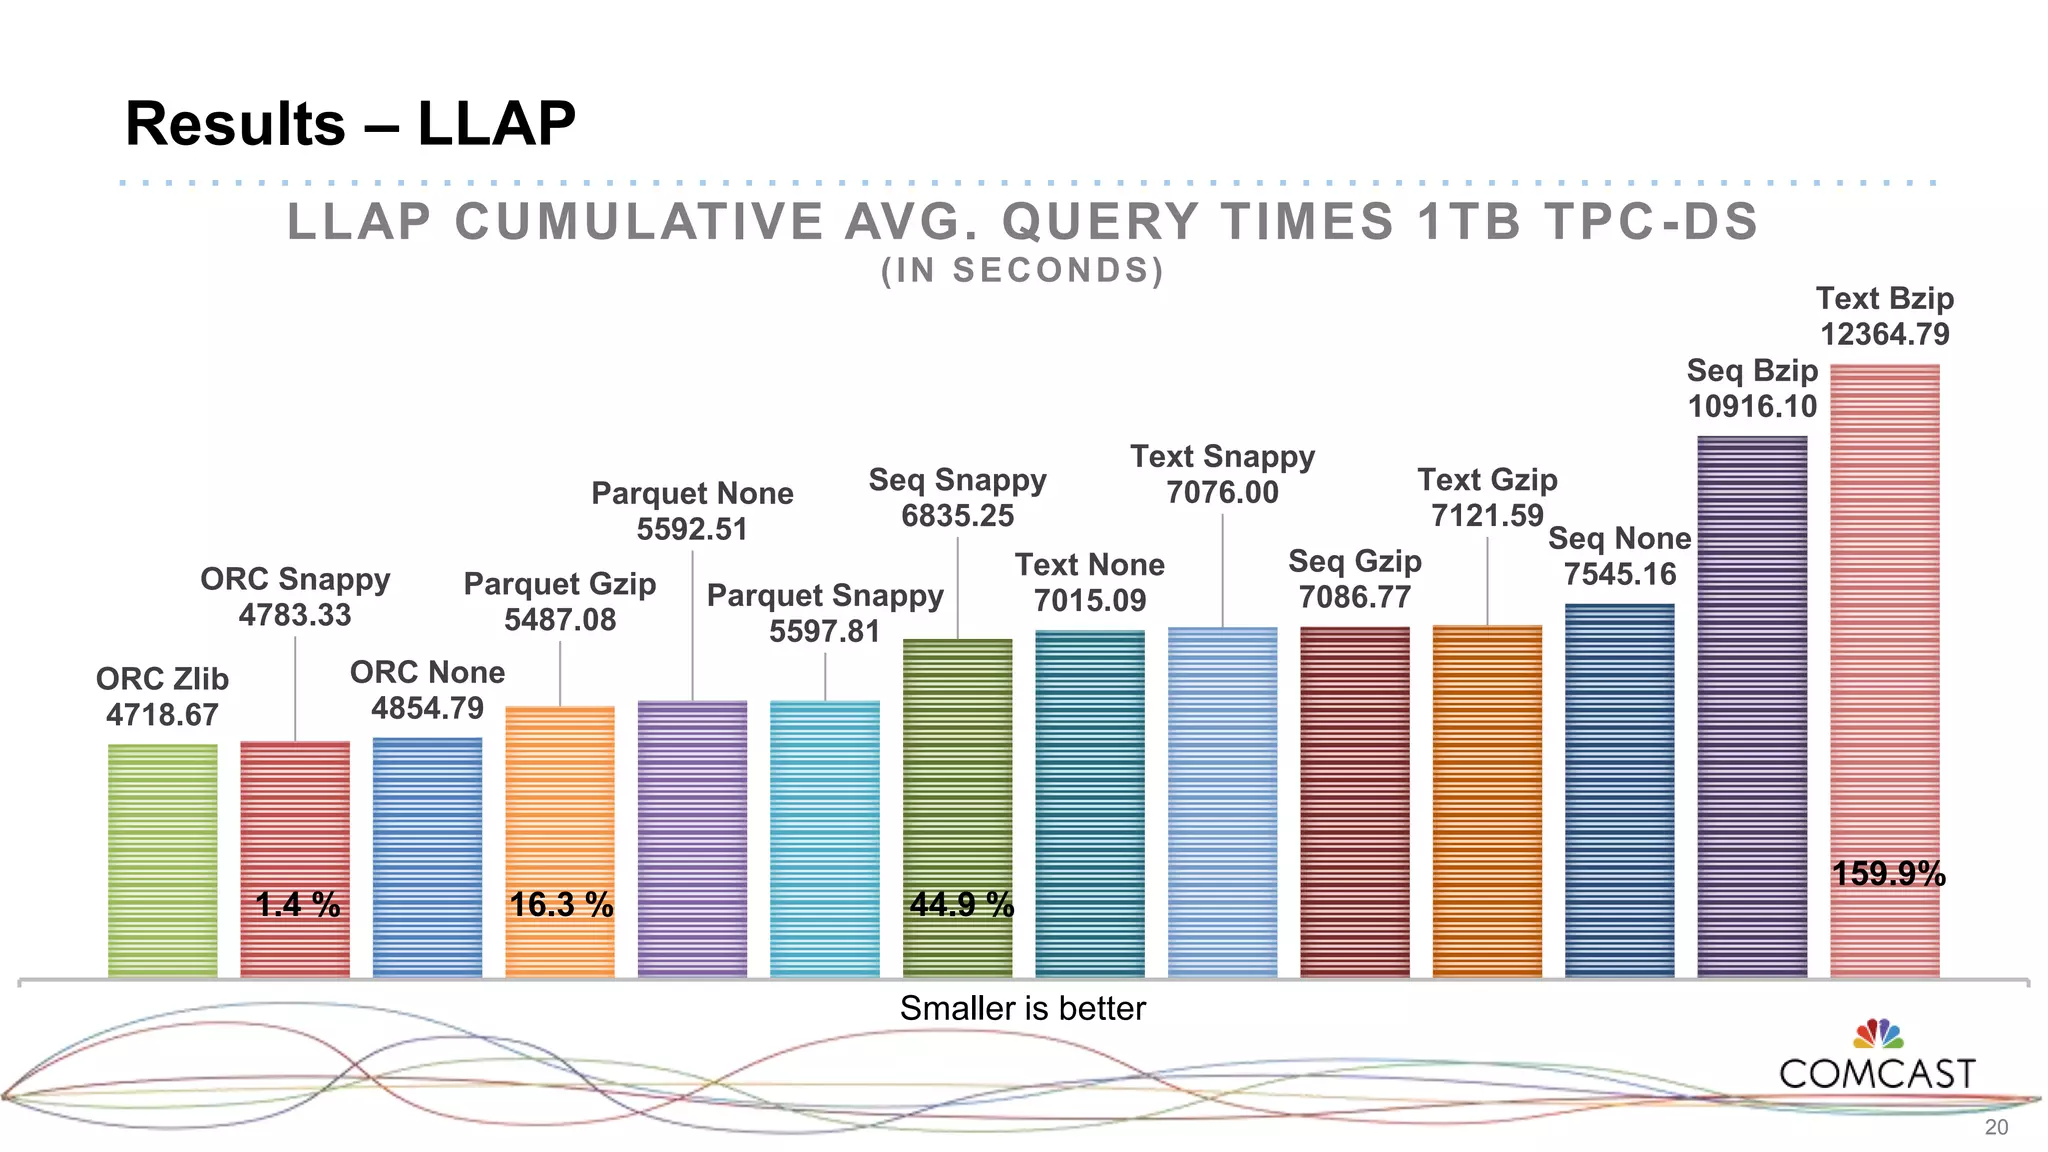
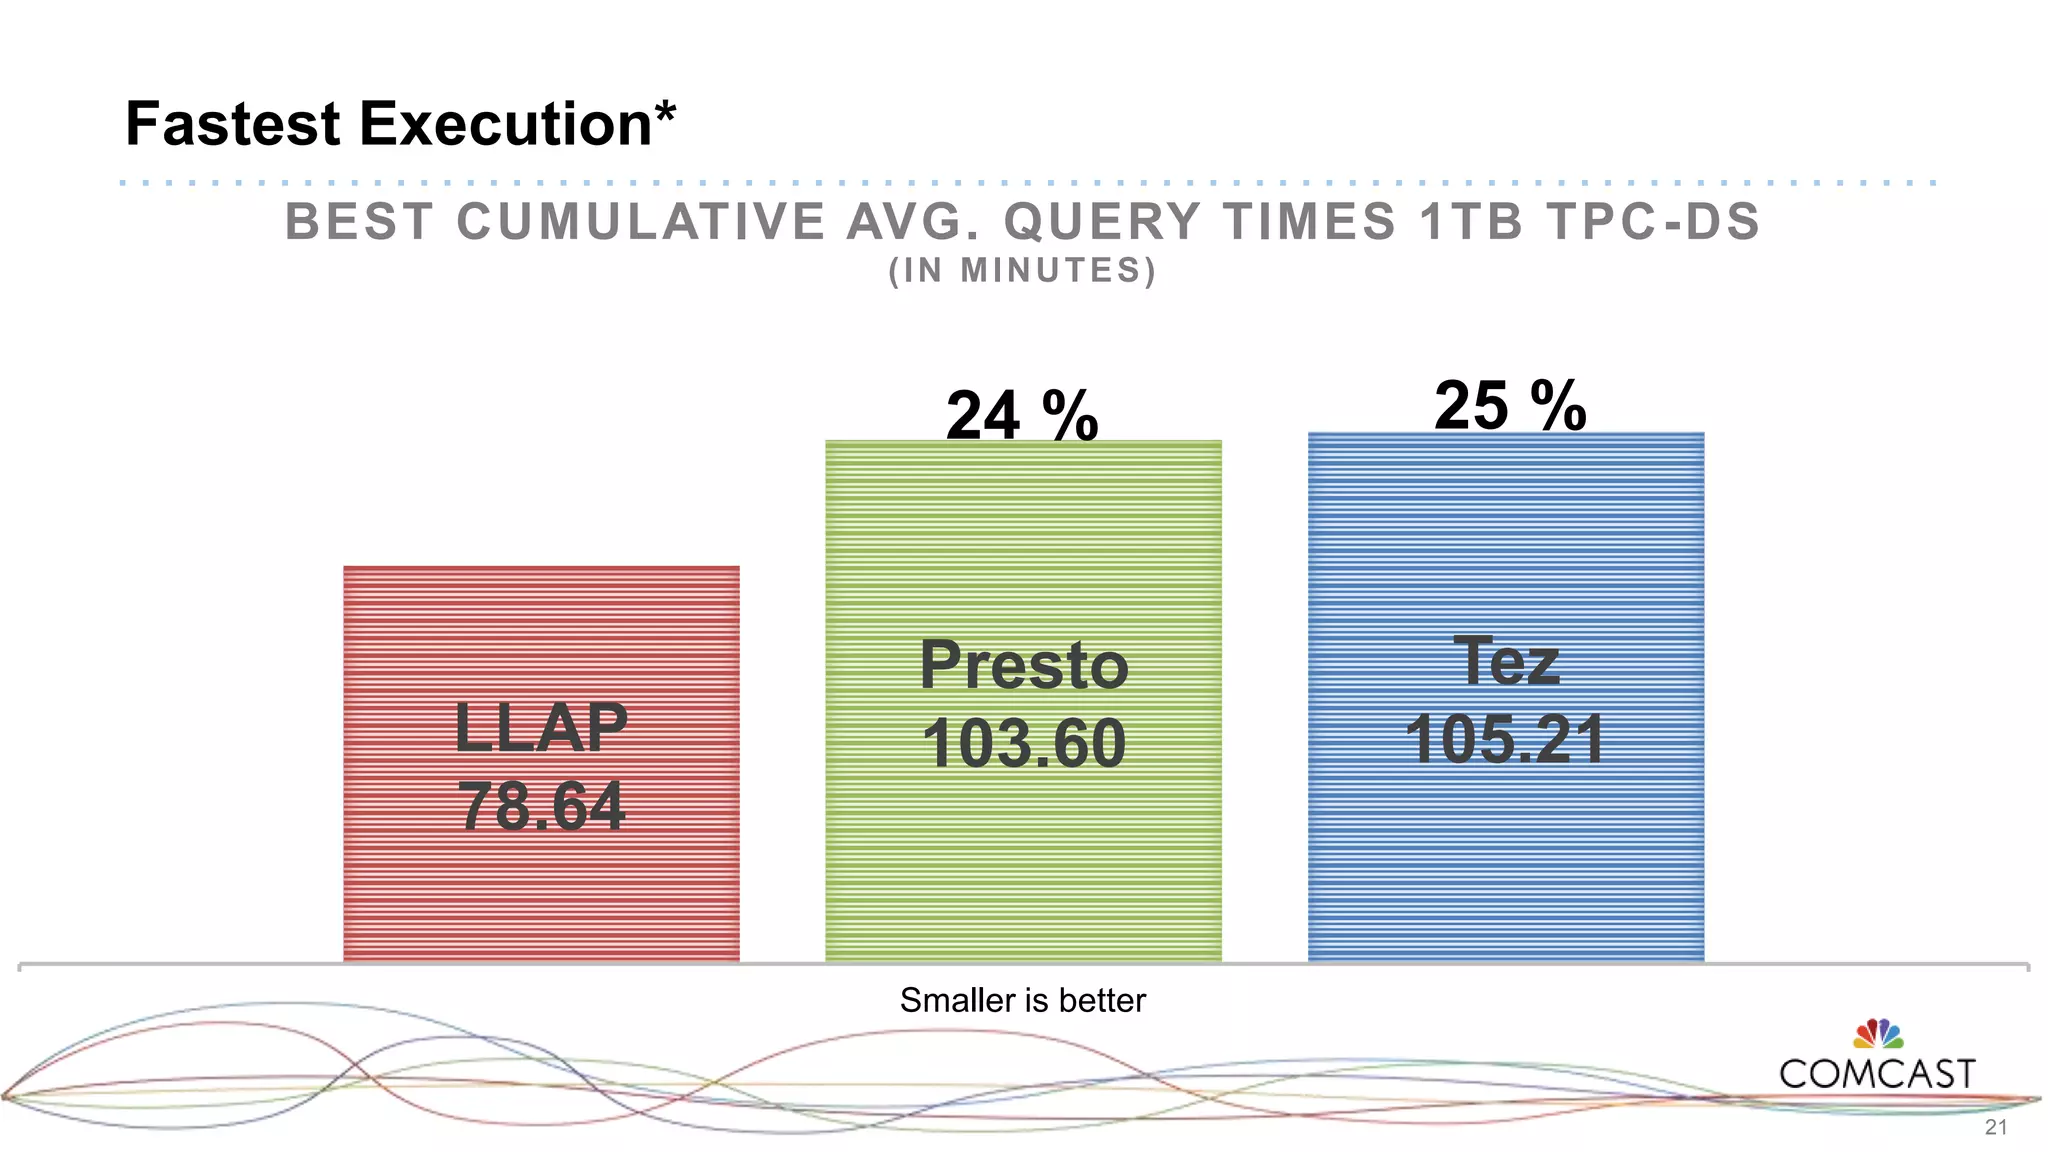
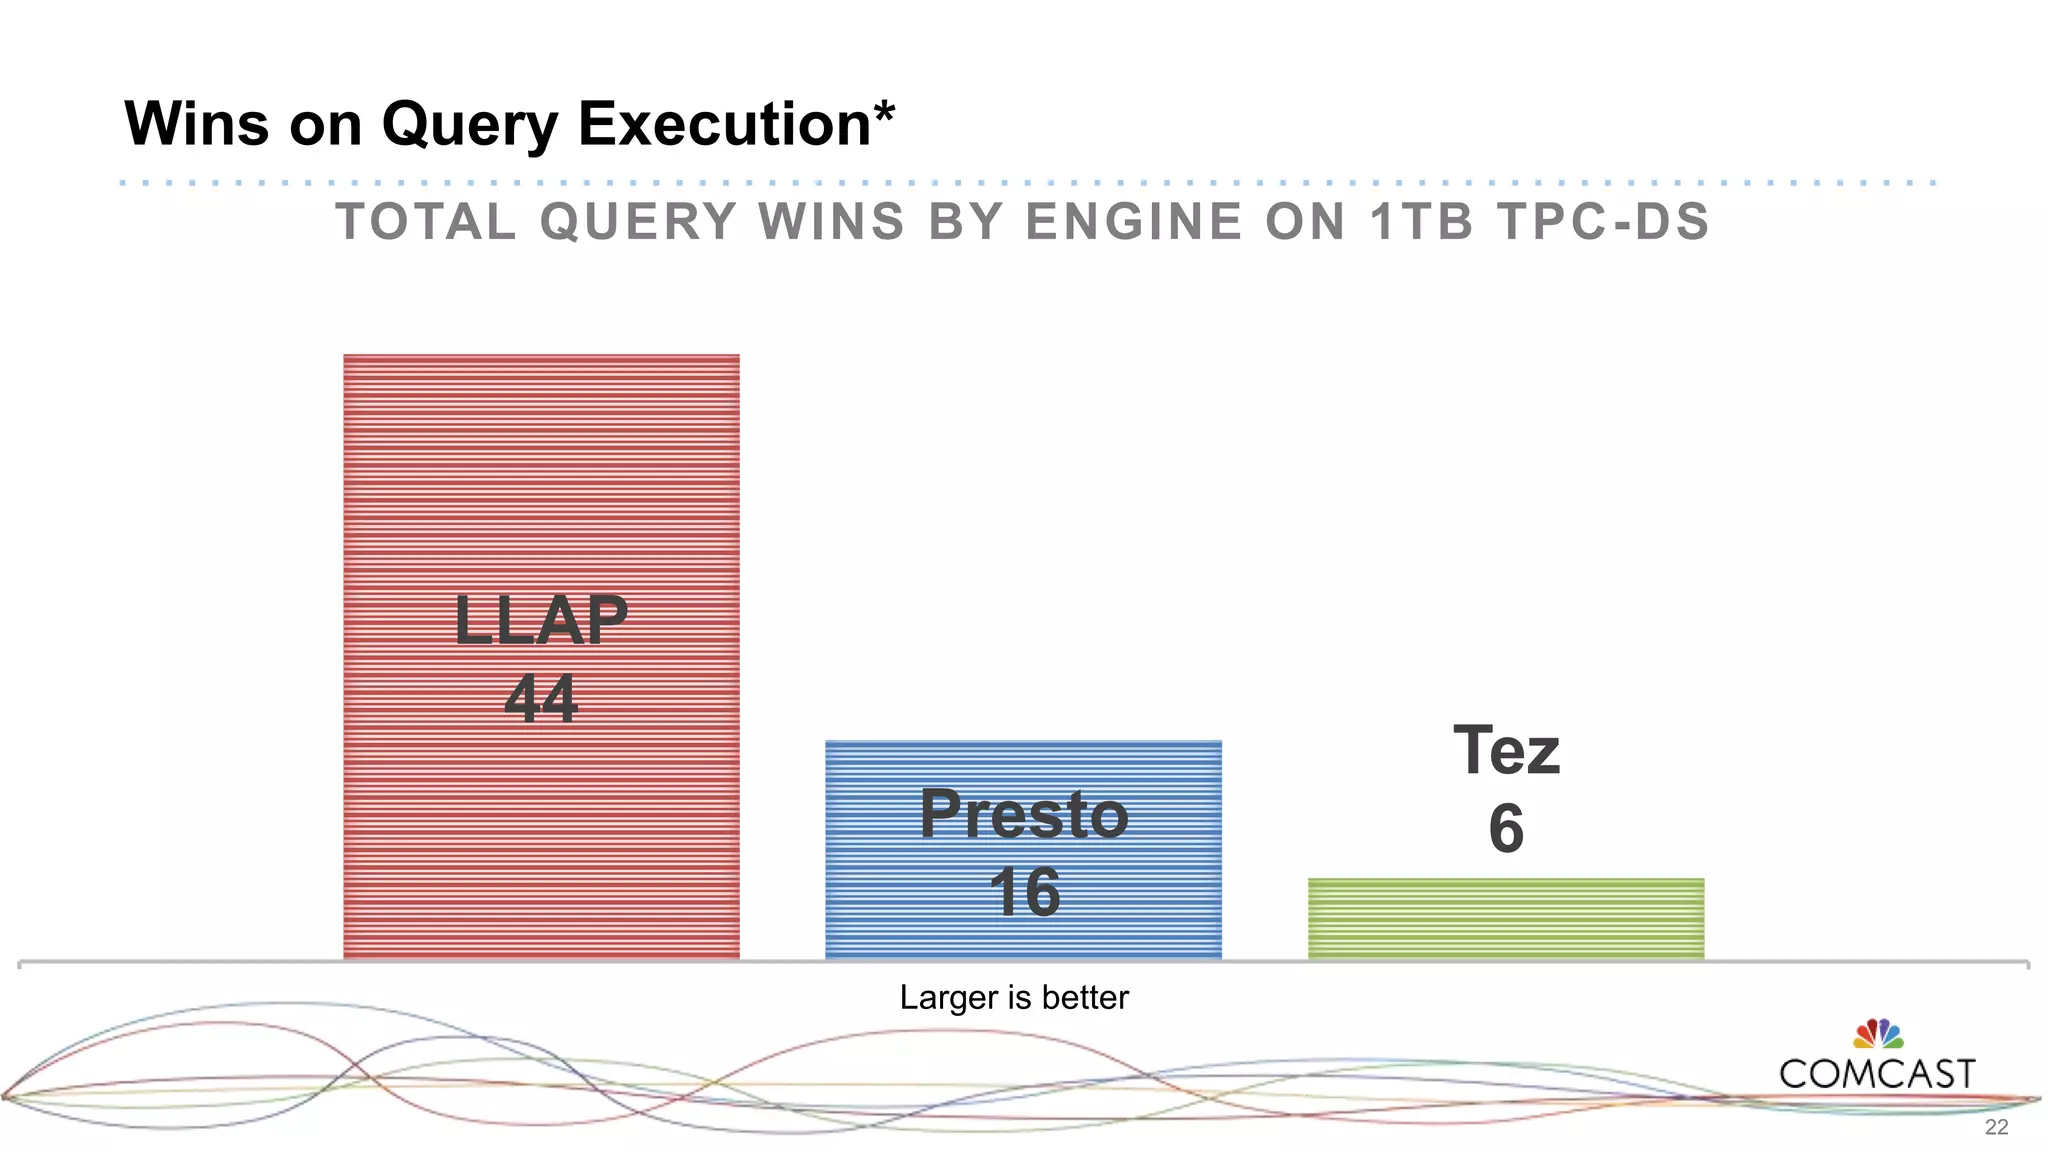
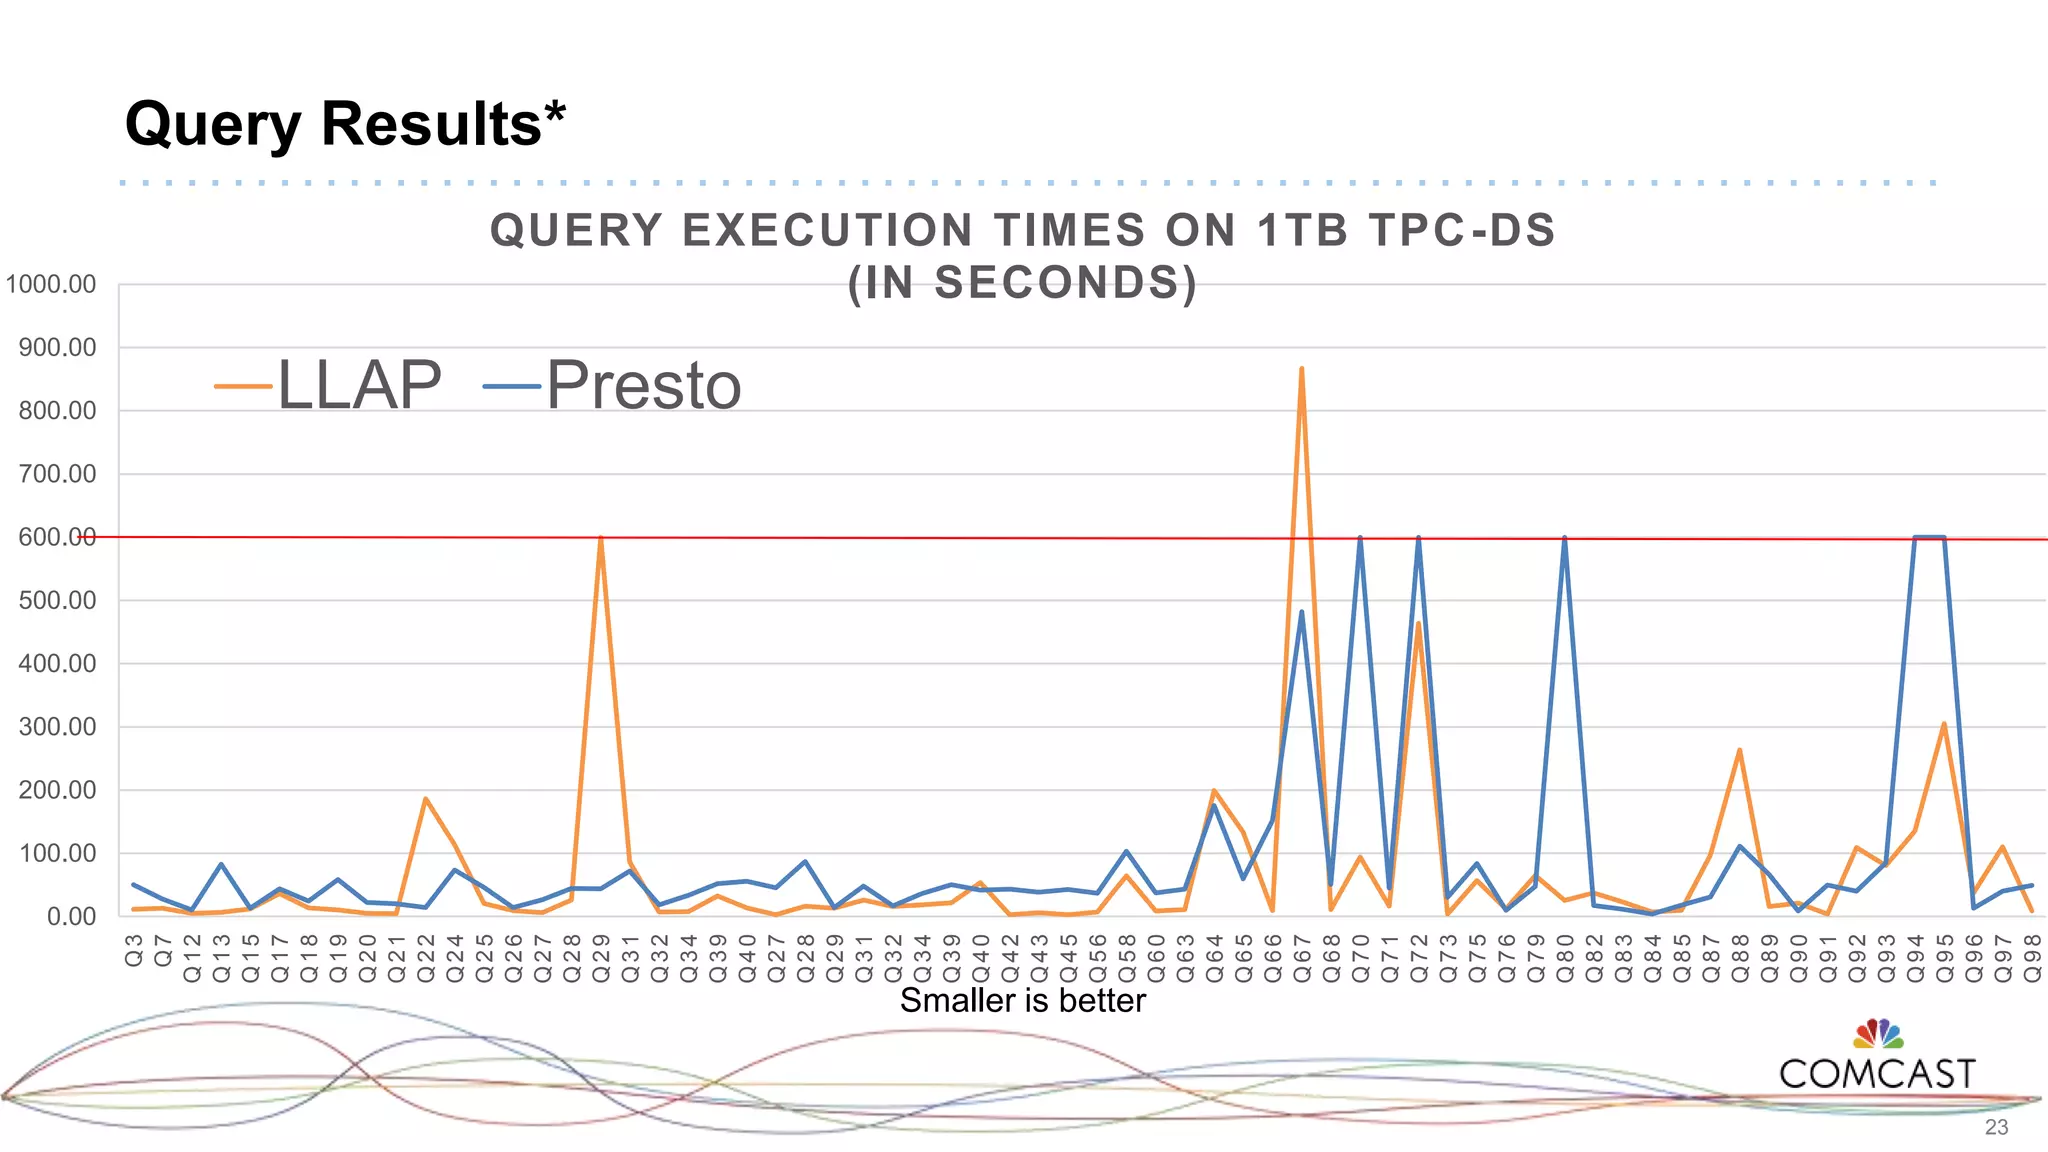
Hadoop Query Performance
Smackdown
Michael Fagan & Dushyanth Vaddi
June 14 2017
2
Background on Big Data at Comcast
 1K+ users in enterprise data lake
 Spectrum of use cases
 Multi-tenant PAS, SAS, DAS
 24x7 Environment
 Speed & Stability are King & Queen!
 Petabytes of enterprise data available via Hive tables
3
Focus & Outcomes
 Focus on SQL query engines that can be connected to traditional BI &
Reporting Tools
 Independent performance results from our lab.
 Which engine(s) are the fastest running the TPC – DS dataset?
 Are there significant performance differences in how the data is stored and
compressed?
 How do these engines perform in a memory limited environment?
 Which engine(s) would you offer to your executive staff?
4
Test Environment
 Physical Masters (5)
 32 cores
 90Gb Ram
 12x4Tb Hard Drives
 10 Gb Ethernet
 Physical Workers (11)
 32 cores
 128Gb Ram
 12x4Tb Hard Drives
 10 Gb Ethernet
 40Gb Rack top switches
CreativeCommons
5
Software
 Host OS - CentOS 6.8
 Hadoop - HDP 2.6.0.3
 MapReduce2 – 2.7.3.2.6
 Hive/LLAP - 1.2.1.26
 Tez - 0.7.0
 Spark – 2.1.0
 Presto – 0.175
6
Test Data & Queries
 Started with Hortonworks hive test benchmark repository
https://github.com/hortonworks/hive-testbench
 Generated base 1TB TPC-DS partitioned tables
 Used base data to build 14 test databases
 Table and partition stats were collected on all schemas
7
14 Test Data Sets
8
Test Methodology
 Utilized all 66 TPC-DS Queries defined in Hive Benchmark
 Same SQL executed in all engines*
 Presto had issues with casting dates
 Presto currently does not support “use db;”
 Care was taken to tune engine & configurations
 We expect everyone can find additional optimizations
 Queries are run against one engine at a time
 Allowing each engine to utilize all environment resources
 Each query is was run consecutively 3 times
9
Performance Measurement
 Time is measured in wall clock execution time on server
 Queries Invoked via Beeline
 Utilize !sh command to write out query timings
 Implemented simple SQL client for Presto
 Failed queries where assigned a penalty time of 10 minutes
10
TPC-DS Queries – 66 total
Q3 Q24 Q24 Q56 Q72 Q88
Q7 Q25 Q25 Q58 Q73 Q89
Q12 Q26 Q26 Q60 Q75 Q90
Q13 Q27 Q27 Q63 Q76 Q91
Q15 Q28 Q28 Q64 Q79 Q92
Q17 Q29 Q29 Q65 Q80 Q93
Q18 Q31 Q31 Q66 Q82 Q94
Q19 Q32 Q32 Q67 Q83 Q95
Q20 Q34 Q34 Q68 Q84 Q96
Q21 Q39 Q39 Q70 Q85 Q97
Q22 Q40 Q40 Q71 Q87 Q98
11
Results
CreativeCommons
Results
12
Query Failures & Penalties
 Map Reduce: Q13, Q24, Q31, Q46, Q64, Q68,
Q83, Q85– (80 minutes)
 LLAP: Q29 - (10 minutes)
 Spark: Q70, Q72 - (20 minutes)
 Presto: Q70, Q72, Q80, Q94, Q95 - (50) minutes
 Tez: Q24, Q83 - (20 minutes)
CreativeCommons
13
Results: Map-Reduce
USAirForce
Required 36 hours to run the 66 queries from one ORC schema!
14
Settings – Tez
hive.optimize.bucketmapjoin=true;
hive.optimize.index.filter=true;
hive.optimize.reducededuplication.min.reducer=4;
hive.optimize.reducededuplication=true;
hive.orc.splits.include.file.footer=false;
hive.security.authorization.enabled=false;
hive.security.metastore.authorization.manager=
org.apache.hadoop.hive.ql.security.authorization.
StorageBasedAuthorizationProvider;
hive.server2.tez.default.queues=default;
hive.server2.tez.initialize.default.sessions=false;
hive.server2.tez.sessions.per.default.queue=1;
hive.stats.autogather=true;
hive.tez.input.format=
org.apache.hadoop.hive.ql.io.HiveInputFormat;
hive.txn.manager=
org.apache.hadoop.hive.ql.lockmgr.DummyTxnManager;
hive.txn.max.open.batch=1000;
hive.txn.timeout=300;
hive.vectorized.execution.enabled=true;
hive.vectorized.groupby.checkinterval=1024;
hive.vectorized.groupby.flush.percent=1;
hive.vectorized.groupby.maxentries=1024;
hive.tez.container.size=3072;
hive.auto.convert.join.noconditionaltask.size=572662306;
hive.execution.engine=tez;
hive.cbo.enable=true;
hive.stats.fetch.column.stats=true;
hive.exec.dynamic.partition.mode=nonstrict;
hive.tez.auto.reducer.parallelism=true;
hive.exec.reducers.bytes.per.reducer=100000000;
hive.txn.manager=
org.apache.hadoop.hive.ql.lockmgr.DummyTxnManager;
hive.support.concurrency=false;
15
Results – Tez
ORC Zlib
6312.45
ORC Snappy
6343.11
ORC None
6499.72
Parquet None
7147.16
Parquet Snappy
7168.43
Parquet Gzip
7186.57
Text Gzip
7692.53
Seq Gzip
7734.06
Seq Snappy
7808.23
Text None
8013.46
Text Snappy
8118.11
Seq None
8997.16
Seq Bzip
11710.05
Text Bzip
12871.95
1
TEZ CUMULATIVE QUERY TIMES 1TB TPC-DS
(IN SECONDS)
Smaller is better
0.4 % 13.2% 21.9% 103.9%
16
Settings – Presto
 config.properties
 query.max.memory = 1000 GB
 query.max-memory-per-node = 29 GB
 query.initial-hash-partitions=11
 task.concurrency=32
 jvm.conf
 -Server
 -Xmx50G
 -XX:+UseG1GC
 -XX:+UseGCOverheadLimit
 -XX:+ExplicitGCInvokesConcurrent
 -XX:+HeapDumpOnOutOfMemoryError
 -XX:OnOutOfMemoryError=kill -9 %p
17
Results – Presto
ORC Zlib
6216.20
ORC Snappy
6267.88
ORC None
6480.80
Parquet Gzip
6528.14
Parquet Snappy
6529.59
Parquet None
6538.24
Text Snappy
8292.60
Seq Snappy
8695.51
Text Gzip
8735.74
Text None
8853.33
Seq Gzip
8978.22
Seq None
11150.02
Seq Bzip
22124.66
Text Bzip
23681.03
1
PRESTO CUMULATIVE QUERY TIMES 1TB TPC-DS
(IN SECONDS)
Smaller is better
0.8 % 5 % 33.4 %
281.0 %
18
Results – Spark SQL with Spark Thrift Server (STS)
 The Spark Thrift Server proved to be
inconsistent in our test environment
 Required monitoring and restart to address long
garbage collection pauses
 Achieving repeatable results through the STS
proved to be very problematic
 We were forced to scratch the results
 This is a relatively new technology that is under
construction – stay tuned
CreativeCommons:102orion
19
Settings – LLAP
 Ambari
 Memory per Daemon = 113664 MB
 In-Memory Cache per Daemon = 39116 MB (30%)
 LLAP Daemon Heap Size = 62260 Mb (70%)
 Enable Reduce Vectorization = true
 Number of Nodes for running Hive LLAP daemon = 11
 hive.auto.convert.join.noconditionaltask.size = 4294967296
 Hive.llap.io.threadpool.size = 28
20
Results – LLAP
Smaller is better
ORC Zlib
4718.67
ORC Snappy
4783.33
ORC None
4854.79
Parquet Gzip
5487.08
Parquet None
5592.51
Parquet Snappy
5597.81
Seq Snappy
6835.25
Text None
7015.09
Text Snappy
7076.00
Seq Gzip
7086.77
Text Gzip
7121.59
Seq None
7545.16
Seq Bzip
10916.10
Text Bzip
12364.79
1
LLAP CUMULATIVE AVG. QUERY TIMES 1TB TPC-DS
(IN SECONDS)
16.3 %1.4 % 44.9 %
159.9%
21
Fastest Execution*
LLAP
78.64
Presto
103.60
Tez
105.21
1
BEST CUMULATIVE AVG. QUERY TIMES 1TB TPC-DS
(IN MINUTES)
24 % 25 %
Smaller is better
22
Wins on Query Execution*
LLAP
44
Presto
16
Tez
6
1
TOTAL QUERY WINS BY ENGINE ON 1TB TPC-DS
Larger is better
23
Query Results*
Smaller is better
0.00
100.00
200.00
300.00
400.00
500.00
600.00
700.00
800.00
900.00
1000.00
Q3
Q7
Q12
Q13
Q15
Q17
Q18
Q19
Q20
Q21
Q22
Q24
Q25
Q26
Q27
Q28
Q29
Q31
Q32
Q34
Q39
Q40
Q27
Q28
Q29
Q31
Q32
Q34
Q39
Q40
Q42
Q43
Q45
Q56
Q58
Q60
Q63
Q64
Q65
Q66
Q67
Q68
Q70
Q71
Q72
Q73
Q75
Q76
Q79
Q80
Q82
Q83
Q84
Q85
Q87
Q88
Q89
Q90
Q91
Q92
Q93
Q94
Q95
Q96
Q97
Q98
QUERY EXECUTION TIMES ON 1TB TPC-DS
(IN SECONDS)
LLAP Presto
24
Observations
 Performance tuning engines is still more art than science
 High level of confidence more performance gains out there
 Performance gains are still achievable for memory intensive
engines running lower memory environments
 LLAP and Presto are solid engines and with zero issues
encountered over the several months of testing
 All the engines played well together in our test environment
25
Losers
 Map Reduce SQL workloads
 BZip compressed TEXT and SEQUENCE files
 Spark Thrift Server (temporary)
26
Winners
 Solution for the C-Suite - LLAP
 Runner up is Presto
 Columnar Storage – ORC Zlib
 Runner up is Parquet (no clear compression winner)
27
Questions
Dushyanth Vaddi
dushyanth_vaddi@comcast.com
Michael Fagan
michael_fagan@comcast.com
We are hiring in Colorado!
28
Backup Slides
29
Settings – Spark Thrift Server (Spark)
driver-memory 30g
master yarn
executor-memory 3g
executor-cores 2
num-executors 280
spark.cleaner.ttl=1800s
spark.hadoop.yarn.timeline-service.enabled=false
spark.yarn.executor.memoryOverhead=1024
spark.rpc.askTimeout=2000
spark.sql.broadcastTimeout=60000
spark.kryoserializer.buffer.max=1000m
spark.sql.inMemoryColumnarStorage.compressed=
true
spark.scheduler.mode=FAIR
spark.io.compression.codec=lzf
spark.serializer =
org.apache.spark.serializer.KryoSerializer
spark.sql.crossJoin.enabled=true
spark.yarn.scheduler.heartbeat.interval-ms =
30000000
spark.executor.heartbeatInterval=600s
spark.network.timeout=1200s
spark.dynamicAllocation.enabled=true
spark.dynamicAllocation.initialExecutors=280
spark.dynamicAllocation.maxExecutors=308
spark.dynamicAllocation.minExecutors=280
spark.shuffle.service.enabled=true
spark.kryo.referenceTracking=false
spark.sql.orc.filterPushdown=true
30
Settings – Spark Thrift Server (Hive)
hive.vectorized.execution.enabled=true
hive.cbo.enable=true
hive.merge.mapredfiles=false
hive.merge.mapfiles=true
hive.merge.sparkfiles=true
hive.merge.smallfiles.avgsize=16000000hive.merge.
size.per.task=256000000
hive.auto.convert.join=true
hive.auto.convert.join.noconditionaltask=true
hive.auto.convert.join.noconditionaltask.size=
200000000
hive.optimize.bucketmapjoin.sortedmerge=false
hive.map.aggr.hash.percentmemory=0.5
hive.map.aggr=true
hive.optimize.sort.dynamic.partition=false
hive.stats.fetch.column.stats=true
hive.vectorized.execution.reduce.enabled=false
hive.vectorized.groupby.checkinterval=4096
hive.vectorized.groupby.flush.percent=0.1
hive.compute.query.using.stats=true
hive.limit.pushdown.memory.usage=0.4
hive.exec.reducers.bytes.per.reducer=67108864
hive.smbjoin.cache.rows=10000
hive.fetch.task.conversion=more
hive.fetch.task.conversion.threshold=1073741824
hive.optimize.index.filter=true
hive.optimize.ppd=true

Hadoop Query Performance Smackdown

Editor's Notes

  • #14 Map reduce would have had turned in a faster performance number if it has failed all the tests
  • #16 For the non columar formats Gzip wins the compression
  • #18 Non columnar formats snappy is the winner
  • #20 Total Caching size is 420GB
  • #21 Improvement on the high end of almost 1600 seconds low end of 600 seconds Improvement of over 10 – 26 minutes over the entire run or 9 -24 seconds on average per query