1) The study estimated the incapacitation effect and impact on recidivism of a prolonged incarceration and rehabilitation measure (ISD) for high-frequency offenders, compared to standard short-term imprisonment.
2) Using a quasi-experimental design with observational data, the study found that ISD had an average incapacitation effect of preventing 5.7 criminal cases and 9.2 offenses per offender.
3) Recidivism rates were 12-16% lower for offenders released from ISD compared to similar offenders receiving standard imprisonment, though the effects could not be attributed solely to rehabilitation.
Effectiveness of a prolonged incarcerationand rehabilitation
1. Effectiveness of a prolonged incarceration
and rehabilitation measure for high-frequency offenders
N. Tollenaar & A. M. van der Laan &
P. G. M. van der Heijden
Published online: 8 May 2013
# Springer Science+Business Media Dordrecht 2013
Abstract
Objectives To estimate the incapacitation effect and the impact
on post-release
recidivism of a measure combining prolonged incarceration and
rehabilitation, the
ISD measure for high frequency offenders (HFOs) was
compared to the standard
practice of short-term imprisonment.
Methods We applied a quasi-experimental design with
observational data to study the
effects of ISD. The intervention group consisted of all HFOs
released from ISD in the
period 2004–2008. Two control groups were derived from the
remaining population
of HFOs who were released from a standard prison term. To
form groups of controls,
a combination of multiple imputation (MI) and propensity score
matching (PSM) was
used including a large number of covariates. In order to measure
the incapacitation
effect of ISD, the number of convictions and recorded offences
in a criminal case of
the controls were counted in the same period as their ISD
2. counterfactuals were
incarcerated. The impact on recidivism was measured by the
prevalence and the
frequency of reconvictions corrected for time at risk.
Robustness of the results were
checked by performing a combined PSM and difference-in-
difference (DD) design.
Results The estimate of the incapacitation effect was on average
5.7 criminal cases
and 9.2 offences per ISD measure. On average 2.5 convictions
and 4 recorded
offences per year per HFO are prevented. The HFOs released
from ISD showed 12
to 16 % lower recidivism rates than their control HFOs released
from prison (Cohen’s
J Exp Criminol (2014) 10:29–58
DOI 10.1007/s11292-013-9179-y
N. Tollenaar (*) : A. M. van der Laan
Research and Documentation Centre (WODC), Turfmarkt 131,
2511 DP Den Haag, Netherlands
e-mail: [email protected]
A. M. van der Laan
e-mail: [email protected]
P. G. M. van der Heijden
Utrecht University, Utrecht, Netherlands
e-mail: [email protected]
P. G. M. van der Heijden
University of Southampton, Southampton, UK
h=0.3–0.4). The recidivists of the ISD group also showed a
lower reconviction
frequency than the control group recidivists (Cohen’s d=0.2).
3. Conclusions The ISD measure seems to be effective in reducing
recidivism and
crime. The estimated incapacitation effect showed that a large
portion of criminal
cases and offences was prevented. DD analysis and sensitivity
analyses confirmed the
robustness of the PSM results. Due to the absence of actual
treatment data, the effects
found cannot be attributed separately to resocialization,
imprisonment, or improve-
ment of life circumstances.
Keywords Double difference . Frequent offenders .
Incapacitation . Recidivism .
Propensity score matching
Introduction
Internationally, there has long been interest in the most frequent
and persistent
offenders. In the Netherlands at the beginning of the twenty–
first century, the
Department of Justice developed a focus on the most frequent
offenders. It was
mainly fed by the idea that reducing reoffending specifically of
frequent offenders
would provide a significant reduction of the overall crime level,
a finding long
common in criminology (Wolfgang et al. 1972). Judicial policy
focused on the most
active offenders in the group of frequent offenders, namely the
so-called high-
frequency offenders (HFOs). These were simply defined as
those offenders who were
arrested by the police for committing a crime 11 or more times
4. in the previous
5 years. This group made up 30 % of the yearly population of
suspects, starting as
teenages, had a mean age of 30 years, and on average had 40
previous convictions.
It is plausible that a large overlap exists between the Dutch
HFOs and high-rate
chronic offenders found in the international life-course
research. In various criminal
career studies that used latent trajectory modelling (Nagin and
Land 1993), 5 % of a
cohort of offenders was found to be of some type of high-rate
chronic offender. This type
could clearly be distinguished from the remaining offender
groups by a prolongued
period of frequent offending in their life-course (Blokland et al.
2005; Piquero and
Blumstein 2007; Piquero et al. 2010; Bersani et al. 2009). They
are designated as ‘high-
level chronics’ (Nagin 1999), ‘high-level persisters’ (Blokland
et al. 2005), high-rate
chronics (Sampson and Laub 2003), or high-rate offenders
(Piquero et al. 2010). Their
corresponding conviction frequencies (Lambdas) were found to
be between 1.5 and 3
convictions per year (Blokland et al. 2005; Nagin 1999; Piquero
and Blumstein 2007).
These rates, however, vary with age. Nagin (1999) found the
average conviction rate
amongst the chronic group to decline from age 18 to age 32
from 1.5 to .34, whereas
Sampson and Laub (2003) mentioned that their high-rate
chronic group showed a peak
in their late 30s/early 40s and declined thereafter.
5. Piquero et al. (2010) also discovered a group of short-term
high-frequency (STHF)
offenders in their data. It was characterized by a high peak at
adolescence of 1.5
convictions that quickly declined to a low rate of .2 convictions
in the mid-20s and
going to zero at the beginning of their 30s. This STHF offender
group was found to
be indistinguishable from the long-term low-rate offenders in
their high early child-
hood risk profile, illustrating the difficulty of early
identification.
30 N. Tollenaar et al.
Recent Dutch life-course studies also mention high-rate chronic
offenders (Blokland et
al. 2005; Bersani et al. 2009). Bersani and collegues, for
example, found that 4.2 % of their
offender cohort consisted of chronic offenders. These offenders
showed an average
conviction frequency of 1.8 per year through their 20s and 30s,
followed by a decline in
their late 30s. Dutch HFOs also have a high risk profile. They
were found to have serious
problems in multiple areas of functioning (Jacobs and Essers
2003). These offenders were
typically characterized by addiction to drugs and/or alcohol,
being jobless, and being low
educated. More than half of the group had housing and financial
problems and a third
suffered from psychological or psychiatric problems (Tollenaar
et al. 2007). Others found
that HFOs were arrested on a very regular basis on (minor)
6. acquisitive crimes and
nuisance crimes (see, e.g., Versteegh et al. 2003). The criminal
justice system disposed
of these crimes mainly by a short prison term, ranging from a
few days to 3 months. Upon
release, HFOs tended to commit crimes as frequentl y as before
their prison sentence.
To remediate this frequent cycle of crime and persecution, the
Dutch Ministry of Justice
regulated a severe sanction, the ISD measure (Inrichting voor
Stelselmatige Daders, or
Institution for habitual offenders), by law in late 20041
[Ministerie van Justitie (Ministry of
Justice) 2003]. By this law, a HFO can be sentenced to a
maximum sentence of 2 years
even for a relatively minor offence. The conditions are that, in
the preceding 5 years, the
offender must have had three or more convictions sanctioned by
a community sentence
order, a prison term, or a measure of restraint. In practice, only
suspects with 11 or more
police contacts in 5 years were eligible for placement in the
ISD, i.e. they had to conform
to the HFO definition. Next, for those offenders who are
motivated, treatment and
rehabilitation programs are available. Interventions for
addiction or other behavioral
problems are offered which should lead to committing fewer
crimes after the detention.
The main goals of the ISD are reducing crime by incapacitation
and reducing post-release
recidivism by re-socialization.
There are three aspects that distinguish the ISD measure from a
standard sanction for
7. HFOs. First, there is certainty of sanctioning. The public
prosecutors’ office is provided by
the police with a list of all persons having 11 or more police
contacts in the last 5 years. An
offender who is on this list is told that, after being caught for an
offence, he or she is likely
to be sentenced with an ISD measure for the next offence.
Second, there is a prolonged
incarceration length. The incarceration length is much longer
(up to 2 years) than the
sanction for comparable types of crime (several weeks). And,
third, as a consequence,
there is more time and opportunity to actually rehabilitate the
offender. Moreover,
treatment programs should be offered to motivated offenders.
So, apart from a longer
incarceration period, the ISD measure also contains quasi -
compulsory treatment for
addicted HFOs. These three aspects could have a series of
different effects with regard
to crime reduction. The first one includes a general deterrent
effect, the second a special
deterrent effect and incapacitation effects, whereas the third one
could lead to improve-
ment of life circumstances and abate addiction problems and
result into re-socialization.
In the Netherlands, only one study has been conducted on the
effectiveness of the
ISD measure and its predecessor the SOVon crime (Vollaard
2012). In this study, the
1 The problem of addicted offenders in the Netherlands was
countered earlier with the SOV measure
(Strafrechtelijke opvang verslaafden or Rehabilitation of Drug-
Addicted Offenders Act). This predecessor
8. of the ISD had stricter inclusion criteria and was only applied
on a small scale. Two hundred slots were
created for addicted male habitual offenders without serious
psychiatric disorders. The SOV was merged
into the ISD at the end of 2004.
Effectiveness of a prolonged incarceration 31
effects of both the SOV and the ISD were lumped together. In a
natural experiment,
Vollaard showed a decrease of police-reported specific crime
types, i.e. burglary and
breaking into a car, after introduction of the measures. He used
the fact that both
measures were not implemented in all regions simultaneously.
The study, however,
was on the aggregate level. Therefore, general prevention
effects, incapacitation
effects, and recidivism reduction could not be differentiated.
Moreover, the effect
on individual re-offending of all crime types of HFOs remains
unknown.
The present study aims to estimate the relative effect of the ISD
measure on the
individual level compared to the ‘treatment as usual’, being a
short prison term. The focus
is on both the incapacitation effect of the measure and the
recidivism after release. In the
following sections, we will therefore describe the findings from
recent empirical studies
on incapacitation effects and specific deterrent effects of
(prolonged) incarceration.
Because a large part of the HFO group is addicted to heroin
9. and/or cocaine, we will also
discuss recent research on quasi-compulsory treatment of drug
offenders and drug courts.
Incapacitation effects of prolonged incarceration of HFOs
Most existing research concerning the effect of incarceration
focus on the recidivism
afterwards and do not differentiate incapacitation effects. Those
that do provide an
estimate of the latter are, however, very dependent on the
estimators used, the investi-
gated population, the type of crime, and the source used
(Spelman 2000; Piquero and
Blumstein 2007). Two approaches are possible for estimating an
incarceration effect: a
top–down (macro) or a bottom–up (micro) approach (Spelman
2000). In most bottom–
up approaches, the estimate is either based on the number of
crimes committed in the
period previous to incarceration or on a sample from the general
offender population that
had not been incarcerated. In the first case, it is unclear whether
the assumption that the
annual offending frequency would have been the same if the
offender would not have
been incarcerated. In both cases, the estimates suffer from bias
due to stochastic
selectivity, because those incarcerated are likely to be more
frequent offenders than
those not incarcerated (see, e.g., Piquero and Blumstein 2007).
Both potential issues can be prevented by providing a
counterfactual. The counterfactual
approach was followed by Apel and Sweeten (2010): they
applied a quasi-experimental
10. design using PSM (propensity score matching), thus providing a
between-person counter-
factual. They estimated the incapacitation effect to be 6.1–14.1
self-reported offences per
year prison in youth (13–18 years old) and 4.9–8.4 offences per
year in the age range of 18–
24. Similarly, Owens (2009) estimated the incapacitation effect
on incarceration 23- to 25-
year-olds in a natural experiment by using difference-in-
difference analysis. She found that
the offenders under a more lenient regime, a sentence guideline
resulting in an average
1 year less sentence length, had on average a yearly 2.8 arrests
that would have been
prevented under the stringent regime. As a matter of course,
these incapacitation effects in
the general population of juveniles and young adults will
plainly not generalize to the
(high-)frequency adult offenders.
Wermink et al. (2012) extended the age range to 12–50 years.
Apart from the
between-person counterfactual, they also provided within-
person counterfactuals on
conviction data of first-time imprisonment. For this low risk
group, the incapacitation
effect was estimated to be between .17 and .21 convictions per
year. These estimate
are somewhat downwardly biased because they included
suspended prison sentences
32 N. Tollenaar et al.
in the control group, while they did not have actual prison stay
11. data. An unknown
portion of these is also incapacitated because of breaking
conditions.
The results of these studies may not generalize to the high-
frequency offenders
population for a number of reasons. First, HFOs are in a later
stage of their criminal
career than the offenders in the studies discussed above. The
latter may not have been
not yet be on their peak lambda, and thus give a false
impression of incapacitation
effects later in their career. Secondly, the offense frequency
distribution of imprisoned
offenders is highly skewed (see also Piquero and Blumstein
2007). This implies that
estimates of the incapacitation effect in specific populations
might not generalize to
other offender populations. This holds especially in our case,
where the offenders are
actually selected on their actual offending frequency in the
previous 5 years. In other
words, they have already retrospectively proven to be a high
frequency offender.
Specific deterrent effects of incarceration
The bottom–up studies on specific deterrent effect of
incarceration can be classified in
in two types: (1) the relative effect of an incarceration with
respect to other sanctions,
like a community sentence, and (2) the ‘dose-response’ effect of
incarceration, i.e.
longer prison sentence versus a shorter prison sentence.
Empirical results of both
lines of research are presented below.
12. The relative effect of incarceration versus other sanctions and
specific deterrence
The literature on the effect of incarceration on post-release
recidivism is incon-
clusive (Nagin et al. 2009; Spelman 2000) and mainly considers
general offender
populations. In their extensive overview of the literature, Nagin
et al. (2009)
concluded that most studies with regard to the effects of
incarceration were non-
experimental and that (quasi-)experimental studies hardly exist.
So, drawing clear
conclusions about the effectiveness of incarceration was
difficult. More recently,
however, a few (quasi-)experimental studies on the effect of
incarceration have
been conducted. Wermink et al. (2010) compared community
service (CS) to
imprisonment using PSM. They found CS to have lower
recidivism rates than
imprisonment. This study was, however, limited to the first-time
imprisonment of
offenders aged 18–50. Therefore, the results do not apply to
HFOs as they have
typically already had a long sequence of imprisonments. Bales
and Piquero
(2012) also used a quasi-experimental design to study the
effects of prison as
opposed to community sanction on recidivism rates, within 3
years after release.
Their study compared three methods: exact matching, PSM, and
regression-based
models. They matched on and controlled for demographic and
criminal career
13. covariates. Prison sanctions were found to have a criminogenic
effect compared
to CS.
Both the Wermink et al. and the Bales et al. studies suffer from
the fact that the
propensity scores of the experimental group at the extreme ends
were left out, due to
insufficient common support. This leads to potential problems
with generalizability
because the resulting subset is likely not representative of the
total group. As Cook et
al. (2008) noted, the experimental group should be as intact as
possible to lead to
results comparable to a randomized controlled trial.
Effectiveness of a prolonged incarceration 33
Recently, Cid (2009) estimated the effect of imprisonment
versus suspended sentence
in Spain via regression correction. He found that suspended
sentences lead to less re-
incarceration than prison sentence. He compared offenders on a
binary outcome with
varying observation times using logistic regression. In order to
estimate the effect of
imprisonment over time, it would have been more appropriate to
use survival analysis.
Most recently, both Loeffler (2013) and Nagin and Snodgrass
(2013) estimated the
effect of incarceration on re-arrest rates in natural experiments.
In their research, they
exploited the variation in imprisonment imposition rates among
14. different judges within a
specific county and used judge as an instrumental variable.
Criminal cases were allocated
randomly to judges in both studies. Neither of these studies
found a statistically significant
effect on re-arrest.
Taking the recent literature together, the evidence for a general
effect for all
offenders is contradictory. There might, however, be a
differential effect for different
types of offenders. In their review of differential deterrence
research, Piquero et al.
(2011) concluded that there seems to be heterogeneity in the
response to deterrents
threats with regard to: (1) social bonding, (2) morality, (3)
individual characteristics
like impulsivity, discount rate and self-control, (4)
emotional/pharmacological arous-
al, (5) position in a social network, and (6) decision-making
competence. Individual
offenders differ in sanction threat perception, response to
sanction threat, and re-
sponse to punishment.
The applicability of the results in the aforementioned studies
may be of limited
value to the group of this study, as HFOs have already been
proven not to be deterred
by prison by their large criminal history. However, because they
have mostly under-
gone short prison terms, a prolonged prison term might have a
distinguishable effect.
The dose response effect of incarceration length on recidivism
15. Research on the effects of incarceration length on follow-up
crime is scarce. Gendreau et
al. (1999) found in their meta-analyses that longer prison
sentences were correlated with
higher post-release recidivism. The longer the follow-up time,
the larger the differences in
recidivism levels, so the effect seems to increase with time. A
systematic review by
Spelman (2000) was inconclusive about these effects. In their
recent review of the
literature on the effect of imprisonment on reoffending, Nagin
et al. (2009) found
generally inconclusive evidence with regard to the effect of
prison term length on
recidivism. Only one of two mentioned experimental studies
showed significant effects.
The 17 non-experimental studies they included showed a mix of
criminogenic effects,
preventive effects, and non-significant effects of incarceration
length. Some of these
individual studies even found different results for different
subgroups. A recently pub-
lished study by Snodgrass et al. (2011) found no effect of
sentence length on post-release
recidivism. On the other hand, Meade et al. (2012) found a
curvilinear relationship of time
served with re-arrest: up to 2 years, the odds of re-arrest
increased, whereas additional
incarceration time decreased the odds.
Of specific relevance is a finding by DeJong (1997), who found
that experienced
offenders with few ties with society experienced a longer time
to re-arrest given longer
sentence length. This suggest a specific deterrent effect of
longer sentences for this
16. subgroup. This specific description, experienced with few ties
to society, seems quite
applicable to HFOs.
34 N. Tollenaar et al.
Quasi-compulsory treatment of drug-addicted offenders
Substance abuse can be a causal factor in persistent offending,
and might even
prolong criminal careers that would otherwise have ended
(Sampson and Laub
2003). Recently, a few international reviews have appeared
concerning the
effects of quasi-compulsory treatment of addicted offenders. In
an international
review study of the effects of quasi-compulsory treatment of
addicts on addiction
and crime, Stevens et al. (2005) found that positive effects can
be expected, but
that the designs of the studies do not yet allow conclusions on
the effectiveness
(see also Schaub et al. 2010). Stevens and colleagues arrive d at
the tentative
conclusion that quasi-compulsory treatment reduces addiction
and crime as at
least as well as voluntary treatment (Stevens et al. 2005; Schaub
et al. 2010). In
a systematic review, Mitchell et al. (2006) studied evaluations
of the effects of
quasi-compulsory treatment interventions for addicted detainees
(incarceration-
based drug treatment programs). They included only studies that
compared an
17. experimental with a control group. Quasi-compulsory
interventions appear to be
effective and to lead to lower recidivism rates among the
treatment groups
compared to control groups. The greatest reductions of
recidivism and prevention
of relapse in addiction were found in interventions that had a
therapeutic
environment (see also Lipsey 2009). In their meta-analysis,
Parhar et al. (2008)
found that voluntary treatment had a positive effect on general
recidivism
regardless of whether this was in a custodial setting, whereas
mandatory treat-
ment did not have an effect.
In many countries—including the Netherlands—offenders
addicted to heroin can
participate in an opioid substitution treatment (OST) in prison.
Larney et al. (2012)
found that, as long as participants remained in OST after release
from prison, the
average risk of re-incarceration proved to be 20 % less for the
duration of their OST.
In the United States, drug-addicted offenders may be sent to
drug courts
instead of the traditional justice system. Drug courts supply
intensive treatment,
supervision, testing for drug use, frequent court appearance for
progress assess-
ment, and rewards and punishments for meeting or not meeting
obligations.
Rempel et al. (2012) found that drug courts, consisting of
community-based
treatment and intensive judicial oversight, significantly reduced
18. self-reported
crime.
In their study, Warner and Kramer (2009) compared offenders
who completed a
community-based treatment program for drug-dependent
offenders (RIP/D&A, i.e.
Restrictive Intermediate Punishment/Drugs and Alcohol
treatment) to a random
comparable group traditionally sentenced before implementation
of this program.
After 3 years, the treatment group had a risk of re-arrest that
was 33 % lower than
offenders undergoing probation, state incarceration, or county
jail. However, of-
fenders that dropped out of their treatment had an increased risk
of re-arrest.
In the Netherlands, Koeter and Bakker (2007) conducted an
effect study of the
SOV, the predecessor of the ISD. The SOV was compared to
three control groups: a
regular detention and two quasi-compulsory treatments for
addicted offenders. They
found that, after a regression correction for initial differences in
age, conviction
history, addiction, psychosocial problems, and follow -up time,
the SOV group had
significantly lower self-reported and police-reported recidivism
frequencies.
Effectiveness of a prolonged incarceration 35
Research questions
19. To summarize, the incapacitation effect varies substantially
across previous research.
Previous studies on the deterrent effect of incarceration found
inconclusive results;
however, some recent quasi-experimental studies show mainly
criminogenic effects.
Little is known with regard to the effects of incarceration length
on recidivism, but there
seems to be ample evidence that a prolonged incarceration
length for those with weak
bonds to society seems to have a reducing effect on recidivism.
Finally, quasi-compulsory
treatment for drug addicts seems to have a reducing effect on
recidivism and relapse rates.
In this study, we will investigate the incapacitation effect and
the effect on
recidivism of the ISD measure on the individual level. Firstly,
we estimate the
incapacitation effect of the ISD-measure with respect to
sanctioning as usual, being
mainly short prison terms. Second, we aimed to evaluate the
effects of the ISD
measure on reconviction after release from the institution,
relative to the treatment
as usual. Our research questions were therefore:
1. What is the incapacitation effect of the ISD measure executed
between 2004 and
2008 relative to standard short-term imprisonments for HFOs?
2. Is the ISD measure executed between 2004 and 2008
effective in terms of
reducing recidivism of HFOs compared to standard prison
sanctions?
20. Methods
This study used a quasi-experimental research design with
observational data. The
recidivism of all HFOs released from ISD between 2004 and
2008 was compared to
the recidivism in two control groups of very active offenders
released from a standard
prison sanction. Additionally, we estimated the size of the
incapacitation effect of the
measure compared to a standard prison sanction. In order
minimize selection bias due
to observational data, we applied propensity score matching
(PSM) on a large set of
available covariates that were related to the outcomes.
Outcome measures
In order to estimate the incapacitation effect and the post-
release recidivism, we used
conviction data from the criminal justice system2. We also
counted the number of
recorded offences. A conviction was defined as a valid disposal
by the court or the
public prosecutor. We included motoring offences like leaving
the scene of accident
and driving under influence of alcohol or drugs. Cantonal court
cases (i.e. mis-
demeanors) were not counted. Furthermore, acquittals, technical
judgments, and
technical dismissals were removed. The offences as measured in
conviction data
are an underestimate of the actual crime (Farrington 2013;
Farrington et al. 2007;
Koeter 2004). However, the estimates can serve as a lower
21. bound of the actual
number of offences among HFOs.
2 We also used arrest data of the HFOs. The resulting analyses
yielded approximately the same effect sizes
as those reported in this article and are available upon request
by the first author.
36 N. Tollenaar et al.
Estimation of the incapacitation effect
The incapacitation effect was defined as the number of
convictions and recorded
offences in convictions that have been prevented by
incarcerating HFOs with an ISD
measure. This effect was estimated by establishing the
reconvictions of the counter-
factuals who were released in the exact same period as were the
ISD-subjects. For this
purpose, we only used the simultaneous controls (see later),
because these observa-
tions lay closest in time to the ISD observations. This between-
subjects strategy was
also followed by Sweeten and Apel (2007) and Wermink et al.
(2012).
Recidivism
Reconvictions were used as an indicator of recidivism. We
evaluated the recidivism
both in terms of prevalence and frequency per year free.
Recidivism prevalence is the
probability of a first conviction within a certain follow -up time
22. after release from
penitentiary. The duration is defined as the amount of time
between the date of release
and the minimum date of committing an offense of the offenses
in the criminal case.
Recidivism frequency is the number of reconvictions for any
crime type. The
recidivism frequency was corrected for duration of follow -up
detentions and defined
as the number of convictions per year free.
Analytic strategy
To adjust for a priori differences between the ISD group and
both control groups, a
propensity score matching (PSM; Rosenbaum and Rubin 1983)
was performed using
20 covariates for each control group. We used covariates that
were related to crime of
frequent offenders, including demographics, socio-economic
variables, criminal ca-
reer data, and (problems in) functioning in different areas of
life.
In order to estimate the incapacitation effect of ISD, we used
descriptive analyses
to count the conviction frequencies of the counterfactuals. In
order to estimate the
recidivism prevalence rates, we conducted survival analysis.
The recidivism preva-
lence was calculated using product-limit estimation (Kaplan and
Meier 1958).
Differences in survival were tested with log-rate, Wilcoxon, and
Tarone–Ware tests.
Differences in conviction frequencies were tested with t tests.
23. We used Cohen’s
h and Cohen’s d (Cohen 1988) to portray the effect sizes of
ISD. To further
test the robustness of the results with respect to the method
used, we also
performed a combination of PSM and difference-in-differences
(DD) analysis
(Ashenfelter 1978).
Because the source data contained a substantial amount of
missingness, all anal-
yses were performed within a multiple imputation (MI)
framework. We generated
multiple imputed datasets. The analyses and resulting statistics
were combined using
the rules of Rubin (1987). To test the sensitivity of the results
to the missing data
methods, we additionally performed complete case analysis and
applied the indicator
method for missing values (see “Sensitivity of results to
methods chosen”), and In the
following sections we will succinctly describe the data, the
definition of the groups,
the variables used, the procedure for imputing missing data, the
matching by pro-
pensity scores, and the combination of imputation and PSM.
Effectiveness of a prolonged incarceration 37
Dataset and operalizations
The data were obtained by linking police, public prosecutor’s
office, probation and
imprisonment data on the individual level. This was done for a
24. subset of all suspects
who were identified in the police registration as a HFO.
Linked data
We used four national level data sources:
1. Police data. In order to identify the HFOs from the set of all
suspects, we extracted data
from the recognition service system (i.e.
herkenningsdienstsysteem, HKS). This is a
file on a national level of all local police databases containing
all arrests leading to a
police report of all crime suspects of age 12 years and older per
year. The data are on
the individual level. It includes data on ethnicity, geographical
region, and crime types;
2. Conviction data. These data were extracted from the Dutch
Offender’s Index. This is
an anonymized index of the General Documentation Files
(GDF). It provides a
complete chronological overview of all criminal cases in which
a person is convicted
for a criminal offence. Convictions are registered for persons
from ages 12 and older.
3. Probation data. In order to receive information on the
functioning of the HFOs in
different areas of life, we used probation data extracted from
their client service
system (clientvolgsysteem, CVS). This information is used in
pre-sentence reports,
probation plans with the client, and execution of community
sentence orders. It
contains information on the functioning of the offender with
25. regard to different areas;
4. Prison data. The prison data were extracted from repositories
of the Dutch prison
system (Tenuitvoerlegginsprogramma gevangeniswezen, TULP-
GW). These data
contain the exact dates of entry into and release from prison
from 1996. These data
made it possible to correct recidivism frequencies for time at
risk and to estimate the
incapacitation effect. Unfortunately, we did not have data on
stays in a hospital or
psychiatric care, in which someone is also limited in
committing crimes.
ISD group and the controls
The total dataset was constructed as follows. In the period
2003–2008, the annual cohorts
of suspects having 11 or more antecedents in a 5-year period
was established, the complete
list of HFOs during that period. An additional requirement was
set for the prison control
groups: an offender had to be at least once recognized as an
HFO in the 4 years previous to
release. From this dataset, the ISD group and both control
groups were formed.
The ISD group consisted of all HFOs released from an ISD
measure from 2004
until December 2008. This group contained 558 persons. Four
HFOs were dropped
because of extreme pre-test crime frequencies due to too limited
time at risk, leaving
554 persons in the treatment group. The majority of this group
was released in 2007
26. and 2008. The average consecutive stay in prison was 834 days.
The first control group consisted of all HFOs who were released
from prison
before the introduction of the ISD measure. The historical
control group was selected
from HFOs released from prison between January 2003 and
September 2004. This
historical control group contained 4,092 offenders. Their
average stay in a prison was
38 N. Tollenaar et al.
108 days. This historical control group was used for ruling out
selection effects by
judges imposing ISD measures, because the ISD-measure had
not yet been
implemented. By using this group as a comparison, selection
effects due to judicial
decisions were minimized.
The second control group is a group of HFOs released from
prison in 2007 and
2008, termed the simultaneous control group. This control group
was selected from
all HFOs who were released from detention in 2007 and 2008
and contained 6,652
observations having a mean average incarceration length of 102
days. As this
group was released in approximately the same period as the ISD
group, effects
that, for instance, may have arisen from a selective law
enforcement aimed at
HFOs could be minimized.
27. Covariates
To match the ISD group to both groups of controls, we used 20
covariates which can
be classified into five groups: demographic characteristics,
criminal career features,
socio-economic status variables, characteristics of the
conviction leading to incarcer-
ation or ISD, and functioning in diverse life areas. Demographic
characteristics were
gender, age, and ethnicity, country of birth, and number of
inhabitants of a residential
municipality. It is well known that men are more likely than
women to commit crime
(Steffensmeier and Allan 1996). Another well-known
relationship is the age–crime
curve (Farrington 1986). The frequency to commit crime
increased rapidly from
12 years to the start of the young adult life, and then decreases
(the age–crime curve;
see, for instance, Blokland 2005 for this curve in a Dutch
population). This means
that age effects can be expected.
We had two socio-economic status variables, namely work
status and highest
attended education. Not having a job is related to committing
crime (Van der
Geest 2011). Little or no education increases the likelihood of
committing
crimes (Lochner 2004).
Our criminal career features included age at the time of the first
criminal case, the
number of previous convictions, and the criminal case density.
28. The latter is defined the
number of criminal cases in the criminal career per unit time,
uncorrected for time in
detention. As a proxy of the severity of a criminal career, we
used the average maximum
potential sanction according to Dutch criminal law for a specific
crime type. This covariate
is defined as the maximum possible penalty in the criminal case,
expressed as the number
of days of prison terms. This variable is averaged over all cases
in the criminal career.
Also, characteristics of the case that led to the conviction to an
ISD measure or a
standard sanction, the index case were included. These were age
at the time of the
offence and the judicial district where the case was handled.
The latter requires some
explanation. The ISD cell capacity in the Netherlands was
allocated proportionally to
the local number of HFOs in the municipalities. In the districts
of large cities, there
was more capacity than in other cities. This means that
offenders in the large cities
were more likely to have ISD imposed on them. Additionally,
local prosecution
priorities may also have led to differences in recidivism for
which we want to control.
The matching covariates also involved problems in different life
areas. HFOs on
whom an ISD measure was imposed showed to have significant
problems in several
areas of functioning (Goderie and Lünnemann 2008) which may
affect the impact of
29. Effectiveness of a prolonged incarceration 39
the measure. Therefore, it is important to match individuals in
the control group with
similar problems. The probation CVS data provides data with
regard to differ-
ent areas of functioning. These are physical, psychological,
addiction, relation-
ship, housing, and financial matters. Problems in these life
areas potentially
maintain criminal behavior.
Finally, we also matched on whether a HFO has had a SOV
measure in the past. It
is possible that, having undergone a SOV measure, lowered the
recidivism frequency
(Koeter 2004).
Handling missing data
The probation data suffered from missing data; up to 39 % of
the observations were
missing minimally one value. These missings were mainly
concentrated in the
probation data (i.e. life circumstances). The group with missing
data on these
characteristics differed significantly from the group without
missing data. If we were
to discard all cases with missing data, 39 % of the data would
not be used, possibly
leading to a selective sample of those HFOs that received ISD.
Instead, we decided to
apply multiple imputation (MI) by using the regression
switching approach of van
30. Buuren et al. (1999), which works as follows. In an
initialization step, all missing
values were replaced by random numbers, while the position of
the missing data were
retained in memory. Then, iteratively, for each independent
variable, a regression
analysis was performed by regressing it on the remaining
covariates. From the
resulting equation, P(X1|X2, X3, … Xk), values for X1 were
simulated and
imputed. Then, X2 was regressed on the remaining predictors,
now containing
new values for X1. This process over all covariates was
repeated n times and
resulted in a draw from the multivariate distribution of all Xs.
For our analyses,
five imputations were generated.
Matching by propensity scores
In order to provide a counterfactual for the ISD group,
individuals were matched
using PSM. Instead of matching on the actual characteristics,
individuals were
matched on the probability to be allocated to the ISD group.
Under the assumption
of conditional independence, the treatment effect is simply the
difference
between the two groups on the outcome. Conditional
independence implies
that, after matching, the groups do not differ on unmeasured
characteristics
related to the outcome.
We applied nearest-neighbor matching without replacement and
without a caliper.
31. If there were multiple matches, a random case was selected as
the candidate. After
matching, we asserted whether the matching had succeeded by
comparing the groups
on their covariates. To detect significant differences, t tests
were applied at an alpha
level of 0.05.
Combining MI and PSM
There are many ways to combine MI methods and PSM methods
(Hill et al. 2004).
Hill and colleagues found in their Monte Carlo study that the
combination of
40 N. Tollenaar et al.
separately imputing and matching the data had the least bias and
variance for the
estimate of the treatment effect. In our case, this combined
method was performed as
follows:
1. Generate 5 imputed datasets by means of switching
regression (van Buuren et al.
1999)
2. Estimate a propensity score model on each dataset and match
each ISD subject to
a control subject within these datasets;
3. Calculate covariate balance statistics and intervention
outcome on each imputa-
tion sample;
32. 4. Combine the five effect estimates and balance tests using the
rules of Rubin
(1987).
The outline of our procedure is depicted in Fig. 1.
Difference-in-differences
PSM requires the strong assumption of conditional
independence. Therefore,
residual confounding remains one of the possible threats to the
validity of the
estimate of the treatment effect. In order to test the robustness
of the recidivism
results and relax this assumption, we also performed a
combination of PSM and
double difference or difference-in-differences analysis (DD;
Ashenfelter 1978).
In this method, complete elimination of bias is not assumed, but
instead one
assumes that the slopes of the pre-treatment and post-treatment
effects are the
same, the so-called parallelism assumption. Pre-treatment
measures are manda-
tory in DD, because these are compared with post-matching
measures.
Therefore, the effect could not be estimated on recidivism
prevalence but only
Fig. 1 Schematic representation of the steps involved in
combining MI and PSM
Effectiveness of a prolonged incarceration 41
33. on recidivism frequency. As opposed to the full PSM in the
previous analysis,
this pre-treatment covariate had to be excluded from the
matching.
The analyses were performed in Stata v.10.1. The PSM was
done using the module
psmatch2 v,3.0.0 (Leuven and Sianesi 2003). The MI was
applied using the module
mvis (Royston 2004).
Results
Propensity score matching
Two propensity score models were fitted to the data: one to
combine the ISD
group with the historical control group and one to combine with
the simulta-
neous control group (see Appendix Table 4). To check the
common support
condition, the distribution of the log of the propensity scores
for the two models
were plotted in Fig. 23. It showed complete overlap between the
ISD group and
two control groups. This ensured that a reasonable match could
be found for
each ISD subject.
Background characteristics before and after matching
To test whether the PSM succeeded well, we performed
covariate imbalance tests. For
these tests, differences between ISD and controls were
calculated before and after
34. matching (see Table 1). We will first describe the background
characteristics of the
ISD-group (column ‘ISD group’), and then describe the pre-
match differences to both
control group (columns ‘pre-matching’). Finally, we will review
the balances of the
ISD with the control groups after matching (columns ‘post-
matching’).
Description of the ISD group
The majority of the subjects in the ISD group was male and the
subjects were on
average nearly 40 years old when their ISD measure was
imposed (first column of
Table 1). More than half of the ISD subjects was born in the
Netherlands. More than
half of the ISD subjects was not indigenous. Surinamese and
Moroccans were the
largest ethnic minority groups. For four out of ten HFOs in the
ISD group, the highest
education attained was primary education. Nearly nine in ten
ISD subjects were
unemployed or disabled.
The ISD subjects had an extensive career criminal. Their first
conviction for a
criminal offence was on average at a relatively young age. The
ISD group had an
average of more than 60 criminal convictions of a crime that
had a mean penalty
length in their career of over 4 years (1,557 days). A small part
of the ISD subjects
have undergone a SOV measure in the past. Clearly, the most
frequent offenders were
prioritized in the imposition of the measure in practice.
35. ISD subjects appeared to suffer in various domains of
functioning. Over 80 % of
the ISD subjects was addicted, more than half had housing
problems and almost half
3 The natural log was taken to enhance the visibility of the right
tail of the distribution.
42 N. Tollenaar et al.
had financial problems. Four out of ten ISD subjects had
relationship problems or
psychological problems.
Pre-matching difference between ISD and controls
Before matching, the background characteristics of the ISD
group and both control groups
clearly differed (see Table 1). HFOs in the ISD group were on
average older, were more
often male, and more often lived in one of the four largest (G4)
cities than HFOs in the
control groups. In addition, they had more extensive criminal
careers: they started earlier,
had more convictions on their criminal record, and the average
sentence length of the
criminal cases was higher. Also, relatively more ISD subjects
had had a SOV measure in the
past. The ISD group also showed more problems in several
areas of functioning (addiction,
physical, psychological, and housing) than the control groups.
These results showed clearly
that the HFOs who were sanctioned with an ISD were far more
36. risk-prone than the HFOs
that had a standard prison sentence imposed. Matching was
obviously required.
Matching balance
After the matching, only one statistical significant difference
was found between the ISD
and the controls (see the last column in Table 1). The ISD group
only differed significantly
from the simultaneous control group on the average number of
criminal cases per year free
preceding incarceration. We concluded that after matching the
groups were comparable.
Incapacitation effect
In order to estimate the size of the incapacitation effect of the
ISD measure, the
convictions and recorded offences of the HFOs were counted in
the matched simul-
taneous control group in the period the ISD HFOs were
incarcerated. Because the
subjects in this control group can be seen as the counterfactuals
of the ISD subjects in
terms of background characteristics, and the data span the same
time period, this
yields the incapacitation effect of the ISD measure.
Of the 554 HFOs in the simultaneous control group, 37 (7 %)
did not come into contact
with the judiciary in the period of their ISD counterparts. Those
who were convicted during
that period had 3.211 reconvictions in total (M=5.7 convictions;
SD=4.4). These cases
included 5.097 recorded offences (M=9.2 offences; SD=12.2).
37. The types of recorded
0
10
00
20
00
30
00
40
00
50
00
F
re
q
u
e
n
cy
-20 -15 -10 -5 0
0
1
0
39. log(Propensity score)
ISD Simultaneous control group
Fig. 2 Common support of propensity scores of ISD and control
groups
Effectiveness of a prolonged incarceration 43
Table 1 Pre- and post-matching background characteristics of
ISD and control groups
Pre-matching Post-matching
ISD-group
(n=554)
Historical
controls
2003–2004
(n=4,092)
Simultaneous
controls
2007–2008
(n=6,652)
Historical
controls
2003–2004
(n=554)
Simultaneous
40. controls
2007–2008
(n=554)
Demografic characteristics (in %)
Male 94.0 92.8 94.6 94.2 93.7
Age 39.4 34.5**** 34.6**** 39.7 39.8
Country of birth (OBJD; in %)
Netherlands 58.5 60.1 62.9* 59.8 57.5
Morocco 10.1 9.2 8.1 10.3 10.4
Neth. Antilles and Aruba 7.6 7.2 7.6 7.8 7.8
Surinam 14.8 9.7*** 7.8**** 14.3 16.2
Turkey 1.4 1.7 1.7 1.3 1.2
Other Western 2.9 5.0** 4.8* 2.6 2.6
Other non-Western 4.7 7.1** 6.9* 3.9 4.2
Ethnicity (HKS; in %)
Netherlands 47.8 47.0 46.3 48.8 46.2
Morocco 12.5 12.7 14.2 12.2 12.4
Neth. Antilles and Aruba 7.9 7.8 8.4 8.0 8.2
Surinam 16.4 11.6** 10.9*** 16.1 17.9
41. Turkey 2.5 3.0 3.5 2.3 2.5
Other Western 7.0 8.5 7.9 7.0 6.8
Other non-Western 5.8 9.4*** 8.8** 5.6 6.1
Size of municipality (HKS; in %)
<10.000 0.0 0.3 0.4 0.0 0.0
10.000–50.000 7.6 13.5**** 16.1**** 6.7 6.5
50.000–100.000 10.3 15.4*** 16.6**** 10.0 10.9
100.000–250.000 27.1 29.5 28.9 26.7 28.1
>250.000 inhabitants (G4) 53.6 39.5**** 35.7**** 55.4 53.5
Outside of the Netherlands 1.4 1.9 2.3 1.2 1.0
Education (CVS; in %)
Primary or no education 21.0 21.9 21.4 21.5 21.9
Lower secondary without certificat 42.5 38.9 38.3 42.7 42.0
Lower secondary 17.0 18.7 17.7 16.4 17.5
Medium to higher secondary 8.2 10.6* 12.1** 8.8 7.9
Onbekend 11.3 10.0 10.4 10.7 10.6
Labor (CVS; in %)
(partially) Unemployed/disabled 88.6 84.2** 79.8**** 89.4
89.7
45. Finances 48.8 45.1 46.5 48.2 49.7
*p<0.05; **p<0.01; ***p<0.001; ****p<0.0001
a Estimated
Effectiveness of a prolonged incarceration 45
offences are depicted in Table 2. The majority of offences were
theft (41.6 %). More than
60 % within this category concerned shoplifting. Breaking into
a house or car comprised
9.8 % of the offences, whereas 10.7 % concerned vandalism and
public order crimes.
Speaking in counterfactual terms, 7 % of the HFOs in ISD
would not have had a
new conviction within 2 years if they had been sanctioned with
a standard sanction.
On average, an estimated 5.7 convictions and 9.2 recorded
offences have been
prevented by a single incarceration in the ISD. To make these
estimates more
comparable to estimates from other studies on the incapacitation
effect, we rescaled
these to numbers per year. The incapacitation effects then were
2.5 (SD=1.9)
convictions and 4.0 (SD=3.4) recorded offenses per year of
incapacitation.
Post-release recidivism prevalence
The ISD group showed a significantly lower recidivism
prevalence than both control
groups. The failure curves of recidivism prevalence are depicted
46. in Fig. 3. All three tests
were significant at the .001 level. Two years after release we
found that the ISD group
showed an estimated 16 % less recidivism prevalence compared
to the historical control
group (72 and 88 % recidivated, respectively). After 4 years, the
difference increased to
19 % (75 and 94 % recidivated, respectively). In terms of an
effect size (Cohen’s h), the
differences in prevalence between both groups increased from
‘small’ (Cohen’s h=.42)
2 years after release to ‘moderate’ (Cohen’s h=.55) 4 years after
release. In the domain
of criminology, however, effect sizes this large are rare, so
these effects can be
considered quite substantial (see, e.g., Lipsey 2000).
The differences with the simultaneous group were smaller (Fi g.
3b). Two years
after release, the probability of recidivating was 0.84 for the
HFOs who had a
standard short-term imprisonment, an estimated 12 % more
recidivists than among
those HFOs released from ISD (Cohen’s h=.29).
Post-release recidivism frequency
The ISD group also differed significantly from both control
groups in terms of
frequency of reconvictions and recorded offences per year free.
Table 3 shows the
means and standard deviations of the frequency of reconviction
and recorded
Table 2 Type of recorded offence
in prevented convictionsa
47. aEstimated on the simultaneous
control group
Type of recorded offence Percentage
Breaking into house or car 9.8
Theft 41.6
Other property crime 0.2
Assault and battery 5.5
Vandalism/public order 10.7
Drugs 5.0
Weapons 0.5
Traffic 3.6
Miscellaneous 23.1
46 N. Tollenaar et al.
offences in units per year free. All tests showed statistical
significant differences
between the ISD group and its controls. The effect sizes are
small following statistical
effect size conventions (Cohen’s d<0.3), but are large when it
concern effects for
crime interventions.
48. The differences between ISD and controls were also calculated
for the subset
of those HFOs who did recidivate. By doing this, we could
establish whether
ex-ISD subjects who still recidivated tended to ‘calm down’
compared to their
controls. These tests also showed significant results. This
finding indicates that
the ISD measure seems to reduce recidivism frequency of at
least a part of its
releasees.
Difference-in-differences on recidivism frequency
To test the robustness of the recidivism frequency findings, a
combined PSM and DD
analysis was performed on both control groups. In Fig. 4, the
actual progress is shown
from pre- to post-treatment reconviction frequencies for the ISD
group (dotted lines)
and its controls (straight lines). Due to the PSM, the controls
can be seen as a
counterfactual to the HFO in the ISD group. So if those HFOs
would not be
sanctioned with an ISD measure, a DD analysis assumes that
their progress in
reconviction frequency would be the same as their controls.
This expected progress
is shown in the dotted lines. The difference between the actual
ISD slope of
reconviction frequency and the expectation is an estimate of the
treatment effect of
the ISD group versus the two control groups.
Figure 4a shows pre- and post-test means on the reconviction
frequency of the ISD
49. and historical controls and the expected frequency based on the
slope of the historical
controls. Figure 4b visualizes the same information for the
simultaneous control
group. The mean difference in the expected reconviction
frequency of the ISD group
and the actual post-release frequency in the historical group is
3.3. Relative to the
simultaneous control group, the estimate of the ISD effect is
somewhat larger. The
difference in the expected and observed post-release
reconviction frequency of the
ISD group is 5.8. Using this alternative method, we arrived at
the same conclusion:
compared to standard short-term imprisonment the ISD measure
reduced the amount
of recidivism among HFOs after release.
0
.2
5
.5
.7
5
1
R
e
ci
d
iv
51. iv
is
m
p
ro
b
a
b
ili
ty
0 500 1000 1500
Time in days
ISD Simultaneous control group
95% C.I. 95% C.I.
Fig. 3 Recidivism prevalence of ISD versus the historical and
simultaneous controls. The curves for the
control groups are combined from the imputed datasets. The F
statistics are obtained by combining the five
X2 statistics from the five imputations
Effectiveness of a prolonged incarceration 47
Ta
b
le
69. 48 N. Tollenaar et al.
Sensitivity of results to methods chosen
In order to test the robustness of our results with regard to the
imputations, we also
generated the results using the following methods:
& Complete case analysis: In this analysis, no imputation was
used and nearest-
neighbor matching PSM was performed on listwise deleted
datasets.
& The indicator method. In this method, for each variable with
missing data, an indicator
is created (1 = missing, 0 = nonmissing). The missing value in
the actual variable is
replaced by a zero. Although this method yields biased
regression estimates, it is often
suitable for estimation of the treatment effect (see van Buuren
2012).
& Kernel matching. In this analysis, imputation was used, but
the matching proce-
dure was replaced by Kernel matching with a bandwidth of 0.03.
In this method, a
match is constructed for each subject in the ISD using a
weighted average over
multiple persons in the comparison group (Heckman et al.
1998a; Heckman et al.
1997, 1998b) instead of actual one-by-one matching.
These analyses proved to yield the same results as the analyses
70. shown. The results
therefore seem to be robust to imputation and matching methods
chosen.
Discussion
The ISD measure is a severe penal measure meant to reduce
crime among high frequent
offenders (HFO) through incapacitation and preventing
recidivism. Important aspects of
the ISD are that there is certainty of sanctioning, it contains a
prolonged incarceration up to
2 years, and for those HFOs who are motivated interventions
and rehabilitation are
available. Using a retrospective quasi-experimental design, we
investigated the effective-
ness of the ISD measure compared to that of a standard sanction
for HFOs, mainly a short-
term imprisonment in terms of reduction in (re)conviction and
registered crime. The
incapacitation effect of the ISD with respect to the standard
sanction pattern after
release was shown to be substantial. In addition, the
reconviction rate of a
group of HFOs released from ISD in the period 2004–2008
compared to two
comparable control groups was found to be substantially lower.
0
1
2
3
4
5
6
7
71. 8
9
10
Before incarceration After release
M
e
a
n
c
o
n
vi
ct
io
n
f
re
q
u
e
n
cy
ISD Simultaneous controls Expectation ISD
Treatment
effect
73. n
f
re
q
u
e
n
cy
ISD Historical controls Expectation ISD
Treatment
effect
a b
Fig. 4 Difference-in-difference estimates of the ISD group
(dotted lines) versus the two control groups
(straight lines) on average number of convictions per year free
Effectiveness of a prolonged incarceration 49
Incapacitation effect
Our results showed that, when HFOs are incapacitated in an ISD
institution, a
significant higher number of convictions and recorded offences
is prevented com-
pared with when they received a standard sanction. This study
delivers empirical
evidence with regard to chronic offenders that incapacitation
has a reducing effect on
74. crime (DeLisi and Piquero 2011). Moreover, by using a
counterfactual approach, we
could estimate the size of the incapacitation effect. Taking into
account the time that
the matched counterparts of the ISD subjects in the
simultaneous control group were
included, we estimated an average of 5.7 criminal convictions
that included 9.2
recorded offences.. This boils down to a preventive effect of on
average 2.5 convic-
tions and 4 recorded offenses per chronic offender per year. The
majority of the
recorded offences were related to theft (especially shoplifting).
Other offences related
to burglary from homes or cars, vandalism, and public order
offences.
This is a large incapacitation effect when compared with
estimates at the individual
level in Wermink et al. (2012), that range from .17 to .21
convictions, but is quite similar to
the 2.8 re-arrests per year per person found by Owens (2009).
These studies do, however,
pertain to groups that are not comparable to the HFOs, namely
first-time imprisoned 18–
50 year olds and imprisoned 23–25 year olds, respectively. The
HFOs have been
preselected by the police and public prosecutor on their actual
arrest frequency, namely
at least 11 police contacts in 5 years. This yields a minimal
lambda of 2.2 police contacts
per year before incarceration. Therefore, larger incapacitation
effects can be expected.
Our estimate is probably a large underestimation of the number
of actual committed
75. crimes that have been prevented. It is well known that, in the
judicial chain, the number of
offences are filtered (Farrington 2013; Piquero and Blumstein
2007). We do not know
exactly how large this underestimation is, but previous research
showed that, as the number
of actual offences increases, the likelihood that these facts are
recorded in convictions
decreases (Farrington et al. 2007). In the Netherlands, Koeter
(2004) found that, among a
group of addicted criminals, the number of self-reported
offences was 4–20 times higher
than the offences known to the police, depending on the type of
crime. The only way to
further investigate this is to also conduct research based on data
that do not rely on police or
justice efforts, such as self-reports of offending among high-
level chronic offenders.
Effect on post-release recidivism
Our results showed a statistically significant small effect of the
ISD measure on the
post-release recidivism of its participants, when compared to
standard short impris-
onment for HFOs. This holds for the recidivism prevalence as
well as the frequencies
of reconvictions and recorded offences. Two years after
discharge from the ISD, 72 %
of the offenders were reconvicted compared to 84–88 % of the
HFOs who were
released from a standard short-term imprisonment. A part of
these ISD releasees
might actually have desisted, because instantaneous desistance
was shown to exist in
long follow-up data (Kurlycheck et al. 2012).
76. These results are in line with those of an earlier study on the
effects of the
precursor of the ISD measure, the SOV measure (Koeter and
Bakker 2007).
The SOV measure, however, differed from the ISD with regard
to the inclusion of
offenders. In the SOV, only male addicted HFOs were included
while offenders with
50 N. Tollenaar et al.
serious psychiatric symptoms were excluded. Our results seem
to confirm the results
found by DeJong (1997). The habitual experienced offender
with weak bonds to
conventional society is more susceptible to increased sentence
length.
As we did not have individual level intervention or treatment
data, we cannot
discern treatment from deterrence effects. If rehabilitation had
been the only effective
ingredient of the measure, the results are somewhat surprising
because an important
condition of the What Works approach, namely program
integrity (Lipsey 2009),
seems not to be met. An evaluation of the program integrity of
the ISD (Goderie and
Lünnemann 2008) showed that, until 2008, the measure in
practice was not
implemented as it was intended to be. In particular, psychiatric
care for offenders
77. with psychiatric problems was hardly available, and ISD
convicts having addiction
problems remained untreated throughout the duration of the
measure in detention.
The interventions and training that were offered during their
stay in ISD did not seem
to be aimed at addressing the core problems of its participants
(Goderie and
Lünnemann 2008). Although we had no information about which
inmates received
which interventions or training during the ISD, it is unlikely
that the situation in our
research differed. An alternative explanation for the positive
effects found for the ISD
measure on recidivism of the participants could be the
following. The majority of the
HFOs in the 2004–2008 ISD group were shown to be a very
problematic group with a
risky lifestyle characterized by addiction, unemployment,
mental, relational, and
housing problems. It is conceivable that the prolonged removal
of these offenders
from their habitual environment and placement in prison, where
at least basic care
was provided, could have helped them to overcome some of
their basic problems, at
least for a limited period of time. Daily care and routine in
prison for an extended time
could have helped them to improve their physical and mental
health. This may for
some have had a lasting effect on recidivism after their
detention, at least up to 4 years
after discharge. Another alternative explanation could be that
the prolonged and
certain incarceration of specific chronic offenders motivates
prison staff to invest
78. more in depth in these offenders, as opposed to the standard
short-term imprisonment
where it is mostly certain that the offenders will be released
from prison in a short
period and prison staff effort will be in vain.
Context specific factors
The ISD measure seems to deliver promising results in terms of
incapacitation and
recidivism reduction amongst a group of high-rate chronic
offenders. We are not sure
for several reasons if these results can be generalized to other
countries and other
judicial systems. In the Netherlands, even after a period of
increasingly more punitive
sanctioning causing the imprisonment rates to rise, the actual
lengths of prison terms
are still relatively low. It is conceivable that, in countries that
impose lengthier
imprisonments, a HFO group may not even show up because the
offenders are unable
to obtain convictions that frequently.
Countries can differ considerably on which offenses are counted
as crimes (see,
e.g., Aebi et al. 2010). For example, drug possession and drug
use are not indictable
offenses as opposed to, for example, the U.S.A., so these will
not count as crimes in
the Netherlands. This will work through both in the definition
of the group as in
recidivism and the incapacitation effect. Traffic offenses like
driving without a license,
Effectiveness of a prolonged incarceration 51
79. however, are counted as crimes. So, both the size of the HFO
group, as its recidivism is
dependent on what is counted, and the absence of drug
possession and use crimes will
shrink both the group and the incapacitation effect. The amount
of crime per capita can
also vary substantially. In Europe, the Netherlands holds sixth
place in 2007 on the
number of criminal offenses (Aebi et al. 2010: 37). Another
source of variation across
countries might be the varying amount of supervision and/or
prison aftercare.
Supervision was shown to be negatively correlated with
recidivism (Lund et al. 2012),
specifically with disordered offenders with substance abuse
disorder.
Limitations
Random assignment to the treatment conditions is absent in our
study. So, we cannot
completely rule out alternative explanations for the positive
effects of ISD with regard
to recidivism. However, potential selection bias was minimized
as much as possible.
Furthermore, the research literature describe a number of
conditions to prevent
selection bias in quasi-experimental studies (Cook et al. 2008;
Glazerman et al.
2002). These are:
1. After matching, the intervention group should be as intact as
possible;
80. 2. Initial differences between intervention and control groups
should be minimized;
3. There is matching on geographic proximity of the cases;
4. Matching should be on pre-intervention measures of the
outcome.
All four conditions are covered in our analysis: (1) we used 99
% of those HFOs
who were released from ISD in the period 2004–2008; (2) after
matching, only one
difference remained between the intervention and controls; (3)
the matching covar-
iates contained the municipality of residence and the court
district that persecuted the
HFOs; and (4) we matched on pre-detention conviction
frequency per year free.
A fifth condition mentioned in the literature regarding PSM is
that the number of
covariates should be maximized (see, e.g., Apel and Sweeten
2010). Bales and
Piquero (2012) also found that their model with the maximum
number of covariates
showed the lowest difference in recidivism rates between prison
and the CS group,
suggesting bias reduction. In our study, we used 20 covariates
covering different
domains of functioning related to the outcome and control
groups have been shown to
be equal after matching.
On the other hand, some conditions can exacerbate the bias and
cause large
differences between estimates based on quasi-experimental and
experimental designs
(Cook et al. 2008):
81. 1. Intervention and comparison groups are selected from
different datasets or samples;
2. The n of both groups is limited;
3. Matching only involves demographic variables;
4. There is a large heterogeneity between populations;
5. The assignment of cases to intervention and control groups is
very complex and
unclear.
Our study does not suffer from the first four conditions. The
fifth condition could
be a potential problem because the assignment of HFOs to ISD
follows a multi-stage
52 N. Tollenaar et al.
process. First, each court district makes a list of the tar get
HFOs, then offenders with
the highest priority are selected in a local consultation between
the police, public
prosecutor, and probation. Finally, the judge considers whether
the offender is eligible
for placement in the ISD. To counter this potential assignment
problem, we also
assembled a historical control group that was released from
prison before it was
possible to impose the ISD. The drawback of the latter is that
their time at risk falls in
a different period from the ISD group, making it more
susceptible to temporal
differences in prosecution priorities.
82. Compared to both groups of controls, ISD showed a significant
effect on reconviction
rates. A part of the recidivism reduction may be explained
because of offenders dying
after drug treatment due to an overdose (see, e.g., Dumont et al.
2012). We cannot
exclude this alternative explanation because we did not have
date of death outside the
period of judicial affairs. Nevertheless, this does not explain
why the recidivists of the
ISD group have a lower reconviction frequency.
Finally, our study focused on officially recorded crime.
Registered crime is only a
lower bound of re-offending (see, e.g., Piquero and Blumstein
2007; Farrington 2013).
Conclusion
We conclude that the ISD measure is more effective in terms of
recidivism and has a
substantially larger incapacitation effect than the imposition of
a standard custodial
sentences to high frequency offenders. The effectiveness of
ISD, both in terms of
incapacitation and recidivism, apply to the group of high
frequency offenders in the
period 2004–2008 who were released from an ISD measure.
This group of offenders
is characterized by a risky lifestyle with addiction, lack of
housing, unemployment,
and relational problems. It is plausible that within this extreme
high-risk group,
prolonged incarceration can bring improvements in their
lifestyle, that continues after
release, thus having a prolonged effect on reducing recidivism.
83. It is, however, not
expected that broadening the measure to groups of offenders
with a less problematic
background will show similar effects. Future research should
seek to replicate these
results and focus on finding which components of the ISD
measure contribute to the
effects found.
Appendix
Table 4 Coefficients of propensity score models of the
probability of receiving ISD: ISD versus
historicalor simultaneous controls
ISD vs. historical ISD vs. simultaneous
ISD/ prison β SE z value β SE z value
Sex (male) −0.08 0.21 −0.39 0.22 0.22 1.02
Age 0.15 0.01 11.16**** 0.12 0.01 9.16****
Effectiveness of a prolonged incarceration 53
Table 4 (continued)
ISD vs. historical ISD vs. simultaneous
ISD/ prison β SE z value β SE z value
Country of birth (OBJD)
Netherlands 0 0
85. Lower secondary 0.11 0.16 0.68 0.15 0.16 0.92
Medium to higher secondary −0.03 0.21 −0.12 −0.11 0.21 −0.51
Unknown 0.04 0.19 0.22 −0.05 0.19 −0.29
Werk (CVS) 0.00 0.00 0.00 0.00
(partially) Unemployed/disabled (reference) 0 0
casual employment 0.02 0.22 0.10 −0.09 0.21 −0.44
Employed −0.82 1.10 −0.74 −0.83 1.04 −0.80
Other −0.09 0.23 −0.39 −0.21 0.24 −0.86
Criminal career characteristics
Mean age at first conviction −0.14 0.02 −8.00**** −0.11 0.02
−6.91****
Mean previous convictions −0.02 0.00 −3.94**** −0.02 0.00
−6.00****
Mean conviction density 1.59 0.32 4.99**** 2.85 0.33 8.53****
Mean maximum penalty previous cases 0.00 0.00 7.66**** 0.00
0.00 9.37****
Mean previous convictions before incarceration a 0.08 0.01
8.15**** 0.20 0.01 15.84****
Had SOV (%) −0.34 0.25 −1.40 −0.91 0.26 −3.53
54 N. Tollenaar et al.
References
Aebi, M. F., de Cavarlay, B. A., Barclay, G., Gruszcyńska, B.,
Harrendorf, S., Markku, H., et al. (2010).
European sourcebook of crime and criminal justice statistics –
86. 2010. The Hague: WODC.
Apel, R. J., & Sweeten, G. (2010). Propensity score matching in
criminology and criminal justice. In A.
Piquero & D. Weisburd (Eds.), Handbook of quantitative
criminology (pp. 543–562). New York:
Springer.
Ashenfelter, O. (1978). Estimating the effect of training
programs on earnings. The Review of Economics
and Statistics, 6(1), 47–57.
Table 4 (continued)
ISD vs. historical ISD vs. simultaneous
ISD/ prison β SE z value β SE z value
Court district (in %)
Den Bosch (reference) 0 0
Breda −1.03 0.33 −3.15** −0.92 0.33 −2.76**
Maastricht −0.18 0.33 −0.52 −0.33 0.34 −0.99
Roermond −0.19 0.46 −0.41 −0.25 0.46 −0.55
Arnhem −1.56 0.35 −4.43**** −1.80 0.38 −4.76****
Zutphen 0.18 0.32 0.57 0.23 0.31 0.73
Zwolle-Lelystad −0.99 0.40 −2.46* −1.22 0.41 −2.96**
Almelo −0.51 0.36 −1.41 −0.71 0.38 −1.88
Den Haag −0.36 0.24 −1.46 −0.26 0.25 −1.07
Rotterdam 0.04 0.25 0.18 0.19 0.25 0.76
Dordrecht −0.61 0.40 −1.50 −0.89 0.41 −2.17*
Middelburg −0.24 0.53 −0.46 0.10 0.53 0.19
Amsterdam 0.35 0.24 1.48 0.35 0.24 1.44
87. Alkmaar −0.47 0.42 −1.11 −0.16 0.42 −0.38
Haarlem −0.45 0.32 −1.43 −0.34 0.32 −1.05
Utrecht −0.68 0.27 −2.48* −0.48 0.28 −1.74
Leeuwarden −2.01 0.70 −2.87** −2.59 0.80 −3.25**
Groningen −1.73 0.45 −3.84**** −2.33 0.51 −4.53****
Problem areas (CVS) (yes/no)
Physical −0.14 0.14 −1.01 0.06 0.14 0.41
Psychological/psychiatrical 0.23 0.12 1.90 −0.01 0.12 −0.09
Addiction −0.03 0.14 −0.22 0.24 0.14 1.77
Relations −0.03 0.13 −0.21 0.00 0.13 0.00
Housing 0.27 0.13 2.04* 0.32 0.13 2.44*
Finances 0.01 0.13 0.11 −0.16 0.13 −1.19
Constant −9.68 0.74 −13.12 −11.33 0.78 −14.50
Coefficients and standard errors are combined over five
imputations
*p<0.05; **p<0.01; ***p<0.001; ****p<0.0001
Effectiveness of a prolonged incarceration 55
Bales, W. D., & Piquero, A. R. (2012). Assessing the impact of
imprisonment on recidivism. Journal of
Experimental Criminology, 8(1), 71–101.
Bersani, B. E., Nieuwbeerta, P., & Laub, J. H. (2009).
Predicting trajectories of offending over the life
course: findings from a Dutch conviction cohort. Journal of
Research in Crime and Delinquency, 46,
468–494.
88. Blokland, A. (2005). Crime over the life span. Trajectories of
criminal behavior in Dutch offenders.
Dissertation, University of Leiden
Blokland, A. A. J., Nagin, D. S., & Nieuwbeerta, P. (2005). Life
span offending trajectories of a Dutch
conviction cohort. Criminology, 43, 919–954.
Cid, J. (2009). Is imprisonment Criminogenic? A comparative
study of recidivism rates between prison and
suspended prison sanctions. European Journal of Criminology,
6, 459–480.
Cohen, J. (1988). Statistical power analysis for the behavioral
sciences. Hillsdale: Lawrence
Erlbaum.
Cook, T. D., Shadish, W. R., & Wong, V. C. (2008). Three
conditions under which experiments and
observational studies produce comparable causal estimates: New
findings from within-study compar-
isons. Journal of Policy Analysis and Management, 27, 724–
750.
DeJong, C. (1997). Survival analysis and specific deterrence:
integrating theoretical and empirical models
of recidivism. Criminology, 35, 561–575.
DeLisi, M., & Piquero, A. R. (2011). New frontiers in criminal
careers research, 2000–2011: a state-of-the-
art review. Journal of Criminal Justice, 39, 289–301.
Dumont, D. M., Brockmann, B., Dickman, S., Alexander, N. &
Rich, J. D. (2012). Public health and the
epidemic of incarceration. Annual Review of Public Health,
21(33), 325–339.
89. Farrington, D. P. (1986) Age and crime. In Tonry, M. and
Morris, N. (Eds) Crime andJustice: An Annual
Review of Research, vol 7. Chicago: University of Chicago
Press (pp. 189-250).
Farrington, D. P. (2013). Self-reported versus official
offending. In D. P. Farrington, A. R. Piquero, & W. G.
Jennings (Eds.), Offending from childhood to late middle age:
Recent results from the cambridge study
in delinquent development (pp. 27–37). New York: Springer.
Farrington, D. P., Jolliffe, D., Loeber, R., & Hornish, D. L.
(2007). How many offences are really
committed per juvenile court offender? Victims and Offenders,
2, 227–249.
Gendreau, P., Goggin, C., & Cullen, F. (1999). The effects of
prison sentences on recidivism. A report to the
Corrections Research and Development and Aboriginal Policy
Branch, Solicitor General of Canada.
Ottawa, Ontario: Public Works & Government Services Canada
Glazerman, S., Levy, D. M., & Myers, D. (2002).
Nonexperimental replications of social experiments: A
systematic review. NJ: Mathematica Policy Research.
Goderie, M., & Lünnemann, K. D. (2008). De Maatregel
Inrichting voor Stelselmatige Daders. Utrecht:
Verwey-Jonker Instituut.
Heckman, J., Ichimura, H., Smith, J., & Todd, P. (1998a).
Characterizing selection bias using experimental
data. Econometrica, 66, 1017–1098.
Heckman, J. J., Ichimura, H., & Todd, P. E. (1997). Matching as
90. an econometric evaluation estimator:
evidence from evaluating a job training programme. Review of
Economic Studies, 64, 605–654.
Heckman, J. J., Ichimura, H., & Todd, P. (1998b). Matching as
an econometric evaluation estimator. Review
of Economic Studies, 65, 261–294.
Hill, J. L., Reiter, J. P., & Zanutto, E. L. (2004). A comparison
of experimental and observational data
analyses. In A. Gelman & X. L. Meng (Eds.), Applied Bayesian
modeling and causal inference from
incomplete data perspectives (pp. 51–60). New York: Wiley.
Jacobs, M., & Essers, A. A. M. (2003). De misdaad van de
straat. Op zoek naar achtergrondenvan
veelplegers. Tijdschrift voor Criminologie, 45(2), 140–152.
Kaplan, E. L., & Meier, P. (1958). Nonparametric estimation
from incomplete observations. Journal of
American Statistic Association, 53, 457–481.
Koeter, M. W. J. (2004). Vroeghulp aan verslaafden II: Het
effect van de Vroeghulp Interventie Aanpak op
criminele recidive en verslavingsgedrag. Amsterdam: The
Amsterdam Institute for Addiction
Research.
Koeter, M. W. J., & Bakker, M. (2007). Effectevaluatie van de
strafrechtelijke opvang verslaafden (SOV).
Den Haag: WODC.
Kurlycheck, M. C., Bushway, S., & Brame, R. (2012). Long-
term crime desistance and recidivismpatterns -
Evidence from the Essex County Convicted Felon Study.
Criminology, 50, 71103.
91. Larney, S., Toson, B., Burns, L., & Dolan, K. (2012). Effect of
prison-based opioid substitution
treatment and post-release retention in treatment on risk of re-
incarceration. Addiction, 107,
372–380.
56 N. Tollenaar et al.
Leuven, E., Sianesi, B. (2003). PSMATCH2: Stata module to
perform full Mahalanobis and propensity
score matching, common support graphing, and covariate
imbalance testing. http://ideas.repec.org/c/
boc/bocode/s432001.html.
Lipsey, M. W. (2000). Statistical conclusion validity for
intervention research: A significant (p<.05)
problem. In L. Bickman (Ed.), Validity and social
experimentation: Donald Campbell’s legacy (pp.
101–120). Thousand Oaks: Sage.
Lipsey, M. W. (2009). The primary factors that characterize
effective interventions with juvenile offenders:
A meta-analytic overview. Victims and Offenders, 4, 124–147.
In: M. Tonry (Eds.), Crime & Justice
(pp. 359–505). Chicago: University of Chicago.
Lochner, L. (2004). Education, work and crime: a human capital
approach. International Economic Review,
45(3), 811–843.
Loeffler, C. E. (2013). Does imprisonment alter the life-course?
Evidence on crime and employment from a
natural experiment. Criminology 51. doi:10.1111/1745-
92. 9125.12000.
Lund, C., Forsman, A., Anckarsater, H., & Nilsson, T. (2012).
Early criminal recidivism among mentally
disordered offenders. International Journal of Offender Therapy
and Comparative Criminology, 56,
749–768.
Meade, B., Steiner, B., Makarios, M., & Travis, L. (2012).
Estimating a Dose–response relationship
between time served in prison and recidivism. Journal of
Research in Crime and Delinquency.
doi:10.1177/0022427812458928.
Mitchell, O., Wilson, D. B., & MacKenzie, D. L. (2006). The
effectiveness of incarceration-based drug
treatment on criminal behavior. Campbell Systematic Reviews
no. 2006:11. The Campbell
Collaboration
Nagin, D. S. (1999). Analyzing developmental trajectories: A
semiparametric, group-based approach.
Psychological Methods, 4(2), 139–157.
Nagin, D. S., & Land, K. (1993). “Age, criminal careers, and
population heterogeneity: Specification and
estimation of a nonparametric mixed poisson model.”
Criminology 31, 327–362.
Nagin, D. S. & Snodgrass, G. M. (2013). The effect of
incarceration on reoffending: Evidence from a
natural experiment in Pennsylvania. Journal of Quantitative
Criminology. doi:10.1007/s10940-012-
9191-9.
Nagin, D. S., Cullen, F. T., & Jonson, C. L. (2009).
93. Imprisonment and reoffending. Crime and Justice: A
Review of Research, 38, 115–200.
Owens, E. G. (2009). More time, less crime? Estimating the
incapacitative effect of sentence enhancements.
Journal of Law and Economics, 52, 551–579.
Parhar, K. K., Wormith, J. S., Derkzen, D. M., & Beauregard,
A. M. (2008). Offender coercion in treatment:
a meta-analysis of effectiveness. Criminal Justice and
Behaviour, 35(9), 1109–1135.
Piquero, A., & Blumstein, A. (2007). Does incapacitation
reduce crime? Journal of Quantitative
Criminology, 23, 267–285.
Piquero, A. R., Sullivan, C. J., & Farrington, D. P. (2010).
Assessing differences between short-term, high-
rate offenders and long-term, low-rate offenders. Criminal
Justice and Behavior, 37, 1309–1329.
Piquero, A. R., Paternoster, R., Pogarsky, G., & Loughran, T.
(2011). Elaborating the individual difference
component in deterrence theory. Annual Review of Law and
Social Science, 7(7), 335–360.
Rempel, M., Green, M., & Kralstein, D. (2012). The impact of
adult drug courts on crime and incarceration:
findings from a multi-site quasi-experimental design. Journal of
Experimental Criminology, 8, 165–192.
Rosenbaum, P. R., & Rubin, D. B. (1983). The central role of
the propensity score in observational studies
for causal effects. Biometrika, 70, 41–55.
Royston, P. (2004). Multiple imputation of missing values. The
94. Stata Journal, 4(3), 227–241.
Rubin, D. B. (1987). Multiple imputation for nonresponse in
surveys. New York: Wiley.
Sampson, R. J., & Laub, J. H. (2003). Life-course desisters?
Trajectories of crime among delinquent boys
followed to age 70. Criminology, 41, 555–592.
Snodgrass, G. M., Blokland, A. J., Haviland, A., Nieuwbeerta,
P., & Nagin, D. S. (2011). Does the time
cause the crime? An examination of the relationship between
time served and reoffending in the
Netherlands. Criminology, 49(4), 1149–1194.
Sweeten, G., & Apel, R. J. (2007). Incapacitation: revisiting an
old question with a new method and new
data. Journal of Quantitative Criminology, 23, 303–326.
Schaub, M., Stevens, A., Berto, D., Hunt, N., Kerschl, V.,
McSweeney, T., et al. (2010). Comparing
outcomes of ‘Voluntary’ and ‘Quasi-compulsory’ treatment of
substance dependence in Europe.
European Addict Research, 60, 53–60.
Spelman, W. (2000). What recent studies do (and don’t) tell us
about imprisonment and crime. Crime and
Justice: A Review of Research, 27, 419–494.
Effectiveness of a prolonged incarceration 57
http://ideas.repec.org/c/boc/bocode/s432001.html
http://ideas.repec.org/c/boc/bocode/s432001.html
http://dx.doi.org/10.1111/1745-9125.12000
http://dx.doi.org/10.1177/0022427812458928
http://dx.doi.org/10.1007/s10940-012-9191-9
http://dx.doi.org/10.1007/s10940-012-9191-9
95. Steffensmeier, D., & Allan, E. (1996). Gender and crime.
Toward a gendered theory of female offending. In
Annual Review of Sociology, 22, 459–487.
Stevens, A., Berto, D., Heckmann, W., Kerschl, V., Oeuvray,
K., Van Ooyen-Houben, M. M. J., et al.
(2005). Quasi-compulsory treatment of drug dependent
offenders: an international literature review.
Substance Use & Misuse, 40, 269–283.
Tollenaar, N., Meijer, R. F., Huijbregts, G. L. A. M., Blom, M.,
& el Harbachi, S. (2007). Monitor
Veelplegers. Jeugdige en zeer actieve Veelplegers in Kaart
gebracht. Den Haag: WODC.
van Buuren, S. (2012). Flexible imputation of missing data.
Boca Raton: Chapman & Hall/CRC.
Van Buuren, S., Boshuizen, C., & Knook, L. (1999). Multiple
imputation of missing blood pressure
covariates in survival analysis. Statistics in Medicine, 18, 681–
694.
Van der Geest, V. (2011). Working their way into adulthood.
Delinquency and employment in high-risk
boys to age 32. Dissertation, Free University Amsterdam
van Justitie, M. (2003). Plaatsing in een Inrichting voor
Stelselmatige Daders. Tweede Kamer stukken
(vergaderjaar 2002–2003) TK 28 980 nr. 3. Den Haag: Sdu
Uitgevers.
Versteegh, P., Janssen, J., & Bernasco, W. (2003). Beginners,
doorstromers en veelplegers. Tijdschrift voor
96. Criminologie, 45, 127–139.
Vollaard, B. A. (2012). Preventing crime through selective
incapacitation. The Economic Journal.
doi:10.1111/j.1468-0297.2012.02522.x.
Warner, T. D., & Kramer, J. H. (2009). Closing the revolving
door? Substance abuse treatment as an
alternative to traditional sentencing for drug-dependent
offenders. Criminal Justice and Behavior, 36,
89–109.
Wermink, H., Apel, R., Nieuwbeerta, P., & Blokland, A. J.
(2012). The incapacitation effect of first-time
imprisonment: a matched samples comparison. Journal of
Quantitative Criminology. doi:10.1007/
s10940-012-9189-3.
Wermink, H., Blokland, A., Nieuwbeerta, P., Nagin, D., &
Tollenaar, N. (2010). Comparing the effects of
community service and short-term imprisonment on recidivism:
a matched samples approach. Journal
of Experimental Criminology, 6, 325–349.
Wolfgang, M. E., Figlio, R. M., & Sellin, T. (1972).
Delinaquency in a BirthCohort. Chicago: University of
Chicago Press
Nikolaj Tollenaar is a researcher at the WODC (Research and
Documentation Centre). He is project leader
of the national frequent offender monitor. His research interests
include recidivism prediction models,
criminal careers of chronic offenders, and research
methodology.
André M. van der Laan PhD is a Senior Researcher at the
97. WODC (Research and Documentation Centre)
of the Dutch ministry of Security and Justice. He studied
developmental psychology at the University of
Leiden and took his PhD at the University of Groningen on the
topic of “Defiance and Delinquency”. His
research interests are in developmental and life-course
criminology, criminal careers of chronic offenders
and (explanations of) trends in juvenile crime rates.
Furthermore, he is interested in the effects of juvenile
sanctions and juvenile experiences of judicial sanctions.
Peter G. M. van der Heijden is Professor of Statistics for the
Behavioral and Social Sciences at Utrecht
University and Professor of Social Statistics at University of
Southampton, GB. At Utrecht University he is
head of the Department of Social Sciences, Methodology and
Statistics. For the Ministry of Safety and
Justice he chairs the steering committee on research into
recidivism. He teaches courses on multivariate
analysis and multilevel analysis. He carries out research in
surveys on sensitive questions and in population
size estimation.
58 N. Tollenaar et al.
http://dx.doi.org/10.1111/j.1468-0297.2012.02522.x
http://dx.doi.org/10.1007/s10940-012-9189-3
http://dx.doi.org/10.1007/s10940-012-9189-3
Reproduced with permission of the copyright owner. Further
reproduction prohibited without
permission.
c.11292_2013_Article_9179.pdfEffectiveness of a prolonged
incarceration and rehabilitation measure for high-frequency
offendersAbstractAbstractAbstractAbstractAbstractIntroduction
98. Incapacitation effects of prolonged incarceration of
HFOsSpecific deterrent effects of incarcerationThe relative
effect of incarceration versus other sanctions and specific
deterrenceThe dose response effect of incarceration length on
recidivismQuasi-compulsory treatment of drug-addicted
offendersResearch questionsMethodsOutcome
measuresEstimation of the incapacitation
effectRecidivismAnalytic strategyDataset and
operalizationsLinked dataISD group and the
controlsCovariatesHandling missing dataMatching by
propensity scoresCombining MI and PSMDifference-in-
differencesResultsPropensity score matchingBackground
characteristics before and after matchingDescription of the ISD
groupPre-matching difference between ISD and
controlsMatching balanceIncapacitation effectPost-release
recidivism prevalencePost-release recidivism
frequencyDifference-in-differences on recidivism
frequencySensitivity of results to methods
chosenDiscussionIncapacitation effectEffect on post-release
recidivismContext specific
factorsLimitationsConclusionAppendixReferences
Disclaimer: This is a machine generated PDF of selected
content from our products. This functionality is provided solely
for your
convenience and is in no way intended to replace original
scanned PDF. Neither Cengage Learning nor its licensors make
any
representations or warranties with respect to the machine
generated PDF. The PDF is automatically generated "AS IS"
and "AS
AVAILABLE" and are not retained in our systems. CENGAGE
LEARNING AND ITS LICENSORS SPECIFICALLY
DISCLAIM ANY
99. AND ALL EXPRESS OR IMPLIED WARRANTIES,
INCLUDING WITHOUT LIMITATION, ANY WARRANTIES
FOR AVAILABILITY,
ACCURACY, TIMELINESS, COMPLETENESS, NON-
INFRINGEMENT, MERCHANTABILITY OR FITNESS FOR A
PARTICULAR
PURPOSE. Your use of the machine generated PDF is subject to
all use restrictions contained in The Cengage Learning
Subscription
and License Agreement and/or the Gale OneFile: Criminal
Justice Terms and Conditions and by using the machine
generated PDF
functionality you agree to forgo any and all claims against
Cengage Learning or its licensors for your use of the machine
generated
PDF functionality and any output derived therefrom.
Adolescent transfer, developmental maturity, and adjudicative
competence: an ethical and justice policy inquiry
Authors: Brian G. Sellers and Bruce A. Arrigo
Date: Spring 2009
From: Journal of Criminal Law and Criminology(Vol. 99, Issue
2)
Publisher: Northwestern University, School of Law
Document Type: Article
Length: 20,699 words
Abstract:
Based on the empirical evidence, automatic adolescent transfer
to adult criminal court poses significant
processing, treatment, and recidivism problems for youths,
especially when issues of developmental maturity and
trial fitness are brought to the fore. These concerns
100. notwithstanding, legal tribunals increasingly rely on
mandated waivers (both legislative and prosecutorial) as a basis
to further judicial decision-making whose aim is
punishment for serious juvenile offending and the protection of
society from such future criminality. This
qualitative study examines the prevailing state supreme court
and appellate court opinions on this matter. By
engaging in textual analysis, both the jurisprudential intent that
informs these opinions and the ethical reasoning
by which this intent is communicated are subjected to legal
exegeses. Mindful of how existing strategies such as
commonsense justice, therapeutic jurisprudence, and restorative
justice represent types of psychological
jurisprudence consistent with the philosophy of virtue ethics,
this Article tentatively and provisionally delineates
several policy recommendations for rethinking judicial
decisionmaking on the issue of automatic adolescent
transfer.
I. INTRODUCTION
Various theoretical approaches underscore the education,
training, and research methods of the interdisciplinary law and
psychology field. One key method of inquiry is the law,
psychology, and justice perspective. (1) This method promotes
social
change and action through theory-sensitive psychological
jurisprudence. (2) Psychological jurisprudence refers to
"theories that
describe, explain, and predict law by reference to human
behavior." (3) Thus, as a function of translating theory into
public
policy, psychological jurisprudence tells judges and legislators
how they should make decisions, guided by sensible values and
relevant data that draws attention not merely to what law is, but
to what law ought to be. (4)
101. Within the domain of psychological jurisprudence, several
dominant principles and practices have emerged that attempt to
grow the law-psychology-justice agenda, especially in an effort
to secure what is best for offenders, victims, and the public
more generally. Chief among these principles and practices are
(1) commonsense justice, (2) therapeutic jurisprudence, and
(3) restorative justice. Each of these notions is summarily
discussed below.
The notion of commonsense justice, as developed by Professor
Finkel, evolves from an understanding that while the law has
specified an objective path for society to follow in deciding
guilt or innocence, this path does not always take into account
the
ordinary citizen's notion of what is just and fair. (5) Thus,
commonsense justice attempts to include community sentiment
(the
judgment of the people at large) so that the law's more
subjective character can be honored. (6) Incorporating the legal,
moral,
and psychological reasoning adopted by everyday people
enables the displacement of the (misguided) direction that the
law
sets forth so that more equitable decision-making can be
pursued. This decision-making endeavors to "perfect and
complete
the law." (7)
Therapeutic jurisprudence is "the use of social science to study
the extent to which a legal rule or practice promotes the
psychological and physical well-being of the people it affects."
(8) In other words, therapeutic jurisprudence seeks to
102. understand where and how the law can act as a healing agent.
(9) The aim of this practice is to address both civil disputes (10)
and criminal concerns (11) in mental health law, wherein
salubrious outcomes are based on psychological values and
insights.
(12)
Restorative justice is a form of mediated reconciliation. (13) Its
goal is to repair the harm and suffering that follows in the wake
of interpersonal, organizational, or even global violence. This
type of injury affects the victim, the offender, and the
community
to which all opposing parties belong. (14) Candid disclosures
and humanistic dialogue guide the healing process in which
genuine, meaningful, and, ideally, transformative resolutions
are sought. (15)
Interestingly, although not identified as such, these collective
principles and practices are consistent with virtue-based ethics.
Articulated most explicitly and systematically in Aristotle's
Nichomachean Ethics, (16) this version of moral philosophy
seeks to
promote a type of human excellence that is rooted in reason
whereby one's character is not determined by what one does (for
example, weighing competing interests; endorsing rights, duties,
and obligations) but, instead, is an expression of living
virtuously. (17) The highest purpose of this existence is to
embody eudaimonia (a flourishing or excellence in being),
happiness, or a fulfilled life. Aristotle's inquiry led him to
explore those virtues that most profoundly facilitate such human
flourishing. These are habits of character learned through
practice; these are qualities that become a part of the person
through
regularly exercising their use. (18) Indeed, as Aristotle noted:
"Anything that we have to learn to do we learn by the actual
doing
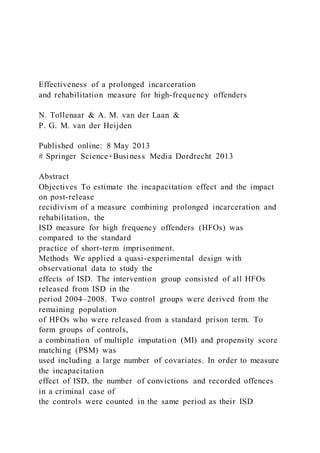
![counterfactuals were
incarcerated. The impact on recidivism was measured by the
prevalence and the
frequency of reconvictions corrected for time at risk.
Robustness of the results were
checked by performing a combined PSM and difference-in-
difference (DD) design.
Results The estimate of the incapacitation effect was on average
5.7 criminal cases
and 9.2 offences per ISD measure. On average 2.5 convictions
and 4 recorded
offences per year per HFO are prevented. The HFOs released
from ISD showed 12
to 16 % lower recidivism rates than their control HFOs released
from prison (Cohen’s
J Exp Criminol (2014) 10:29–58
DOI 10.1007/s11292-013-9179-y
N. Tollenaar (*) : A. M. van der Laan
Research and Documentation Centre (WODC), Turfmarkt 131,
2511 DP Den Haag, Netherlands
e-mail: [email protected]
A. M. van der Laan
e-mail: [email protected]
P. G. M. van der Heijden
Utrecht University, Utrecht, Netherlands
e-mail: [email protected]
P. G. M. van der Heijden
University of Southampton, Southampton, UK
h=0.3–0.4). The recidivists of the ISD group also showed a
lower reconviction
frequency than the control group recidivists (Cohen’s d=0.2).](data:image/gif;base64,R0lGODlhAQABAIAAAAAAAP///yH5BAEAAAAALAAAAAABAAEAAAIBRAA7)