SlideShare a Scribd company logo
1 of 1
Download to read offline
Elaborado por Luis Damian
MANAGEMENT DASHBOARD AMGEN SA - MAYO - UNISON JUNIO 2015
FINANCE AMGEN - FARMA + CONSUMO AMGEN - TRADE
Real
2015
Real
2015
Plan Plan
Real
2014
Real
2014
TOTAL vs PLAN GRW TRADE vs PLAN
Net Sales -3 2 Net Sales -7
Gross
Margin
-10 4
Gross
Margin
14
Op. Profit 2.4 3 Op. Profit 11
VNETAS-T
Tot Canal
GSK TOPS BRANDS £ +,000 YEAR-TO-DATE DISTRIBUCION VTAS BY CHANNEL - YTD COGNOS GROW YTD BY CHANNEL YTD - COGNOS
Unison
Code
GROW %
R03
815
5%
M05 968 -1%
J01 114 27%
R03
811 16%
J01
832 25%
R03 814 -24%
857 -33%
D07 385 6%
J01 210 -6%
P01 113 -26%
J05 851 71%
R01 906 13%
N03 715 60%
G04 292 25%
N06 171 3%
RANK LABS ( Sell In) MARKET TOOLS
YTD SALES IMS by ORIGIN
RK RK LABORATPRECIO VOL NUEVOS
0 1. ETI SLCV3.2% 0.5% 2.9%
1. 2. RECALCINE5.4% 0.7% 0.8%
2. 3. MEDIFARMA12.8% -6.2% 2.3%
3. 4. ROEMMERS0.3% 2.4% 2.2%
4. 5. TEVA 15.8% -38.2% 1.2%
5. MERCK 6.0% 14.1% 9.1%
6. YTD SALES IMS by TYPE - BRANDS / GENERICS BAGO 2.1% 3.4% 2.1%
7.
Grow
Brand
%
Bran
d
%
Gen PFIZER-1.1% 7.6% 2.8%
8. 4 88% 12% TECNOFARMA-0.6% -1.9% 3.4%
9. 6 94% 6% SANOFI2.2% 13.0% 2.9%
10. 6 93% 7% MERCK SHARP9.8% 0.7% 0.3%
13. Genericos crecen 5.5 veces mas que las Marcas en el Mcdo Relev AMGEN0.0% 1.0% 0.0%
Market Share Tendency SALE FORCE ACTIVITIES
* Objetivo real Coverage 95%
29 30 31 32 33 34 35 36 37 38 39 40 41 42 43 44 45 46 47 48 49 50
MAT ago-13MAT sep-13 MAT oct-13MAT nov-13MAT dic-13MAT ene-14MAT feb-14MAT mar-14MAT abr-14MAT may-14MAT jun-14MAT jul-14MAT ago-14MAT sep-14MAT oct-14MAT nov-14MAT dic-14MAT ene-15MAT feb-15MAT mar-15 MAT abr-15MAT may-15 Ciclo 1Ciclo 2Ciclo 3Ciclo 4 Ciclo 5Ciclo 6
0.0 2.8% 2.8% 2.8% 2.8% 2.8% 2.8% 2.8% 2.8% 2.8% ### 2.8% 2.7% 2.7% ### 2.8% 2.9% 2.9% 2.9% 2.9% 3.0% 3.0% Cob%84% 86% ## 90% 92% 93%
55.2 55.3 56.1 56.5 57.2 55.9 55.5 56.3 56.1 55.1 ### 53.7 53.3 52.7 51.7 52.7 51.0 53.0 54.0 55.0 55.5 56.8 ACD 578 597 ## 616.65 625 647
LABORATGSK M.Share % GSK
MSH.%VTA LC MCDO ETICO SLCV
MCDO
ETIC SLCV18 ETIC SLCV 6 ETIC SLCV 9
GSKSL
Grw GSK17 Grw GSK -6 Grw GSK 3
EVOL 99 EVOL 89 EVOL 95
Rx % Excly.
(D10A,D06A)
10.6
10.8
2.3%
# Reps. + D.
M
79
53
-33
Sales by
Reps
280.3
416.4
49
CAPON
6 -7 2 -41 -250% 18% 21% 6% 6%
AMGEN 25,069 3.0% 1.0 95
Grw Gen
19.4
12.1
14.8
LC-MILLION GENERICS
712
310
119
AMGEN
RESTO
Grand Total
24.7
39.1
63.9
BRAND
173.7
621.2
794.9
YTD ,000
36
36
-140
-8
430
13
111
376
354
435-38
-130
247
52 746
RIZOLD
ACTUAL
MTH
446
85
-104
-99
PY YTD-
14
928
609
320
INSIGHT
Actual -
PLAN £
813
406
399 407
PLAN
YTD 15
972 1,076
605 704
ACTUAL
YTD 15
-16
64
49
-9
Actual -
PLAN £
56
-14
-16
558 522
326 290
238 378
320
865
1%
€ 1,475 8%
ene-15 feb-15 mar-15
311
90%
jun-15
2,990
81%
984 902
YTD 2014
16,000
2,426 11,050
YTD REAL
2015
89% 103%78%
€ 1,581
9,405 10,070
abr-15 may-15
2,862
50%
mar-15
16,271
jun-15
84% 81% 78% 69%
YTD REAL
2015
YTD PLAN
2015
1,639 1,259 1,812 1,452 1,653 1,590
abr-15 may-15
2,753
33,272
613 1,080 826 4,716
TOTAL JUN 2015
11,000
€ 2,990
ene-15
2,840
92%
1,984
TRADE JUN
2015
YTD PLAN
2015
16,800
81%
11,3161,311
2,552
82%
€ 1,590 
3.9% 7.5 101
3.6% 9.3
OTHERS
LATINAMERICAN
-0.8 93
103
29.2
PLAN MTH
183
100
32
146
87
15.8
AMGEN TOPS BRANDS

EMBREL
TEMOZOL
REUMAF
PRAXED
-2%
feb-15
€ 3,050
267 121
2,274
1,613
84%
2,080
MERCK SHARP
AGAR
3.1% 10.8
858,724
SHR % GROW EVOL
121
494KETOMIX
RILUSOL
MERCK
29
80
102
4.9 99
-27
3
50
1822
83
AMAROL
FLEXAMIX
VINKEVIR
IMATIOL
REPRIVIR
TAZADIR
77
24
TOP
BRANDS
73
239
18
47
44
28
119
48
56
141
4,238
3%
40% 84%
112
31
31
120
448
808 795
PRIVATE
INST.
29%
15%
62%
99%
1,902
€ 2,900
383
308 315
-5
59
170
366
97
271 401
165
71
30
1
-12
410
-7
DIST.
10%
0%
59%
77%
49%
89%
5%
77%
60%
47%
42%
62%
63%
55%
35%
17%
6%
44%
CHAINS
50%
11%
38%
0%
0%
23%
8%
13%
12%
15%
55%
13%
36%
0%
1%
23%
23%
38%
3%
25%
24%
10%
38%
20%
0%
4%
7%
0%
0%
0%
0%
0%
0%
0%
0%
7%
11%
7%
PUBLIC
INST.
5%
HBO
5%
54%
0%
0%
0%
0%
9%
0%
5%
0%
0%
0%
0%
CHAINS DIST.
PRIVATE
INST.
PUBLIC
INST.
HBO
-1 -22 -16 -54 -21
-37 65 35 30 1
22 -32 29 -70 0
26 7 -8 -35 0
18 -19 23 0 0
32 11 60 0 0
27 -13 1 -101 264
-6 -27 -35 0 0
-18 -51 -3 0 0
29 43 61 4 20
-100 -6 28 0 0
7 322 -16 -82 -23
31 -35 36 -30 0
-19 -23 -2 0 0
33,568
-21.4 74
NATIONALS
AMERICANAS
-19.0
858,724
220,263 25.7
21.0
6.2
49,447
44,454
164,937
53,104
-11
TOP TEN LABS
MCDO ETIC SLCV
RECALCINE
MEDIFARMA
ROEMMERS
17 1,512 -2 -1001%-5127 3%
GROWYTD ,000
5.8% 3.8
4 122
6.5%
6.3%
55,883
54,267
PFIZER
DECITAB
5.9
SHR %
28.0
SANOFI
TEVA
BAGO
TECNOFARMA
8.8
19.2
MKT BY ORIGIN
180,114
240,307EUROPEANS
6.7 100
6.4
10.6
15.0
5.2%
3.9%
100.0
22,067
22,140
Sell In - PMP
S/. +000
Productivity Sale Force
YTD ~ 05/2014
YTD ~ 05/2015
30,994
30,618
29,757
26,977
3.6%
3.5% 18.0 111
104
Growth Productivity per Rep
84%
86%
90.7%
90%
92%
93%
578 597 606 617 625 647
540
560
580
600
620
640
660
80%
82%
84%
86%
88%
90%
92%
94%
96%
Ciclo 1 Ciclo 2 Ciclo 3 Ciclo 4 Ciclo 5 Ciclo 6
No. CallsCob.% Cob% ACD
Average-Call-Day
55,883
54,267
49,447
44,454
33,568
33,272
30,994
30,618
29,757
26,977
25,069
RECALCINE
MEDIFARMA
ROEMMERS
TEVA
MERCK
BAGO
PFIZER
TECNOFARMA
SANOFI
MERCK SHARP
AMGEN
89
95
99
2.81%
3.00%
20.0
25.0
30.0
35.0
40.0
45.0
50.0
55.0
60.0
2.55%
2.60%
2.65%
2.70%
2.75%
2.80%
2.85%
2.90%
2.95%
3.00%
3.05%
Vtas MIO Soles Share %Market Share - ROLLING MAT GSK
0
1,000
2,000
3,000
4,000
5,000
6,000
7,000
0
500
1,000
1,500
2,000
ene-15 feb-15 mar-15 abr-15 may-15
Profit £Sales £
Net Sales Op. Profit
EUROPEANS
28%
AMERICANA
S
26%
LATINAMERI
CAN
19%
OTHERS
6%
240 220
180 165
53
0
50
100
150
200
250
300
350
Mio. LC
3%
5%
13%
0%
16%
6%
2%
-1% -1%
10%
0%
1%
-6%
2%
-38%
14%
3%
8%
-2%
1%2.9% 0.8%
2.3% 2.2% 1.2%
9.1%
2.1% 2.8% 3.4%
0.3%
-50%
-40%
-30%
-20%
-10%
0%
10%
20%
GROW %
EGS ANALYSIS TOP-TEN LABS
PRECIO VOL NUEVOS
0
1,000
2,000
3,000
4,000
5,000
6,000
7,000
8,000
9,000
10,000
0
500
1,000
1,500
2,000
2,500
3,000
3,500
ene-15 feb-15 mar-15 abr-15 may-15
Profit £Sales £
Net Sales Op. Profit
DDD
+1.3
Rx
+2.3%
93.5
Commercial Engine
Coverage Real
+49%
Productivity
-33% Position
Rep
MTH
YTD
MAT
YTD

More Related Content

Similar to Management Dashboard and Financial Report for Amgen SA

Arthur D. Little Automotive Report February 2021
Arthur D. Little Automotive Report February 2021Arthur D. Little Automotive Report February 2021
Arthur D. Little Automotive Report February 2021Fabrizio Arena
 
HeidelbergCement Results 2015
HeidelbergCement Results 2015HeidelbergCement Results 2015
HeidelbergCement Results 2015HeidelbergCement
 
2018 09 Klear - Uncover peer-to-peer lending
2018 09 Klear - Uncover peer-to-peer lending2018 09 Klear - Uncover peer-to-peer lending
2018 09 Klear - Uncover peer-to-peer lendingKLEAR
 
Category Review Mezeluri Jan-Apr 2014
Category Review Mezeluri Jan-Apr 2014 Category Review Mezeluri Jan-Apr 2014
Category Review Mezeluri Jan-Apr 2014 HIPERCOM
 
Valuation of Indian hospitality industry
Valuation of Indian hospitality industryValuation of Indian hospitality industry
Valuation of Indian hospitality industryShivani Chaluvadi
 
HeidelbergCement Trading Statement 2016
HeidelbergCement Trading Statement 2016HeidelbergCement Trading Statement 2016
HeidelbergCement Trading Statement 2016HeidelbergCement
 
'United Kingdom Commercial Radio In Numbers: Q1 2009' by Grant Goddard
'United Kingdom Commercial Radio In Numbers: Q1 2009' by Grant Goddard'United Kingdom Commercial Radio In Numbers: Q1 2009' by Grant Goddard
'United Kingdom Commercial Radio In Numbers: Q1 2009' by Grant GoddardGrant Goddard
 
Retail analytics ASIA workshop_ New perspective on GfK retail analytics
Retail analytics ASIA workshop_ New perspective on GfK retail analyticsRetail analytics ASIA workshop_ New perspective on GfK retail analytics
Retail analytics ASIA workshop_ New perspective on GfK retail analyticsRichard Jo
 
2Q13 Results Presentation
2Q13 Results Presentation2Q13 Results Presentation
2Q13 Results PresentationAluparRI
 
Regional Expenses, Sales & Stock Loss Feedback Example
Regional Expenses, Sales & Stock Loss Feedback ExampleRegional Expenses, Sales & Stock Loss Feedback Example
Regional Expenses, Sales & Stock Loss Feedback ExampleNico-Ed Jacobs
 
SUPPLY CHAIN AND SOURCING_PROCUREMENT RAISING rev 2
SUPPLY CHAIN AND SOURCING_PROCUREMENT RAISING rev 2SUPPLY CHAIN AND SOURCING_PROCUREMENT RAISING rev 2
SUPPLY CHAIN AND SOURCING_PROCUREMENT RAISING rev 2Reinaldo Leopoldo
 
3Q13 Results Presentation
3Q13 Results Presentation3Q13 Results Presentation
3Q13 Results PresentationAluparRI
 
3Q15 Results Presentation
3Q15 Results Presentation3Q15 Results Presentation
3Q15 Results PresentationAluparRI
 

Similar to Management Dashboard and Financial Report for Amgen SA (20)

OFC BUDGET.V5
OFC BUDGET.V5OFC BUDGET.V5
OFC BUDGET.V5
 
Arthur D. Little Automotive Report February 2021
Arthur D. Little Automotive Report February 2021Arthur D. Little Automotive Report February 2021
Arthur D. Little Automotive Report February 2021
 
MRM APRIL 2023.pptx
MRM APRIL 2023.pptxMRM APRIL 2023.pptx
MRM APRIL 2023.pptx
 
HeidelbergCement Results 2015
HeidelbergCement Results 2015HeidelbergCement Results 2015
HeidelbergCement Results 2015
 
2018 09 Klear - Uncover peer-to-peer lending
2018 09 Klear - Uncover peer-to-peer lending2018 09 Klear - Uncover peer-to-peer lending
2018 09 Klear - Uncover peer-to-peer lending
 
Category Review Mezeluri Jan-Apr 2014
Category Review Mezeluri Jan-Apr 2014 Category Review Mezeluri Jan-Apr 2014
Category Review Mezeluri Jan-Apr 2014
 
Valuation of Indian hospitality industry
Valuation of Indian hospitality industryValuation of Indian hospitality industry
Valuation of Indian hospitality industry
 
Monthly Review April-2023.pptx
Monthly Review April-2023.pptxMonthly Review April-2023.pptx
Monthly Review April-2023.pptx
 
Amit Monthly Review Template.pptx
Amit Monthly Review Template.pptxAmit Monthly Review Template.pptx
Amit Monthly Review Template.pptx
 
HeidelbergCement Trading Statement 2016
HeidelbergCement Trading Statement 2016HeidelbergCement Trading Statement 2016
HeidelbergCement Trading Statement 2016
 
'United Kingdom Commercial Radio In Numbers: Q1 2009' by Grant Goddard
'United Kingdom Commercial Radio In Numbers: Q1 2009' by Grant Goddard'United Kingdom Commercial Radio In Numbers: Q1 2009' by Grant Goddard
'United Kingdom Commercial Radio In Numbers: Q1 2009' by Grant Goddard
 
Retail analytics ASIA workshop_ New perspective on GfK retail analytics
Retail analytics ASIA workshop_ New perspective on GfK retail analyticsRetail analytics ASIA workshop_ New perspective on GfK retail analytics
Retail analytics ASIA workshop_ New perspective on GfK retail analytics
 
2Q13 Results Presentation
2Q13 Results Presentation2Q13 Results Presentation
2Q13 Results Presentation
 
PRESENTATION.pptx
PRESENTATION.pptxPRESENTATION.pptx
PRESENTATION.pptx
 
SOHO Package Analysis
SOHO Package AnalysisSOHO Package Analysis
SOHO Package Analysis
 
Regional Expenses, Sales & Stock Loss Feedback Example
Regional Expenses, Sales & Stock Loss Feedback ExampleRegional Expenses, Sales & Stock Loss Feedback Example
Regional Expenses, Sales & Stock Loss Feedback Example
 
SUPPLY CHAIN AND SOURCING_PROCUREMENT RAISING rev 2
SUPPLY CHAIN AND SOURCING_PROCUREMENT RAISING rev 2SUPPLY CHAIN AND SOURCING_PROCUREMENT RAISING rev 2
SUPPLY CHAIN AND SOURCING_PROCUREMENT RAISING rev 2
 
3Q13 Results Presentation
3Q13 Results Presentation3Q13 Results Presentation
3Q13 Results Presentation
 
Modelos Julho
Modelos JulhoModelos Julho
Modelos Julho
 
3Q15 Results Presentation
3Q15 Results Presentation3Q15 Results Presentation
3Q15 Results Presentation
 

Recently uploaded

Effects of Smartphone Addiction on the Academic Performances of Grades 9 to 1...
Effects of Smartphone Addiction on the Academic Performances of Grades 9 to 1...Effects of Smartphone Addiction on the Academic Performances of Grades 9 to 1...
Effects of Smartphone Addiction on the Academic Performances of Grades 9 to 1...limedy534
 
vip Sarai Rohilla Call Girls 9999965857 Call or WhatsApp Now Book
vip Sarai Rohilla Call Girls 9999965857 Call or WhatsApp Now Bookvip Sarai Rohilla Call Girls 9999965857 Call or WhatsApp Now Book
vip Sarai Rohilla Call Girls 9999965857 Call or WhatsApp Now Bookmanojkuma9823
 
PKS-TGC-1084-630 - Stage 1 Proposal.pptx
PKS-TGC-1084-630 - Stage 1 Proposal.pptxPKS-TGC-1084-630 - Stage 1 Proposal.pptx
PKS-TGC-1084-630 - Stage 1 Proposal.pptxPramod Kumar Srivastava
 
Customer Service Analytics - Make Sense of All Your Data.pptx
Customer Service Analytics - Make Sense of All Your Data.pptxCustomer Service Analytics - Make Sense of All Your Data.pptx
Customer Service Analytics - Make Sense of All Your Data.pptxEmmanuel Dauda
 
9654467111 Call Girls In Munirka Hotel And Home Service
9654467111 Call Girls In Munirka Hotel And Home Service9654467111 Call Girls In Munirka Hotel And Home Service
9654467111 Call Girls In Munirka Hotel And Home ServiceSapana Sha
 
High Class Call Girls Noida Sector 39 Aarushi 🔝8264348440🔝 Independent Escort...
High Class Call Girls Noida Sector 39 Aarushi 🔝8264348440🔝 Independent Escort...High Class Call Girls Noida Sector 39 Aarushi 🔝8264348440🔝 Independent Escort...
High Class Call Girls Noida Sector 39 Aarushi 🔝8264348440🔝 Independent Escort...soniya singh
 
Call Girls in Defence Colony Delhi 💯Call Us 🔝8264348440🔝
Call Girls in Defence Colony Delhi 💯Call Us 🔝8264348440🔝Call Girls in Defence Colony Delhi 💯Call Us 🔝8264348440🔝
Call Girls in Defence Colony Delhi 💯Call Us 🔝8264348440🔝soniya singh
 
Building on a FAIRly Strong Foundation to Connect Academic Research to Transl...
Building on a FAIRly Strong Foundation to Connect Academic Research to Transl...Building on a FAIRly Strong Foundation to Connect Academic Research to Transl...
Building on a FAIRly Strong Foundation to Connect Academic Research to Transl...Jack DiGiovanna
 
1:1定制(UQ毕业证)昆士兰大学毕业证成绩单修改留信学历认证原版一模一样
1:1定制(UQ毕业证)昆士兰大学毕业证成绩单修改留信学历认证原版一模一样1:1定制(UQ毕业证)昆士兰大学毕业证成绩单修改留信学历认证原版一模一样
1:1定制(UQ毕业证)昆士兰大学毕业证成绩单修改留信学历认证原版一模一样vhwb25kk
 
From idea to production in a day – Leveraging Azure ML and Streamlit to build...
From idea to production in a day – Leveraging Azure ML and Streamlit to build...From idea to production in a day – Leveraging Azure ML and Streamlit to build...
From idea to production in a day – Leveraging Azure ML and Streamlit to build...Florian Roscheck
 
Data Science Jobs and Salaries Analysis.pptx
Data Science Jobs and Salaries Analysis.pptxData Science Jobs and Salaries Analysis.pptx
Data Science Jobs and Salaries Analysis.pptxFurkanTasci3
 
INTERNSHIP ON PURBASHA COMPOSITE TEX LTD
INTERNSHIP ON PURBASHA COMPOSITE TEX LTDINTERNSHIP ON PURBASHA COMPOSITE TEX LTD
INTERNSHIP ON PURBASHA COMPOSITE TEX LTDRafezzaman
 
꧁❤ Greater Noida Call Girls Delhi ❤꧂ 9711199171 ☎️ Hard And Sexy Vip Call
꧁❤ Greater Noida Call Girls Delhi ❤꧂ 9711199171 ☎️ Hard And Sexy Vip Call꧁❤ Greater Noida Call Girls Delhi ❤꧂ 9711199171 ☎️ Hard And Sexy Vip Call
꧁❤ Greater Noida Call Girls Delhi ❤꧂ 9711199171 ☎️ Hard And Sexy Vip Callshivangimorya083
 
办理学位证纽约大学毕业证(NYU毕业证书)原版一比一
办理学位证纽约大学毕业证(NYU毕业证书)原版一比一办理学位证纽约大学毕业证(NYU毕业证书)原版一比一
办理学位证纽约大学毕业证(NYU毕业证书)原版一比一fhwihughh
 
ASML's Taxonomy Adventure by Daniel Canter
ASML's Taxonomy Adventure by Daniel CanterASML's Taxonomy Adventure by Daniel Canter
ASML's Taxonomy Adventure by Daniel Cantervoginip
 
B2 Creative Industry Response Evaluation.docx
B2 Creative Industry Response Evaluation.docxB2 Creative Industry Response Evaluation.docx
B2 Creative Industry Response Evaluation.docxStephen266013
 
20240419 - Measurecamp Amsterdam - SAM.pdf
20240419 - Measurecamp Amsterdam - SAM.pdf20240419 - Measurecamp Amsterdam - SAM.pdf
20240419 - Measurecamp Amsterdam - SAM.pdfHuman37
 
Beautiful Sapna Vip Call Girls Hauz Khas 9711199012 Call /Whatsapps
Beautiful Sapna Vip  Call Girls Hauz Khas 9711199012 Call /WhatsappsBeautiful Sapna Vip  Call Girls Hauz Khas 9711199012 Call /Whatsapps
Beautiful Sapna Vip Call Girls Hauz Khas 9711199012 Call /Whatsappssapnasaifi408
 
Consent & Privacy Signals on Google *Pixels* - MeasureCamp Amsterdam 2024
Consent & Privacy Signals on Google *Pixels* - MeasureCamp Amsterdam 2024Consent & Privacy Signals on Google *Pixels* - MeasureCamp Amsterdam 2024
Consent & Privacy Signals on Google *Pixels* - MeasureCamp Amsterdam 2024thyngster
 

Recently uploaded (20)

Effects of Smartphone Addiction on the Academic Performances of Grades 9 to 1...
Effects of Smartphone Addiction on the Academic Performances of Grades 9 to 1...Effects of Smartphone Addiction on the Academic Performances of Grades 9 to 1...
Effects of Smartphone Addiction on the Academic Performances of Grades 9 to 1...
 
vip Sarai Rohilla Call Girls 9999965857 Call or WhatsApp Now Book
vip Sarai Rohilla Call Girls 9999965857 Call or WhatsApp Now Bookvip Sarai Rohilla Call Girls 9999965857 Call or WhatsApp Now Book
vip Sarai Rohilla Call Girls 9999965857 Call or WhatsApp Now Book
 
PKS-TGC-1084-630 - Stage 1 Proposal.pptx
PKS-TGC-1084-630 - Stage 1 Proposal.pptxPKS-TGC-1084-630 - Stage 1 Proposal.pptx
PKS-TGC-1084-630 - Stage 1 Proposal.pptx
 
Customer Service Analytics - Make Sense of All Your Data.pptx
Customer Service Analytics - Make Sense of All Your Data.pptxCustomer Service Analytics - Make Sense of All Your Data.pptx
Customer Service Analytics - Make Sense of All Your Data.pptx
 
Deep Generative Learning for All - The Gen AI Hype (Spring 2024)
Deep Generative Learning for All - The Gen AI Hype (Spring 2024)Deep Generative Learning for All - The Gen AI Hype (Spring 2024)
Deep Generative Learning for All - The Gen AI Hype (Spring 2024)
 
9654467111 Call Girls In Munirka Hotel And Home Service
9654467111 Call Girls In Munirka Hotel And Home Service9654467111 Call Girls In Munirka Hotel And Home Service
9654467111 Call Girls In Munirka Hotel And Home Service
 
High Class Call Girls Noida Sector 39 Aarushi 🔝8264348440🔝 Independent Escort...
High Class Call Girls Noida Sector 39 Aarushi 🔝8264348440🔝 Independent Escort...High Class Call Girls Noida Sector 39 Aarushi 🔝8264348440🔝 Independent Escort...
High Class Call Girls Noida Sector 39 Aarushi 🔝8264348440🔝 Independent Escort...
 
Call Girls in Defence Colony Delhi 💯Call Us 🔝8264348440🔝
Call Girls in Defence Colony Delhi 💯Call Us 🔝8264348440🔝Call Girls in Defence Colony Delhi 💯Call Us 🔝8264348440🔝
Call Girls in Defence Colony Delhi 💯Call Us 🔝8264348440🔝
 
Building on a FAIRly Strong Foundation to Connect Academic Research to Transl...
Building on a FAIRly Strong Foundation to Connect Academic Research to Transl...Building on a FAIRly Strong Foundation to Connect Academic Research to Transl...
Building on a FAIRly Strong Foundation to Connect Academic Research to Transl...
 
1:1定制(UQ毕业证)昆士兰大学毕业证成绩单修改留信学历认证原版一模一样
1:1定制(UQ毕业证)昆士兰大学毕业证成绩单修改留信学历认证原版一模一样1:1定制(UQ毕业证)昆士兰大学毕业证成绩单修改留信学历认证原版一模一样
1:1定制(UQ毕业证)昆士兰大学毕业证成绩单修改留信学历认证原版一模一样
 
From idea to production in a day – Leveraging Azure ML and Streamlit to build...
From idea to production in a day – Leveraging Azure ML and Streamlit to build...From idea to production in a day – Leveraging Azure ML and Streamlit to build...
From idea to production in a day – Leveraging Azure ML and Streamlit to build...
 
Data Science Jobs and Salaries Analysis.pptx
Data Science Jobs and Salaries Analysis.pptxData Science Jobs and Salaries Analysis.pptx
Data Science Jobs and Salaries Analysis.pptx
 
INTERNSHIP ON PURBASHA COMPOSITE TEX LTD
INTERNSHIP ON PURBASHA COMPOSITE TEX LTDINTERNSHIP ON PURBASHA COMPOSITE TEX LTD
INTERNSHIP ON PURBASHA COMPOSITE TEX LTD
 
꧁❤ Greater Noida Call Girls Delhi ❤꧂ 9711199171 ☎️ Hard And Sexy Vip Call
꧁❤ Greater Noida Call Girls Delhi ❤꧂ 9711199171 ☎️ Hard And Sexy Vip Call꧁❤ Greater Noida Call Girls Delhi ❤꧂ 9711199171 ☎️ Hard And Sexy Vip Call
꧁❤ Greater Noida Call Girls Delhi ❤꧂ 9711199171 ☎️ Hard And Sexy Vip Call
 
办理学位证纽约大学毕业证(NYU毕业证书)原版一比一
办理学位证纽约大学毕业证(NYU毕业证书)原版一比一办理学位证纽约大学毕业证(NYU毕业证书)原版一比一
办理学位证纽约大学毕业证(NYU毕业证书)原版一比一
 
ASML's Taxonomy Adventure by Daniel Canter
ASML's Taxonomy Adventure by Daniel CanterASML's Taxonomy Adventure by Daniel Canter
ASML's Taxonomy Adventure by Daniel Canter
 
B2 Creative Industry Response Evaluation.docx
B2 Creative Industry Response Evaluation.docxB2 Creative Industry Response Evaluation.docx
B2 Creative Industry Response Evaluation.docx
 
20240419 - Measurecamp Amsterdam - SAM.pdf
20240419 - Measurecamp Amsterdam - SAM.pdf20240419 - Measurecamp Amsterdam - SAM.pdf
20240419 - Measurecamp Amsterdam - SAM.pdf
 
Beautiful Sapna Vip Call Girls Hauz Khas 9711199012 Call /Whatsapps
Beautiful Sapna Vip  Call Girls Hauz Khas 9711199012 Call /WhatsappsBeautiful Sapna Vip  Call Girls Hauz Khas 9711199012 Call /Whatsapps
Beautiful Sapna Vip Call Girls Hauz Khas 9711199012 Call /Whatsapps
 
Consent & Privacy Signals on Google *Pixels* - MeasureCamp Amsterdam 2024
Consent & Privacy Signals on Google *Pixels* - MeasureCamp Amsterdam 2024Consent & Privacy Signals on Google *Pixels* - MeasureCamp Amsterdam 2024
Consent & Privacy Signals on Google *Pixels* - MeasureCamp Amsterdam 2024
 

Management Dashboard and Financial Report for Amgen SA

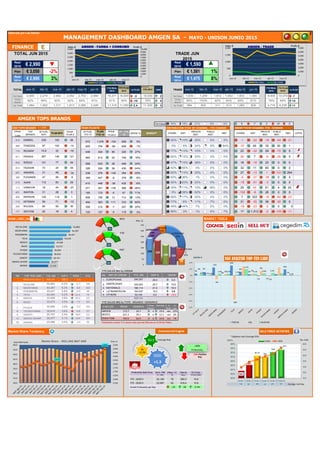
  • 1. Elaborado por Luis Damian MANAGEMENT DASHBOARD AMGEN SA - MAYO - UNISON JUNIO 2015 FINANCE AMGEN - FARMA + CONSUMO AMGEN - TRADE Real 2015 Real 2015 Plan Plan Real 2014 Real 2014 TOTAL vs PLAN GRW TRADE vs PLAN Net Sales -3 2 Net Sales -7 Gross Margin -10 4 Gross Margin 14 Op. Profit 2.4 3 Op. Profit 11 VNETAS-T Tot Canal GSK TOPS BRANDS £ +,000 YEAR-TO-DATE DISTRIBUCION VTAS BY CHANNEL - YTD COGNOS GROW YTD BY CHANNEL YTD - COGNOS Unison Code GROW % R03 815 5% M05 968 -1% J01 114 27% R03 811 16% J01 832 25% R03 814 -24% 857 -33% D07 385 6% J01 210 -6% P01 113 -26% J05 851 71% R01 906 13% N03 715 60% G04 292 25% N06 171 3% RANK LABS ( Sell In) MARKET TOOLS YTD SALES IMS by ORIGIN RK RK LABORATPRECIO VOL NUEVOS 0 1. ETI SLCV3.2% 0.5% 2.9% 1. 2. RECALCINE5.4% 0.7% 0.8% 2. 3. MEDIFARMA12.8% -6.2% 2.3% 3. 4. ROEMMERS0.3% 2.4% 2.2% 4. 5. TEVA 15.8% -38.2% 1.2% 5. MERCK 6.0% 14.1% 9.1% 6. YTD SALES IMS by TYPE - BRANDS / GENERICS BAGO 2.1% 3.4% 2.1% 7. Grow Brand % Bran d % Gen PFIZER-1.1% 7.6% 2.8% 8. 4 88% 12% TECNOFARMA-0.6% -1.9% 3.4% 9. 6 94% 6% SANOFI2.2% 13.0% 2.9% 10. 6 93% 7% MERCK SHARP9.8% 0.7% 0.3% 13. Genericos crecen 5.5 veces mas que las Marcas en el Mcdo Relev AMGEN0.0% 1.0% 0.0% Market Share Tendency SALE FORCE ACTIVITIES * Objetivo real Coverage 95% 29 30 31 32 33 34 35 36 37 38 39 40 41 42 43 44 45 46 47 48 49 50 MAT ago-13MAT sep-13 MAT oct-13MAT nov-13MAT dic-13MAT ene-14MAT feb-14MAT mar-14MAT abr-14MAT may-14MAT jun-14MAT jul-14MAT ago-14MAT sep-14MAT oct-14MAT nov-14MAT dic-14MAT ene-15MAT feb-15MAT mar-15 MAT abr-15MAT may-15 Ciclo 1Ciclo 2Ciclo 3Ciclo 4 Ciclo 5Ciclo 6 0.0 2.8% 2.8% 2.8% 2.8% 2.8% 2.8% 2.8% 2.8% 2.8% ### 2.8% 2.7% 2.7% ### 2.8% 2.9% 2.9% 2.9% 2.9% 3.0% 3.0% Cob%84% 86% ## 90% 92% 93% 55.2 55.3 56.1 56.5 57.2 55.9 55.5 56.3 56.1 55.1 ### 53.7 53.3 52.7 51.7 52.7 51.0 53.0 54.0 55.0 55.5 56.8 ACD 578 597 ## 616.65 625 647 LABORATGSK M.Share % GSK MSH.%VTA LC MCDO ETICO SLCV MCDO ETIC SLCV18 ETIC SLCV 6 ETIC SLCV 9 GSKSL Grw GSK17 Grw GSK -6 Grw GSK 3 EVOL 99 EVOL 89 EVOL 95 Rx % Excly. (D10A,D06A) 10.6 10.8 2.3% # Reps. + D. M 79 53 -33 Sales by Reps 280.3 416.4 49 CAPON 6 -7 2 -41 -250% 18% 21% 6% 6% AMGEN 25,069 3.0% 1.0 95 Grw Gen 19.4 12.1 14.8 LC-MILLION GENERICS 712 310 119 AMGEN RESTO Grand Total 24.7 39.1 63.9 BRAND 173.7 621.2 794.9 YTD ,000 36 36 -140 -8 430 13 111 376 354 435-38 -130 247 52 746 RIZOLD ACTUAL MTH 446 85 -104 -99 PY YTD- 14 928 609 320 INSIGHT Actual - PLAN £ 813 406 399 407 PLAN YTD 15 972 1,076 605 704 ACTUAL YTD 15 -16 64 49 -9 Actual - PLAN £ 56 -14 -16 558 522 326 290 238 378 320 865 1% € 1,475 8% ene-15 feb-15 mar-15 311 90% jun-15 2,990 81% 984 902 YTD 2014 16,000 2,426 11,050 YTD REAL 2015 89% 103%78% € 1,581 9,405 10,070 abr-15 may-15 2,862 50% mar-15 16,271 jun-15 84% 81% 78% 69% YTD REAL 2015 YTD PLAN 2015 1,639 1,259 1,812 1,452 1,653 1,590 abr-15 may-15 2,753 33,272 613 1,080 826 4,716 TOTAL JUN 2015 11,000 € 2,990 ene-15 2,840 92% 1,984 TRADE JUN 2015 YTD PLAN 2015 16,800 81% 11,3161,311 2,552 82% € 1,590  3.9% 7.5 101 3.6% 9.3 OTHERS LATINAMERICAN -0.8 93 103 29.2 PLAN MTH 183 100 32 146 87 15.8 AMGEN TOPS BRANDS  EMBREL TEMOZOL REUMAF PRAXED -2% feb-15 € 3,050 267 121 2,274 1,613 84% 2,080 MERCK SHARP AGAR 3.1% 10.8 858,724 SHR % GROW EVOL 121 494KETOMIX RILUSOL MERCK 29 80 102 4.9 99 -27 3 50 1822 83 AMAROL FLEXAMIX VINKEVIR IMATIOL REPRIVIR TAZADIR 77 24 TOP BRANDS 73 239 18 47 44 28 119 48 56 141 4,238 3% 40% 84% 112 31 31 120 448 808 795 PRIVATE INST. 29% 15% 62% 99% 1,902 € 2,900 383 308 315 -5 59 170 366 97 271 401 165 71 30 1 -12 410 -7 DIST. 10% 0% 59% 77% 49% 89% 5% 77% 60% 47% 42% 62% 63% 55% 35% 17% 6% 44% CHAINS 50% 11% 38% 0% 0% 23% 8% 13% 12% 15% 55% 13% 36% 0% 1% 23% 23% 38% 3% 25% 24% 10% 38% 20% 0% 4% 7% 0% 0% 0% 0% 0% 0% 0% 0% 7% 11% 7% PUBLIC INST. 5% HBO 5% 54% 0% 0% 0% 0% 9% 0% 5% 0% 0% 0% 0% CHAINS DIST. PRIVATE INST. PUBLIC INST. HBO -1 -22 -16 -54 -21 -37 65 35 30 1 22 -32 29 -70 0 26 7 -8 -35 0 18 -19 23 0 0 32 11 60 0 0 27 -13 1 -101 264 -6 -27 -35 0 0 -18 -51 -3 0 0 29 43 61 4 20 -100 -6 28 0 0 7 322 -16 -82 -23 31 -35 36 -30 0 -19 -23 -2 0 0 33,568 -21.4 74 NATIONALS AMERICANAS -19.0 858,724 220,263 25.7 21.0 6.2 49,447 44,454 164,937 53,104 -11 TOP TEN LABS MCDO ETIC SLCV RECALCINE MEDIFARMA ROEMMERS 17 1,512 -2 -1001%-5127 3% GROWYTD ,000 5.8% 3.8 4 122 6.5% 6.3% 55,883 54,267 PFIZER DECITAB 5.9 SHR % 28.0 SANOFI TEVA BAGO TECNOFARMA 8.8 19.2 MKT BY ORIGIN 180,114 240,307EUROPEANS 6.7 100 6.4 10.6 15.0 5.2% 3.9% 100.0 22,067 22,140 Sell In - PMP S/. +000 Productivity Sale Force YTD ~ 05/2014 YTD ~ 05/2015 30,994 30,618 29,757 26,977 3.6% 3.5% 18.0 111 104 Growth Productivity per Rep 84% 86% 90.7% 90% 92% 93% 578 597 606 617 625 647 540 560 580 600 620 640 660 80% 82% 84% 86% 88% 90% 92% 94% 96% Ciclo 1 Ciclo 2 Ciclo 3 Ciclo 4 Ciclo 5 Ciclo 6 No. CallsCob.% Cob% ACD Average-Call-Day 55,883 54,267 49,447 44,454 33,568 33,272 30,994 30,618 29,757 26,977 25,069 RECALCINE MEDIFARMA ROEMMERS TEVA MERCK BAGO PFIZER TECNOFARMA SANOFI MERCK SHARP AMGEN 89 95 99 2.81% 3.00% 20.0 25.0 30.0 35.0 40.0 45.0 50.0 55.0 60.0 2.55% 2.60% 2.65% 2.70% 2.75% 2.80% 2.85% 2.90% 2.95% 3.00% 3.05% Vtas MIO Soles Share %Market Share - ROLLING MAT GSK 0 1,000 2,000 3,000 4,000 5,000 6,000 7,000 0 500 1,000 1,500 2,000 ene-15 feb-15 mar-15 abr-15 may-15 Profit £Sales £ Net Sales Op. Profit EUROPEANS 28% AMERICANA S 26% LATINAMERI CAN 19% OTHERS 6% 240 220 180 165 53 0 50 100 150 200 250 300 350 Mio. LC 3% 5% 13% 0% 16% 6% 2% -1% -1% 10% 0% 1% -6% 2% -38% 14% 3% 8% -2% 1%2.9% 0.8% 2.3% 2.2% 1.2% 9.1% 2.1% 2.8% 3.4% 0.3% -50% -40% -30% -20% -10% 0% 10% 20% GROW % EGS ANALYSIS TOP-TEN LABS PRECIO VOL NUEVOS 0 1,000 2,000 3,000 4,000 5,000 6,000 7,000 8,000 9,000 10,000 0 500 1,000 1,500 2,000 2,500 3,000 3,500 ene-15 feb-15 mar-15 abr-15 may-15 Profit £Sales £ Net Sales Op. Profit DDD +1.3 Rx +2.3% 93.5 Commercial Engine Coverage Real +49% Productivity -33% Position Rep MTH YTD MAT YTD