SlideShare a Scribd company logo
1 of 3
Download to read offline
Ek Pahla Kadam, Take it .. Keep Moving .. Quality Circle
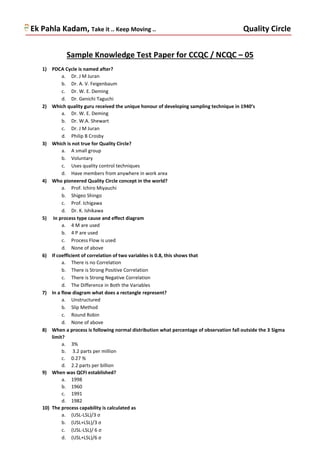
Sample Knowledge Test Paper for CCQC / NCQC – 05
1) PDCA Cycle is named after?
a. Dr. J M Juran
b. Dr. A. V. Feigenbaum
c. Dr. W. E. Deming
d. Dr. Genichi Taguchi
2) Which quality guru received the unique honour of developing sampling technique in 1940’s
a. Dr. W. E. Deming
b. Dr. W.A. Shewart
c. Dr. J M Juran
d. Philip B Crosby
3) Which is not true for Quality Circle?
a. A small group
b. Voluntary
c. Uses quality control techniques
d. Have members from anywhere in work area
4) Who pioneered Quality Circle concept in the world?
a. Prof. Ichiro Miyauchi
b. Shigeo Shingo
c. Prof. Ichigawa
d. Dr. K. Ishikawa
5) In process type cause and effect diagram
a. 4 M are used
b. 4 P are used
c. Process Flow is used
d. None of above
6) If coefficient of correlation of two variables is 0.8, this shows that
a. There is no Correlation
b. There is Strong Positive Correlation
c. There is Strong Negative Correlation
d. The Difference in Both the Variables
7) In a flow diagram what does a rectangle represent?
a. Unstructured
b. Slip Method
c. Round Robin
d. None of above
8) When a process is following normal distribution what percentage of observation fall outside the 3 Sigma
limit?
a. 3%
b. 3.2 parts per million
c. 0.27 %
d. 2.2 parts per billion
9) When was QCFI established?
a. 1998
b. 1960
c. 1991
d. 1982
10) The process capability is calculated as
a. (USL-LSL)/3 σ
b. (USL+LSL)/3 σ
c. (USL-LSL)/ 6 σ
d. (USL+LSL)/6 σ
Ek Pahla Kadam, Take it .. Keep Moving .. Quality Circle
11) A tolerance diagram is also called
a. Scatter diagram
b. Defect concentration diagram
c. Histogram
d. Tier Chart
12) A/K Category of Problem can be solved directly proceeding from QC Problem Solving Step No. ……….?
a. Step No. 03
b. Step No. 05
c. Step No. 08
d. Step No. 09
13) Dr. J M Juran has included which step in Quality Circle 12 Step Problem Solving Methodology?
a. Step No. 4
b. Step No. 7
c. Step No. 9
d. Step No 12
14) What is MODE in a set of Data?
a. The highest value
b. The Middle value
c. The most frequent value
d. None of above
15) Meaning of “GENSOKO” is
a. Real Thing
b. Real Fact
c. Principle
d. Standard & Parameter
16) What should be the recommended number of classes or groups for 450 observations for frequency
distribution for making histogram?
a. 8
b. 9
c. 10
d. 11
17) What is the measure of Central Tendency of a data set
a. Mean
b. Mode
c. Median
d. All above
18) Calculate class interval if least count is 1 gram, number of class are 8 and range is 19 gram
a. 20
b. 10
c. 8
d. 2.5
19) Which control chart is to be made for temperature reading
a. X Bar – R Chart
b. p-chart
c. np-chart
d. U Chart
20) Lean Quality Circle problem solving process having how many steps
a. 5
b. 7
c. 8
d. 12
Compiled by : Dinesh Sharma, e-mail dinesh@ekpahlakadam.com, Mobile +91 9589004005
Date : 28th
Sep 2018
Duration : 20 minutes
Ek Pahla Kadam, Take it .. Keep Moving .. Quality Circle
Sample Knowledge Test Paper for CCQC / NCQC – 05
Answer Sheet
Participant Name: Circle Name:
Q. No. Answer Description Marks
1
2
3
4
5
6
7
8
9
10
11
12
13
14
15
16
17
18
19
20
Total Marks

More Related Content

What's hot (20)

Twelve steps of qc
Twelve steps of qcTwelve steps of qc
Twelve steps of qc
 
Quality Circle Presentation Template
Quality Circle Presentation TemplateQuality Circle Presentation Template
Quality Circle Presentation Template
 
Six sigma quiz
Six sigma quiz Six sigma quiz
Six sigma quiz
 
Root cause analysis training
Root cause analysis trainingRoot cause analysis training
Root cause analysis training
 
DMAIC Methodolgy
DMAIC MethodolgyDMAIC Methodolgy
DMAIC Methodolgy
 
Quality Management Quiz
Quality Management QuizQuality Management Quiz
Quality Management Quiz
 
8D problem solving
8D problem solving8D problem solving
8D problem solving
 
Quality Control Circle
Quality Control CircleQuality Control Circle
Quality Control Circle
 
8 Disciplines (8D) Training
8 Disciplines (8D) Training8 Disciplines (8D) Training
8 Disciplines (8D) Training
 
8D Problem Solving - Automotive Industry
8D Problem Solving - Automotive Industry8D Problem Solving - Automotive Industry
8D Problem Solving - Automotive Industry
 
New Honda Circle
New Honda Circle New Honda Circle
New Honda Circle
 
TQM quiz from IRGST.org
TQM quiz from IRGST.orgTQM quiz from IRGST.org
TQM quiz from IRGST.org
 
The Basics 7 QC Tools - ADDVALUE - Nilesh Arora
The Basics 7 QC Tools - ADDVALUE - Nilesh AroraThe Basics 7 QC Tools - ADDVALUE - Nilesh Arora
The Basics 7 QC Tools - ADDVALUE - Nilesh Arora
 
8D : Problem Solving Methodology
8D : Problem Solving Methodology8D : Problem Solving Methodology
8D : Problem Solving Methodology
 
8D Training, Eight Disciplines Training : Tonex Training
8D Training, Eight Disciplines Training : Tonex Training8D Training, Eight Disciplines Training : Tonex Training
8D Training, Eight Disciplines Training : Tonex Training
 
7 Quality tools by krishna heda
7 Quality tools by krishna heda7 Quality tools by krishna heda
7 Quality tools by krishna heda
 
8D approach to problem solving
8D approach to problem solving8D approach to problem solving
8D approach to problem solving
 
Quality quiz copy
Quality quiz   copyQuality quiz   copy
Quality quiz copy
 
Quality circle
Quality circleQuality circle
Quality circle
 
Quiz 1 - TQM
Quiz 1 - TQMQuiz 1 - TQM
Quiz 1 - TQM
 

Similar to NCQC - Knowledge Test 05

Six Sigma Green Belt - An x and r chart is used to a. indicate process variat...
Six Sigma Green Belt - An x and r chart is used to a. indicate process variat...Six Sigma Green Belt - An x and r chart is used to a. indicate process variat...
Six Sigma Green Belt - An x and r chart is used to a. indicate process variat...Suma Kamadod
 
Six Sigma Green Belt - Which of the following tools is most likely to be orga...
Six Sigma Green Belt - Which of the following tools is most likely to be orga...Six Sigma Green Belt - Which of the following tools is most likely to be orga...
Six Sigma Green Belt - Which of the following tools is most likely to be orga...Suma Kamadod
 
Six Sigma Green Belt - Correction, over production, inventory, and motion are...
Six Sigma Green Belt - Correction, over production, inventory, and motion are...Six Sigma Green Belt - Correction, over production, inventory, and motion are...
Six Sigma Green Belt - Correction, over production, inventory, and motion are...Suma Kamadod
 
Six Sigma Green Belt - A calibrated micrometer was used to take 10 replicated...
Six Sigma Green Belt - A calibrated micrometer was used to take 10 replicated...Six Sigma Green Belt - A calibrated micrometer was used to take 10 replicated...
Six Sigma Green Belt - A calibrated micrometer was used to take 10 replicated...Suma Kamadod
 
Six Sigma Green Belt - Positional, cyclical, and temporal variations are most...
Six Sigma Green Belt - Positional, cyclical, and temporal variations are most...Six Sigma Green Belt - Positional, cyclical, and temporal variations are most...
Six Sigma Green Belt - Positional, cyclical, and temporal variations are most...Suma Kamadod
 
Six Sigma Green Belt - The type of chart that presents the value of items in ...
Six Sigma Green Belt - The type of chart that presents the value of items in ...Six Sigma Green Belt - The type of chart that presents the value of items in ...
Six Sigma Green Belt - The type of chart that presents the value of items in ...Suma Kamadod
 
Six Sigma Green Belt - A sample consists of one or more units of product draw...
Six Sigma Green Belt - A sample consists of one or more units of product draw...Six Sigma Green Belt - A sample consists of one or more units of product draw...
Six Sigma Green Belt - A sample consists of one or more units of product draw...Suma Kamadod
 
Six Sigma Green Belt - In preparation for construction of a cause and effect ...
Six Sigma Green Belt - In preparation for construction of a cause and effect ...Six Sigma Green Belt - In preparation for construction of a cause and effect ...
Six Sigma Green Belt - In preparation for construction of a cause and effect ...Suma Kamadod
 
Six Sigma Green Belt - In analysis of variance, which of the following distri...
Six Sigma Green Belt - In analysis of variance, which of the following distri...Six Sigma Green Belt - In analysis of variance, which of the following distri...
Six Sigma Green Belt - In analysis of variance, which of the following distri...Suma Kamadod
 
Six Sigma Green Belt - A control plan is designed to do which of the followin...
Six Sigma Green Belt - A control plan is designed to do which of the followin...Six Sigma Green Belt - A control plan is designed to do which of the followin...
Six Sigma Green Belt - A control plan is designed to do which of the followin...Suma Kamadod
 
Six Sigma Green Belt - Which of the following tools would be most appropriate...
Six Sigma Green Belt - Which of the following tools would be most appropriate...Six Sigma Green Belt - Which of the following tools would be most appropriate...
Six Sigma Green Belt - Which of the following tools would be most appropriate...Suma Kamadod
 
Six Sigma Green Belt - The following is a sample data set. 10 8 8 6 5 what is...
Six Sigma Green Belt - The following is a sample data set. 10 8 8 6 5 what is...Six Sigma Green Belt - The following is a sample data set. 10 8 8 6 5 what is...
Six Sigma Green Belt - The following is a sample data set. 10 8 8 6 5 what is...Suma Kamadod
 
Six Sigma Green Belt - Which of the following is a good tool for planning cyc...
Six Sigma Green Belt - Which of the following is a good tool for planning cyc...Six Sigma Green Belt - Which of the following is a good tool for planning cyc...
Six Sigma Green Belt - Which of the following is a good tool for planning cyc...Suma Kamadod
 
Six Sigma Green Belt - At what stage of the problem solving process would a t...
Six Sigma Green Belt - At what stage of the problem solving process would a t...Six Sigma Green Belt - At what stage of the problem solving process would a t...
Six Sigma Green Belt - At what stage of the problem solving process would a t...Suma Kamadod
 
Six Sigma Green Belt - In measurement system analysis, which of the following...
Six Sigma Green Belt - In measurement system analysis, which of the following...Six Sigma Green Belt - In measurement system analysis, which of the following...
Six Sigma Green Belt - In measurement system analysis, which of the following...Suma Kamadod
 
Six Sigma Green Belt - Which of the following statistics would best describe ...
Six Sigma Green Belt - Which of the following statistics would best describe ...Six Sigma Green Belt - Which of the following statistics would best describe ...
Six Sigma Green Belt - Which of the following statistics would best describe ...Suma Kamadod
 
Six Sigma Green Belt - The least informative of the four measurement scales i...
Six Sigma Green Belt - The least informative of the four measurement scales i...Six Sigma Green Belt - The least informative of the four measurement scales i...
Six Sigma Green Belt - The least informative of the four measurement scales i...Suma Kamadod
 
Six Sigma Green Belt - Specification limits are derived from which of the fol...
Six Sigma Green Belt - Specification limits are derived from which of the fol...Six Sigma Green Belt - Specification limits are derived from which of the fol...
Six Sigma Green Belt - Specification limits are derived from which of the fol...Suma Kamadod
 
Six Sigma Green Belt - The fraction of nonconforming products is plotted on w...
Six Sigma Green Belt - The fraction of nonconforming products is plotted on w...Six Sigma Green Belt - The fraction of nonconforming products is plotted on w...
Six Sigma Green Belt - The fraction of nonconforming products is plotted on w...Suma Kamadod
 
Six Sigma Green Belt - The overall ability of two or more operators to obtain...
Six Sigma Green Belt - The overall ability of two or more operators to obtain...Six Sigma Green Belt - The overall ability of two or more operators to obtain...
Six Sigma Green Belt - The overall ability of two or more operators to obtain...Suma Kamadod
 

Similar to NCQC - Knowledge Test 05 (20)

Six Sigma Green Belt - An x and r chart is used to a. indicate process variat...
Six Sigma Green Belt - An x and r chart is used to a. indicate process variat...Six Sigma Green Belt - An x and r chart is used to a. indicate process variat...
Six Sigma Green Belt - An x and r chart is used to a. indicate process variat...
 
Six Sigma Green Belt - Which of the following tools is most likely to be orga...
Six Sigma Green Belt - Which of the following tools is most likely to be orga...Six Sigma Green Belt - Which of the following tools is most likely to be orga...
Six Sigma Green Belt - Which of the following tools is most likely to be orga...
 
Six Sigma Green Belt - Correction, over production, inventory, and motion are...
Six Sigma Green Belt - Correction, over production, inventory, and motion are...Six Sigma Green Belt - Correction, over production, inventory, and motion are...
Six Sigma Green Belt - Correction, over production, inventory, and motion are...
 
Six Sigma Green Belt - A calibrated micrometer was used to take 10 replicated...
Six Sigma Green Belt - A calibrated micrometer was used to take 10 replicated...Six Sigma Green Belt - A calibrated micrometer was used to take 10 replicated...
Six Sigma Green Belt - A calibrated micrometer was used to take 10 replicated...
 
Six Sigma Green Belt - Positional, cyclical, and temporal variations are most...
Six Sigma Green Belt - Positional, cyclical, and temporal variations are most...Six Sigma Green Belt - Positional, cyclical, and temporal variations are most...
Six Sigma Green Belt - Positional, cyclical, and temporal variations are most...
 
Six Sigma Green Belt - The type of chart that presents the value of items in ...
Six Sigma Green Belt - The type of chart that presents the value of items in ...Six Sigma Green Belt - The type of chart that presents the value of items in ...
Six Sigma Green Belt - The type of chart that presents the value of items in ...
 
Six Sigma Green Belt - A sample consists of one or more units of product draw...
Six Sigma Green Belt - A sample consists of one or more units of product draw...Six Sigma Green Belt - A sample consists of one or more units of product draw...
Six Sigma Green Belt - A sample consists of one or more units of product draw...
 
Six Sigma Green Belt - In preparation for construction of a cause and effect ...
Six Sigma Green Belt - In preparation for construction of a cause and effect ...Six Sigma Green Belt - In preparation for construction of a cause and effect ...
Six Sigma Green Belt - In preparation for construction of a cause and effect ...
 
Six Sigma Green Belt - In analysis of variance, which of the following distri...
Six Sigma Green Belt - In analysis of variance, which of the following distri...Six Sigma Green Belt - In analysis of variance, which of the following distri...
Six Sigma Green Belt - In analysis of variance, which of the following distri...
 
Six Sigma Green Belt - A control plan is designed to do which of the followin...
Six Sigma Green Belt - A control plan is designed to do which of the followin...Six Sigma Green Belt - A control plan is designed to do which of the followin...
Six Sigma Green Belt - A control plan is designed to do which of the followin...
 
Six Sigma Green Belt - Which of the following tools would be most appropriate...
Six Sigma Green Belt - Which of the following tools would be most appropriate...Six Sigma Green Belt - Which of the following tools would be most appropriate...
Six Sigma Green Belt - Which of the following tools would be most appropriate...
 
Six Sigma Green Belt - The following is a sample data set. 10 8 8 6 5 what is...
Six Sigma Green Belt - The following is a sample data set. 10 8 8 6 5 what is...Six Sigma Green Belt - The following is a sample data set. 10 8 8 6 5 what is...
Six Sigma Green Belt - The following is a sample data set. 10 8 8 6 5 what is...
 
Six Sigma Green Belt - Which of the following is a good tool for planning cyc...
Six Sigma Green Belt - Which of the following is a good tool for planning cyc...Six Sigma Green Belt - Which of the following is a good tool for planning cyc...
Six Sigma Green Belt - Which of the following is a good tool for planning cyc...
 
Six Sigma Green Belt - At what stage of the problem solving process would a t...
Six Sigma Green Belt - At what stage of the problem solving process would a t...Six Sigma Green Belt - At what stage of the problem solving process would a t...
Six Sigma Green Belt - At what stage of the problem solving process would a t...
 
Six Sigma Green Belt - In measurement system analysis, which of the following...
Six Sigma Green Belt - In measurement system analysis, which of the following...Six Sigma Green Belt - In measurement system analysis, which of the following...
Six Sigma Green Belt - In measurement system analysis, which of the following...
 
Six Sigma Green Belt - Which of the following statistics would best describe ...
Six Sigma Green Belt - Which of the following statistics would best describe ...Six Sigma Green Belt - Which of the following statistics would best describe ...
Six Sigma Green Belt - Which of the following statistics would best describe ...
 
Six Sigma Green Belt - The least informative of the four measurement scales i...
Six Sigma Green Belt - The least informative of the four measurement scales i...Six Sigma Green Belt - The least informative of the four measurement scales i...
Six Sigma Green Belt - The least informative of the four measurement scales i...
 
Six Sigma Green Belt - Specification limits are derived from which of the fol...
Six Sigma Green Belt - Specification limits are derived from which of the fol...Six Sigma Green Belt - Specification limits are derived from which of the fol...
Six Sigma Green Belt - Specification limits are derived from which of the fol...
 
Six Sigma Green Belt - The fraction of nonconforming products is plotted on w...
Six Sigma Green Belt - The fraction of nonconforming products is plotted on w...Six Sigma Green Belt - The fraction of nonconforming products is plotted on w...
Six Sigma Green Belt - The fraction of nonconforming products is plotted on w...
 
Six Sigma Green Belt - The overall ability of two or more operators to obtain...
Six Sigma Green Belt - The overall ability of two or more operators to obtain...Six Sigma Green Belt - The overall ability of two or more operators to obtain...
Six Sigma Green Belt - The overall ability of two or more operators to obtain...
 

More from Ek Pahla Kadam

NCQC - Knowledge Test 06
NCQC - Knowledge Test   06NCQC - Knowledge Test   06
NCQC - Knowledge Test 06Ek Pahla Kadam
 
5S Module - Key Slides
5S Module - Key Slides5S Module - Key Slides
5S Module - Key SlidesEk Pahla Kadam
 
Ek Pahla Kadam Blogs by Dinesh Sharma
Ek Pahla Kadam Blogs by Dinesh SharmaEk Pahla Kadam Blogs by Dinesh Sharma
Ek Pahla Kadam Blogs by Dinesh SharmaEk Pahla Kadam
 
Ek Pahla Kadam Quotes by Dinesh Sharma
Ek Pahla Kadam Quotes by Dinesh SharmaEk Pahla Kadam Quotes by Dinesh Sharma
Ek Pahla Kadam Quotes by Dinesh SharmaEk Pahla Kadam
 
Group or Kobetsu Kaizen Presentation Template
Group or Kobetsu Kaizen Presentation TemplateGroup or Kobetsu Kaizen Presentation Template
Group or Kobetsu Kaizen Presentation TemplateEk Pahla Kadam
 
Lean Quality Circle Presentation Template
Lean Quality Circle Presentation TemplateLean Quality Circle Presentation Template
Lean Quality Circle Presentation TemplateEk Pahla Kadam
 

More from Ek Pahla Kadam (6)

NCQC - Knowledge Test 06
NCQC - Knowledge Test   06NCQC - Knowledge Test   06
NCQC - Knowledge Test 06
 
5S Module - Key Slides
5S Module - Key Slides5S Module - Key Slides
5S Module - Key Slides
 
Ek Pahla Kadam Blogs by Dinesh Sharma
Ek Pahla Kadam Blogs by Dinesh SharmaEk Pahla Kadam Blogs by Dinesh Sharma
Ek Pahla Kadam Blogs by Dinesh Sharma
 
Ek Pahla Kadam Quotes by Dinesh Sharma
Ek Pahla Kadam Quotes by Dinesh SharmaEk Pahla Kadam Quotes by Dinesh Sharma
Ek Pahla Kadam Quotes by Dinesh Sharma
 
Group or Kobetsu Kaizen Presentation Template
Group or Kobetsu Kaizen Presentation TemplateGroup or Kobetsu Kaizen Presentation Template
Group or Kobetsu Kaizen Presentation Template
 
Lean Quality Circle Presentation Template
Lean Quality Circle Presentation TemplateLean Quality Circle Presentation Template
Lean Quality Circle Presentation Template
 

Recently uploaded

Arihant handbook biology for class 11 .pdf
Arihant handbook biology for class 11 .pdfArihant handbook biology for class 11 .pdf
Arihant handbook biology for class 11 .pdfchloefrazer622
 
Grant Readiness 101 TechSoup and Remy Consulting
Grant Readiness 101 TechSoup and Remy ConsultingGrant Readiness 101 TechSoup and Remy Consulting
Grant Readiness 101 TechSoup and Remy ConsultingTechSoup
 
Q4-W6-Restating Informational Text Grade 3
Q4-W6-Restating Informational Text Grade 3Q4-W6-Restating Informational Text Grade 3
Q4-W6-Restating Informational Text Grade 3JemimahLaneBuaron
 
Interactive Powerpoint_How to Master effective communication
Interactive Powerpoint_How to Master effective communicationInteractive Powerpoint_How to Master effective communication
Interactive Powerpoint_How to Master effective communicationnomboosow
 
A Critique of the Proposed National Education Policy Reform
A Critique of the Proposed National Education Policy ReformA Critique of the Proposed National Education Policy Reform
A Critique of the Proposed National Education Policy ReformChameera Dedduwage
 
APM Welcome, APM North West Network Conference, Synergies Across Sectors
APM Welcome, APM North West Network Conference, Synergies Across SectorsAPM Welcome, APM North West Network Conference, Synergies Across Sectors
APM Welcome, APM North West Network Conference, Synergies Across SectorsAssociation for Project Management
 
Presentation by Andreas Schleicher Tackling the School Absenteeism Crisis 30 ...
Presentation by Andreas Schleicher Tackling the School Absenteeism Crisis 30 ...Presentation by Andreas Schleicher Tackling the School Absenteeism Crisis 30 ...
Presentation by Andreas Schleicher Tackling the School Absenteeism Crisis 30 ...EduSkills OECD
 
Accessible design: Minimum effort, maximum impact
Accessible design: Minimum effort, maximum impactAccessible design: Minimum effort, maximum impact
Accessible design: Minimum effort, maximum impactdawncurless
 
BASLIQ CURRENT LOOKBOOK LOOKBOOK(1) (1).pdf
BASLIQ CURRENT LOOKBOOK  LOOKBOOK(1) (1).pdfBASLIQ CURRENT LOOKBOOK  LOOKBOOK(1) (1).pdf
BASLIQ CURRENT LOOKBOOK LOOKBOOK(1) (1).pdfSoniaTolstoy
 
social pharmacy d-pharm 1st year by Pragati K. Mahajan
social pharmacy d-pharm 1st year by Pragati K. Mahajansocial pharmacy d-pharm 1st year by Pragati K. Mahajan
social pharmacy d-pharm 1st year by Pragati K. Mahajanpragatimahajan3
 
Web & Social Media Analytics Previous Year Question Paper.pdf
Web & Social Media Analytics Previous Year Question Paper.pdfWeb & Social Media Analytics Previous Year Question Paper.pdf
Web & Social Media Analytics Previous Year Question Paper.pdfJayanti Pande
 
Class 11th Physics NEET formula sheet pdf
Class 11th Physics NEET formula sheet pdfClass 11th Physics NEET formula sheet pdf
Class 11th Physics NEET formula sheet pdfAyushMahapatra5
 
Sports & Fitness Value Added Course FY..
Sports & Fitness Value Added Course FY..Sports & Fitness Value Added Course FY..
Sports & Fitness Value Added Course FY..Disha Kariya
 
Measures of Dispersion and Variability: Range, QD, AD and SD
Measures of Dispersion and Variability: Range, QD, AD and SDMeasures of Dispersion and Variability: Range, QD, AD and SD
Measures of Dispersion and Variability: Range, QD, AD and SDThiyagu K
 
Paris 2024 Olympic Geographies - an activity
Paris 2024 Olympic Geographies - an activityParis 2024 Olympic Geographies - an activity
Paris 2024 Olympic Geographies - an activityGeoBlogs
 
Explore beautiful and ugly buildings. Mathematics helps us create beautiful d...
Explore beautiful and ugly buildings. Mathematics helps us create beautiful d...Explore beautiful and ugly buildings. Mathematics helps us create beautiful d...
Explore beautiful and ugly buildings. Mathematics helps us create beautiful d...christianmathematics
 
9548086042 for call girls in Indira Nagar with room service
9548086042  for call girls in Indira Nagar  with room service9548086042  for call girls in Indira Nagar  with room service
9548086042 for call girls in Indira Nagar with room servicediscovermytutordmt
 

Recently uploaded (20)

Arihant handbook biology for class 11 .pdf
Arihant handbook biology for class 11 .pdfArihant handbook biology for class 11 .pdf
Arihant handbook biology for class 11 .pdf
 
Grant Readiness 101 TechSoup and Remy Consulting
Grant Readiness 101 TechSoup and Remy ConsultingGrant Readiness 101 TechSoup and Remy Consulting
Grant Readiness 101 TechSoup and Remy Consulting
 
Q4-W6-Restating Informational Text Grade 3
Q4-W6-Restating Informational Text Grade 3Q4-W6-Restating Informational Text Grade 3
Q4-W6-Restating Informational Text Grade 3
 
Interactive Powerpoint_How to Master effective communication
Interactive Powerpoint_How to Master effective communicationInteractive Powerpoint_How to Master effective communication
Interactive Powerpoint_How to Master effective communication
 
A Critique of the Proposed National Education Policy Reform
A Critique of the Proposed National Education Policy ReformA Critique of the Proposed National Education Policy Reform
A Critique of the Proposed National Education Policy Reform
 
APM Welcome, APM North West Network Conference, Synergies Across Sectors
APM Welcome, APM North West Network Conference, Synergies Across SectorsAPM Welcome, APM North West Network Conference, Synergies Across Sectors
APM Welcome, APM North West Network Conference, Synergies Across Sectors
 
Presentation by Andreas Schleicher Tackling the School Absenteeism Crisis 30 ...
Presentation by Andreas Schleicher Tackling the School Absenteeism Crisis 30 ...Presentation by Andreas Schleicher Tackling the School Absenteeism Crisis 30 ...
Presentation by Andreas Schleicher Tackling the School Absenteeism Crisis 30 ...
 
Advance Mobile Application Development class 07
Advance Mobile Application Development class 07Advance Mobile Application Development class 07
Advance Mobile Application Development class 07
 
Accessible design: Minimum effort, maximum impact
Accessible design: Minimum effort, maximum impactAccessible design: Minimum effort, maximum impact
Accessible design: Minimum effort, maximum impact
 
BASLIQ CURRENT LOOKBOOK LOOKBOOK(1) (1).pdf
BASLIQ CURRENT LOOKBOOK  LOOKBOOK(1) (1).pdfBASLIQ CURRENT LOOKBOOK  LOOKBOOK(1) (1).pdf
BASLIQ CURRENT LOOKBOOK LOOKBOOK(1) (1).pdf
 
social pharmacy d-pharm 1st year by Pragati K. Mahajan
social pharmacy d-pharm 1st year by Pragati K. Mahajansocial pharmacy d-pharm 1st year by Pragati K. Mahajan
social pharmacy d-pharm 1st year by Pragati K. Mahajan
 
Web & Social Media Analytics Previous Year Question Paper.pdf
Web & Social Media Analytics Previous Year Question Paper.pdfWeb & Social Media Analytics Previous Year Question Paper.pdf
Web & Social Media Analytics Previous Year Question Paper.pdf
 
Class 11th Physics NEET formula sheet pdf
Class 11th Physics NEET formula sheet pdfClass 11th Physics NEET formula sheet pdf
Class 11th Physics NEET formula sheet pdf
 
Sports & Fitness Value Added Course FY..
Sports & Fitness Value Added Course FY..Sports & Fitness Value Added Course FY..
Sports & Fitness Value Added Course FY..
 
Mattingly "AI & Prompt Design: The Basics of Prompt Design"
Mattingly "AI & Prompt Design: The Basics of Prompt Design"Mattingly "AI & Prompt Design: The Basics of Prompt Design"
Mattingly "AI & Prompt Design: The Basics of Prompt Design"
 
Measures of Dispersion and Variability: Range, QD, AD and SD
Measures of Dispersion and Variability: Range, QD, AD and SDMeasures of Dispersion and Variability: Range, QD, AD and SD
Measures of Dispersion and Variability: Range, QD, AD and SD
 
Paris 2024 Olympic Geographies - an activity
Paris 2024 Olympic Geographies - an activityParis 2024 Olympic Geographies - an activity
Paris 2024 Olympic Geographies - an activity
 
Explore beautiful and ugly buildings. Mathematics helps us create beautiful d...
Explore beautiful and ugly buildings. Mathematics helps us create beautiful d...Explore beautiful and ugly buildings. Mathematics helps us create beautiful d...
Explore beautiful and ugly buildings. Mathematics helps us create beautiful d...
 
9548086042 for call girls in Indira Nagar with room service
9548086042  for call girls in Indira Nagar  with room service9548086042  for call girls in Indira Nagar  with room service
9548086042 for call girls in Indira Nagar with room service
 
Mattingly "AI & Prompt Design: Structured Data, Assistants, & RAG"
Mattingly "AI & Prompt Design: Structured Data, Assistants, & RAG"Mattingly "AI & Prompt Design: Structured Data, Assistants, & RAG"
Mattingly "AI & Prompt Design: Structured Data, Assistants, & RAG"
 

NCQC - Knowledge Test 05

  • 1. Ek Pahla Kadam, Take it .. Keep Moving .. Quality Circle Sample Knowledge Test Paper for CCQC / NCQC – 05 1) PDCA Cycle is named after? a. Dr. J M Juran b. Dr. A. V. Feigenbaum c. Dr. W. E. Deming d. Dr. Genichi Taguchi 2) Which quality guru received the unique honour of developing sampling technique in 1940’s a. Dr. W. E. Deming b. Dr. W.A. Shewart c. Dr. J M Juran d. Philip B Crosby 3) Which is not true for Quality Circle? a. A small group b. Voluntary c. Uses quality control techniques d. Have members from anywhere in work area 4) Who pioneered Quality Circle concept in the world? a. Prof. Ichiro Miyauchi b. Shigeo Shingo c. Prof. Ichigawa d. Dr. K. Ishikawa 5) In process type cause and effect diagram a. 4 M are used b. 4 P are used c. Process Flow is used d. None of above 6) If coefficient of correlation of two variables is 0.8, this shows that a. There is no Correlation b. There is Strong Positive Correlation c. There is Strong Negative Correlation d. The Difference in Both the Variables 7) In a flow diagram what does a rectangle represent? a. Unstructured b. Slip Method c. Round Robin d. None of above 8) When a process is following normal distribution what percentage of observation fall outside the 3 Sigma limit? a. 3% b. 3.2 parts per million c. 0.27 % d. 2.2 parts per billion 9) When was QCFI established? a. 1998 b. 1960 c. 1991 d. 1982 10) The process capability is calculated as a. (USL-LSL)/3 σ b. (USL+LSL)/3 σ c. (USL-LSL)/ 6 σ d. (USL+LSL)/6 σ
  • 2. Ek Pahla Kadam, Take it .. Keep Moving .. Quality Circle 11) A tolerance diagram is also called a. Scatter diagram b. Defect concentration diagram c. Histogram d. Tier Chart 12) A/K Category of Problem can be solved directly proceeding from QC Problem Solving Step No. ……….? a. Step No. 03 b. Step No. 05 c. Step No. 08 d. Step No. 09 13) Dr. J M Juran has included which step in Quality Circle 12 Step Problem Solving Methodology? a. Step No. 4 b. Step No. 7 c. Step No. 9 d. Step No 12 14) What is MODE in a set of Data? a. The highest value b. The Middle value c. The most frequent value d. None of above 15) Meaning of “GENSOKO” is a. Real Thing b. Real Fact c. Principle d. Standard & Parameter 16) What should be the recommended number of classes or groups for 450 observations for frequency distribution for making histogram? a. 8 b. 9 c. 10 d. 11 17) What is the measure of Central Tendency of a data set a. Mean b. Mode c. Median d. All above 18) Calculate class interval if least count is 1 gram, number of class are 8 and range is 19 gram a. 20 b. 10 c. 8 d. 2.5 19) Which control chart is to be made for temperature reading a. X Bar – R Chart b. p-chart c. np-chart d. U Chart 20) Lean Quality Circle problem solving process having how many steps a. 5 b. 7 c. 8 d. 12 Compiled by : Dinesh Sharma, e-mail dinesh@ekpahlakadam.com, Mobile +91 9589004005 Date : 28th Sep 2018 Duration : 20 minutes
  • 3. Ek Pahla Kadam, Take it .. Keep Moving .. Quality Circle Sample Knowledge Test Paper for CCQC / NCQC – 05 Answer Sheet Participant Name: Circle Name: Q. No. Answer Description Marks 1 2 3 4 5 6 7 8 9 10 11 12 13 14 15 16 17 18 19 20 Total Marks