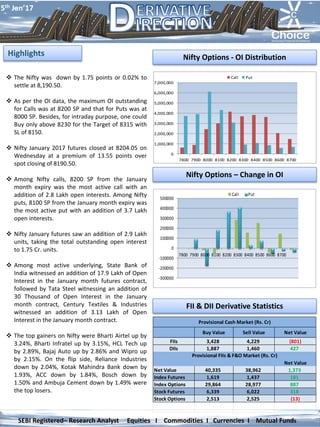
1. Nifty Options - OI Distribution
The Nifty was down by 1.75 points or 0.02% to
settle at 8,190.50.
As per the OI data, the maximum OI outstanding
for Calls was at 8200 SP and that for Puts was at
8000 SP. Besides, for intraday purpose, one could
Buy only above 8230 for the Target of 8315 with
SL of 8150.
Nifty January 2017 futures closed at 8204.05 on
Wednesday at a premium of 13.55 points over
spot closing of 8190.50.
Among Nifty calls, 8200 SP from the January
month expiry was the most active call with an
addition of 2.8 Lakh open interests. Among Nifty
puts, 8100 SP from the January month expiry was
the most active put with an addition of 3.7 Lakh
open interests.
Nifty January futures saw an addition of 2.9 Lakh
units, taking the total outstanding open interest
to 1.75 Cr. units.
Among most active underlying, State Bank of
India witnessed an addition of 17.9 Lakh of Open
Interest in the January month futures contract,
followed by Tata Steel witnessing an addition of
30 Thousand of Open Interest in the January
month contract, Century Textiles & Industries
witnessed an addition of 3.13 Lakh of Open
Interest in the January month contract.
The top gainers on Nifty were Bharti Airtel up by
3.24%, Bharti Infratel up by 3.15%, HCL Tech up
by 2.89%, Bajaj Auto up by 2.86% and Wipro up
by 2.15%. On the flip side, Reliance Industries
down by 2.04%, Kotak Mahindra Bank down by
1.93%, ACC down by 1.84%, Bosch down by
1.50% and Ambuja Cement down by 1.49% were
the top losers.
Nifty Options – Change in OI
Highlights
FII & DII Derivative Statistics
5th Jan’17
SEBI Registered– Research Analyst Equities I Commodities I Currencies I Mutual Funds
0
1,000,000
2,000,000
3,000,000
4,000,000
5,000,000
6,000,000
7,000,000
7800 7900 8000 8100 8200 8300 8400 8500 8600 8700
Call Put
Buy Value Sell Value Net Value
FIIs 3,428 4,229 (801)
DIIs 1,887 1,460 427
Net Value
Net Value 40,335 38,962 1,373
Index Futures 1,619 1,437 181
Index Options 29,864 28,977 887
Stock Futures 6,339 6,022 318
Stock Options 2,513 2,525 (13)
Provisional FIIs & F&O Market (Rs. Cr)
Provisional Cash Market (Rs. Cr)
-300000
-200000
-100000
0
100000
200000
300000
400000
500000
7800 7900 8000 8100 8200 8300 8400 8500 8600 8700
Call Put
2. Derivative Strategy Pay- Off Chart
The India Volatility Index decreased by 0.42% and
reached 15.89.
The Nifty Put Call Ratio (PCR) finally stood at 1.20
for January month contract .
The top five scrips with highest PCR on OI were
TVS Motor (1.85), Dabur India (1.63), Ajanta
Pharma (1.54), DLF (1.51) and Maruti Suzuki India
(1.44).
India VIX v/s Nifty Chart
5th Jan’17
SEBI Registered– Research Analyst Equities I Commodities I Currencies I Mutual Funds
Short Covering
Symbol Close Price Chng % OI Chng % Buy Above
BHEL 126.95 1.64 -8.41 128.02
BEL 1433.55 0.36 -7.13 1444.04
TORNTPHARM 1347.80 0.36 -6.83 1363.46
RELINFRA 483.45 0.79 -4.17 486.18
Short Built Up
Symbol Close Price Chng % OI Chng % Sell Below
JSWSTEEL 163.15 -90.11 89.83 160.65
KOTAKBANK 697.35 -2.19 12.15 690.42
DIVISLAB 755.60 -2.97 11.13 742.92
HINDZINC 252.10 -3.15 9.22 248.64
Long Liquidation
Symbol Close Price Chng % OI Chng % Sell Below
ENGINERSIN 154.15 -0.68 -9.02 152.98
MRF 50394.60 -0.34 -8.40 50127.12
ICIL 166.40 -3.65 -8.03 162.96
PETRONET 374.25 -1.73 -6.49 369.97
Long Built Up
Symbol Close Price Chng % OI Chng % Buy Above
HEXAWARE 213.00 1.26 19.01 215.58
HDIL 63.10 1.45 15.00 64.09
JPASSOCIAT 9.85 19.39 11.31 10.48
HCLTECH 854.70 2.86 7.53 865.63
Date- 3rd Jan-17 ZEEL
Max. Profit of Rs. 25350, Approx. Loss of Rs. 5850 at SL
level of 446
View – Bullish (Covered Call)
Future
BUY /
SELL
QTY SERIES TYPE
Market
Price
Buy 1300 25th JAN Fut 459.20
Option
BUY /
SELL
QTY
STRIKE
PRICE
SERIES
OPTION
TYPE
Premium
SELL 1300 470 25th JAN CE 8.70 -10.00
-5.00
0.00
5.00
10.00
15.00
20.00
25.00
443.00 449.00 455.00 461.00 467.00 473.00
3. Contact Us
Kkunal Parar
Sr. Research Associate
kkunal.parar@choiceindia.com
Vikas Chaudhari
Research Associate
vikas.chaudhari@choiceindia.com
www.choiceindia.comcustomercare@choiceindia.com
Disclaimer
This is solely for information of clients of Choice Broking and does not construe to be an investment advice. It is also not intended as an offer or solicitation for the purchase and sale of any financial
instruments. Any action taken by you on the basis of the information contained herein is your responsibility alone and Choice Broking its subsidiaries or its employees or associates will not be liable in
any manner for the consequences of such action taken by you. We have exercised due diligence in checking the correctness and authenticity of the information contained in this recommendation, but
Choice Broking or any of its subsidiaries or associates or employees shall not be in any way responsible for any loss or damage that may arise to any person from any inadvertent error in the
information contained in this recommendation or any action taken on basis of this information. Technical analysis studies market psychology, price patterns and volume levels. It is used to forecast
future price and market movements. Technical analysis is complementary to fundamental analysis and news sources. The recommendations issued herewith might be contrary to recommendations
issued by Choice Broking in the company research undertaken as the recommendations stated in this report is derived purely from technical analysis. Choice Broking has based this document on
information obtained from sources it believes to be reliable but which it has not independently verified; Choice Broking makes no guarantee, representation or warranty and accepts no responsibility
or liability as to its accuracy or completeness. The opinions contained within the report are based upon publicly available information at the time of publication and are subject to change without
notice. The information and any disclosures provided herein are in summary form and have been prepared for informational purposes. The recommendations and suggested price levels are intended
purely for trading purposes. The recommendations are valid for the day of the report however trading trends and volumes might vary substantially on an intraday basis and the recommendations may
be subject to change. The information and any disclosures provided herein may be considered confidential. Any use, distribution, modification, copying, forwarding or disclosure by any person is
strictly prohibited. The information and any disclosures provided herein do not constitute a solicitation or offer to purchase or sell any security or other financial product or instrument. The current
performance may be unaudited. Past performance does not guarantee future returns. There can be no assurance that investments will achieve any targeted rates of return, and there is no guarantee
against the loss of your entire investment.
POTENTIAL CONFLICT OF INTEREST DISCLOSURE (as on date of report) Disclosure of interest statement – • Analyst interest of the stock /Instrument(s): - No. • Firm interest of the stock /
Instrument (s): - No.
Kapil Shah
Research Associate
kapil.shah@choiceindia.com
Amit Pathania
Research Associate
amit.pathania@choiceindia.com
5th Jan’17
SEBI Registered– Research Analyst Equities I Commodities I Currencies I Mutual Funds
Kkunal Parar
Digitally signed by Kkunal Parar
DN: cn=Kkunal Parar, o=Choice Equity Broking
Pvt Ltd., ou=Research Dept.,
email=kkunal.parar@choiceindia.com, c=IN
Date: 2017.01.05 08:54:54 +05'30'