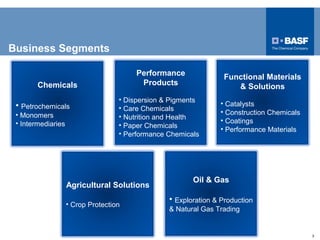
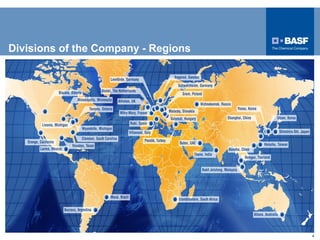
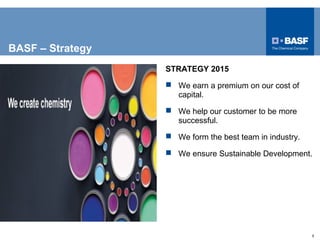
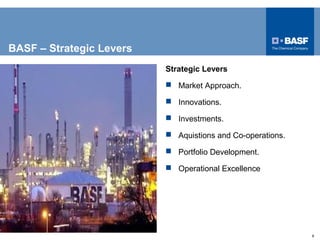
Driving Future Growth
Presented by:
Pramita Sharma
Moumita Ghosh
Arjun
Dileep
Livin
Akhilesh
1
BASF – Introduction
BASF – The Chemical Company
 BASF is the world’s leading Chemical
Company.
 With more than 110,000 employees, six
Verbund sites and approximately 380
additional production sites worldwide
they serve customers and partners in
almost all countries of the world.
 In 2012, BASF posted sales of €72.1
billion and income before special items of
approximately €6.6 billion.

2
Business Segments
Performance
Products

Chemicals

• Petrochemicals
• Monomers
• Intermediaries

Functional Materials
& Solutions

• Dispersion & Pigments
• Care Chemicals
• Nutrition and Health
• Paper Chemicals
• Performance Chemicals

Agricultural Solutions
• Crop Protection

• Catalysts
• Construction Chemicals
• Coatings
• Performance Materials

Oil & Gas

• Exploration & Production
& Natural Gas Trading

3
Divisions of the Company - Regions

4
BASF – Strategy
STRATEGY 2015
 We earn a premium on our cost of
capital.
 We help our customer to be more
successful.
 We form the best team in industry.
 We ensure Sustainable Development.

5
BASF – Strategic Levers
Strategic Levers
 Market Approach.
 Innovations.
 Investments.
 Aquistions and Co-operations.
 Portfolio Development.
 Operational Excellence

6
BASF – Market Approach

7
BASF – Innovations
X-SEED® 100
Hardening accelerator for Concrete.
First of its kind.
Increases productivity and quality in
Concrete Production.
It consists of synthetically produced
crystal seeds in liquid form, which boosts
the hardening property of concrete mix.

8
BASF – Investments

9
BASF – Aquistions & Co-operations

Becker Underwood – € 785 million

Pronova BioPharma - € 526 million

Statoil – $1.35 billion

Gazprom – Asset Swap Deal
10
BASF – Portfolio Development
Moving downstream towards Customer Industries

11
BASF – Operational Excellence
 Continuous improvement in sites, plants
and production processes.
 Harmonizing business processes
worldwide.
 Improving Efficiency.
 Next initiative highly profitable. (€1
billion earnings)
 Step initiative is expected to contribute
another €1 billion each year.

12
BASF – Growth of the Company

13
BASF – Market Share
Market Share
 Market Capitalization* - € 63.0 billion.
 Share Price* - €68.63.
 High/Low (04/01/2013 – 06/30/2013) €75.79/65.55.
 Share Performance 2002 – 2012** +19.2% per year.
 Share Performance**(04/01/2013 –
06/30/2013) - +4.2%
* - as of June 30, 2013.
** - with dividends reinvested.
14
BASF – Competitors
Name

Last Price Market Cap.
(Rs. cr.)

Sales
Turnover

Net Profit

Total
Assets

Pidilite Ind

251.00

12,867.32

3,331.69

460.76

1,732.44

United Phos

144.85

6,411.12

3,939.44

208.13

5,395.80

Tata Chemicals

237.90

6,060.65

8,529.87

643.32

7,476.66

Guj Flourochem

236.10

2,593.56

1,596.08

398.34

3,285.89

Linde India

273.85

2,335.51

1,324.44

89.48

2,344.34

BASF

534.75

2,314.70

3,940.63

114.08

1,223.61

Source: http://www.moneycontrol.com
15
BASF – Key Financial Targets 2015/2020

16
BASF – Current Affairs
• BASF announces cash offer of US $4 per share to acquire
Verenium, a specialized enzyme biotechnology company.

17
18

basf.

  • 1.
    Driving Future Growth Presentedby: Pramita Sharma Moumita Ghosh Arjun Dileep Livin Akhilesh 1
  • 2.
    BASF – Introduction BASF– The Chemical Company  BASF is the world’s leading Chemical Company.  With more than 110,000 employees, six Verbund sites and approximately 380 additional production sites worldwide they serve customers and partners in almost all countries of the world.  In 2012, BASF posted sales of €72.1 billion and income before special items of approximately €6.6 billion. 2
  • 3.
    Business Segments Performance Products Chemicals • Petrochemicals •Monomers • Intermediaries Functional Materials & Solutions • Dispersion & Pigments • Care Chemicals • Nutrition and Health • Paper Chemicals • Performance Chemicals Agricultural Solutions • Crop Protection • Catalysts • Construction Chemicals • Coatings • Performance Materials Oil & Gas • Exploration & Production & Natural Gas Trading 3
  • 4.
    Divisions of theCompany - Regions 4
  • 5.
    BASF – Strategy STRATEGY2015  We earn a premium on our cost of capital.  We help our customer to be more successful.  We form the best team in industry.  We ensure Sustainable Development. 5
  • 6.
    BASF – StrategicLevers Strategic Levers  Market Approach.  Innovations.  Investments.  Aquistions and Co-operations.  Portfolio Development.  Operational Excellence 6
  • 7.
    BASF – MarketApproach 7
  • 8.
    BASF – Innovations X-SEED®100 Hardening accelerator for Concrete. First of its kind. Increases productivity and quality in Concrete Production. It consists of synthetically produced crystal seeds in liquid form, which boosts the hardening property of concrete mix. 8
  • 9.
  • 10.
    BASF – Aquistions& Co-operations Becker Underwood – € 785 million Pronova BioPharma - € 526 million Statoil – $1.35 billion Gazprom – Asset Swap Deal 10
  • 11.
    BASF – PortfolioDevelopment Moving downstream towards Customer Industries 11
  • 12.
    BASF – OperationalExcellence  Continuous improvement in sites, plants and production processes.  Harmonizing business processes worldwide.  Improving Efficiency.  Next initiative highly profitable. (€1 billion earnings)  Step initiative is expected to contribute another €1 billion each year. 12
  • 13.
    BASF – Growthof the Company 13
  • 14.
    BASF – MarketShare Market Share  Market Capitalization* - € 63.0 billion.  Share Price* - €68.63.  High/Low (04/01/2013 – 06/30/2013) €75.79/65.55.  Share Performance 2002 – 2012** +19.2% per year.  Share Performance**(04/01/2013 – 06/30/2013) - +4.2% * - as of June 30, 2013. ** - with dividends reinvested. 14
  • 15.
    BASF – Competitors Name LastPrice Market Cap. (Rs. cr.) Sales Turnover Net Profit Total Assets Pidilite Ind 251.00 12,867.32 3,331.69 460.76 1,732.44 United Phos 144.85 6,411.12 3,939.44 208.13 5,395.80 Tata Chemicals 237.90 6,060.65 8,529.87 643.32 7,476.66 Guj Flourochem 236.10 2,593.56 1,596.08 398.34 3,285.89 Linde India 273.85 2,335.51 1,324.44 89.48 2,344.34 BASF 534.75 2,314.70 3,940.63 114.08 1,223.61 Source: http://www.moneycontrol.com 15
  • 16.
    BASF – KeyFinancial Targets 2015/2020 16
  • 17.
    BASF – CurrentAffairs • BASF announces cash offer of US $4 per share to acquire Verenium, a specialized enzyme biotechnology company. 17
  • 18.