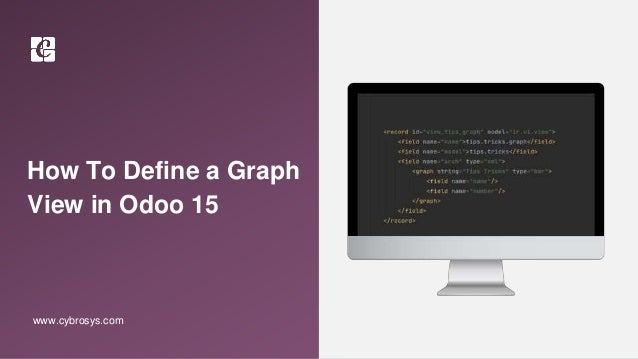
1. How To Define a Graph
View in Odoo 15
www.cybrosys.com
2. INTRODUCTION
Graph views provide a graphical view of the data, in the form of Bar chart, Pie chart, and
Line chart.
The graph view is an aggregation of all the records in a model, which is generally visualized
in bar, pie, and line.
The default type of graph is a pie chart - to change it to a bar chart, we need to specify the
type. You also may change the orientation.
The graph view is used to visualize aggregations over a number of records or record
groups.
3.
4. ● Bar(Default)
● Pie - Circular representation
● Line - Line representation
Types of Graphs
5. Interval
● ‘interval’ is meaningful for date fields, and is the time interval used to group time data by ‘day’,
‘week’, ‘month’, ‘quarter’, or ‘year’
Name
● ‘name’ is always required, it is the name of the fields used for graphing. It is used more likely used
for grouping rather than aggregating.
6. Graph tag
● The default type of the graph is a pie chart - to change it to a barchart change the type as bar
8. For More
Details
Check our company website for related blogs and Odoo
book.
Odoo Book V15
Check our YouTube channel for functional and technical
videos in Odoo.
How to Define a Graph View in Odoo15 | Advanced
Views | Odoo 15 Development Tutorials