
Recommended
Recommended
More Related Content
Similar to EXPLORIING THE LIBRARY USERS OF VARIOUS COURSES IN NORTHWESTERN MINDANAO STATE COLLEGE OF SCIENCE AND TECHNOLOGY
Similar to EXPLORIING THE LIBRARY USERS OF VARIOUS COURSES IN NORTHWESTERN MINDANAO STATE COLLEGE OF SCIENCE AND TECHNOLOGY (20)
More from Carlagane Compoc Sarajena
More from Carlagane Compoc Sarajena (20)
Recently uploaded
Recently uploaded (20)
EXPLORIING THE LIBRARY USERS OF VARIOUS COURSES IN NORTHWESTERN MINDANAO STATE COLLEGE OF SCIENCE AND TECHNOLOGY
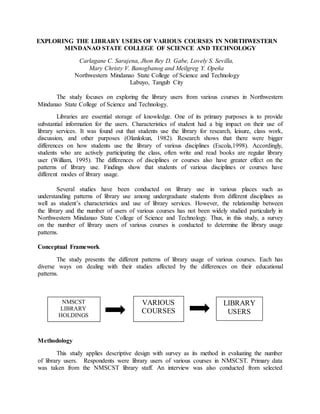
- 1. EXPLORING THE LIBRARY USERS OF VARIOUS COURSES IN NORTHWESTERN MINDANAO STATE COLLEGE OF SCIENCE AND TECHNOLOGY Carlagane C. Sarajena, Jhon Rey D. Gabe, Lovely S. Sevilla, Mary Christy V. Banogbanog and Meilgreg Y. Opeña Northwestern Mindanao State College of Science and Technology Labuyo, Tangub City The study focuses on exploring the library users from various courses in Northwestern Mindanao State College of Science and Technology. Libraries are essential storage of knowledge. One of its primary purposes is to provide substantial information for the users. Characteristics of student had a big impact on their use of library services. It was found out that students use the library for research, leisure, class work, discussion, and other purposes (Olanlokun, 1982). Research shows that there were bigger differences on how students use the library of various disciplines (Escola,1998). Accordingly, students who are actively participating the class, often write and read books are regular library user (William, 1995). The differences of disciplines or courses also have greater effect on the patterns of library use. Findings show that students of various disciplines or courses have different modes of library usage. Several studies have been conducted on library use in various places such as understanding patterns of library use among undergraduate students from different disciplines as well as student’s characteristics and use of library services. However, the relationship between the library and the number of users of various courses has not been widely studied particularly in Northwestern Mindanao State College of Science and Technology. Thus, in this study, a survey on the number of library users of various courses is conducted to determine the library usage patterns. Conceptual Framework The study presents the different patterns of library usage of various courses. Each has diverse ways on dealing with their studies affected by the differences on their educational patterns. Methodology This study applies descriptive design with survey as its method in evaluating the number of library users. Respondents were library users of various courses in NMSCST. Primary data was taken from the NMSCST library staff. An interview was also conducted from selected NMSCST LIBRARY HOLDINGS VARIOUS COURSES LIBRARY USERS
- 2. students in each course. The percentage on the number of users was used to express the value of the data gathered. The data were then interpreted as to what course has the most and least number of library users. Results and Discussion Figure 1 shows the result of the survey in the month of August. The graph revealed that students from school of Teacher Education most often go to the library followed by school of school of Information Technology opposite from that of Senior and Junior High School which shows no signs of visit during the whole month of August. It also shows that the school of Industrial Technology had almost the same level of usage with the school of HRST and school of Agriculture. Figure 2 shows the result of the survey in the month of September. 0 20 40 60 80 100 120 STE SIT School of Industrial Technology School of HRST School of Agriculture BS Mathematics Senior High School JuniorHigh School LIBRARYUSAGE COURSES Month of August A.Y. 2016-2017 0 50 100 150 200 250 300 STE SIT School of Industrial Technology School of HRST School of Agriculture BS Mathematics Senior High School Junior High School LIBRARYUSAGE COURSES Month of September A.Y. 2016-2017
- 3. The graph revealed the almost the same results from that of the first figure(August) which means that teacher education students most often go to library. Followed by the school of Industrial Technology. The school of Information Technology shows almost the same level of library usage with the school of HRST. Opposite to the other courses, school of Agriculture, Senior High and Junior High shows no sign of visit in the library. Compared to the previous months, the school of BS-Mathematics showed signs of visit in the library. Figure 3 shows the result of the survey in the month of October. Figure 3 shows slight difference from the previous months. It shows that Junior high school students frequently visit the library during the month of October. It was followed by the school of Teacher Education. The school of Information Technology showed almost the same result in the level of library usage with the school of Agriculture, followed by the school of HRST. Opposite with BS-Mathematics which shows no sign of visit. 0 50 100 150 200 250 STE SIT School of Industrial Technology School of HRST School of Agriculture BS Mathematics Senior High School JuniorHigh School LIBRARYUSAGE COURSES Month of October A.Y. 2016-2017
- 4. Figure 4 shows the result of the survey in the month of November. During the month of November, it was the junior high school students who frequently visit the library same as with the result revealed in figure 4 (October). The school of Information Technology (SIT) and the school of Agriculture still revealed almost the same result. Followed by the school of HRST. BS-Mathematics still revealed the same result with the previous months which shows no sign of visit. Figure 5 shows the result of the survey in the month of December 0 100 200 300 400 500 600 700 800 STE SIT School of Industrial Technology School of HRST School of Agriculture BS Mathematics Senior High School Junior High School LIBRARYUSAGE COURSE Month of November A.Y. 2016-2017 0 100 200 300 400 500 600 700 800 STE SIT School of Industrial Technology School of HRST School of Agriculture BS Mathematics Senior High School Junior High School LIBRARYUSAGE COURSE Month of December A.Y. 2016-2017
- 5. As of the month of December, the figure revealed that junior high school students still often visit the library. As depicted, students from other disciplines also visit the library often this time. Figure 6 shows the result of the survey in the month of January. Figure 6 revealed that teacher education students and junior high school students almost had the same number in the level of library usage which means that both discipline often go to the library. It was followed by the school of Industrial Technology. Still SIT and school of Agriculture revealed the same findings with the previous months. Still followed by the school of HRST. BS-Mathematics already shows signs of visit. 0 50 100 150 200 250 300 LIBRARYUSAGE COURSE Month of January A.Y. 2016-2017
- 6. Figure 7 shows the result of the survey in the month of February The figure 8 revealed that both junior high school and teacher education students most often go to the library. This was followed by the school of school of Industrial Technology. Unlike the previous months, the school of HRST almost had the same result with the school of Agriculture. This was followed by Senior High School. BS-Math shows signs of visit. Figure 9 shows the result of the survey in the month of March. 0 50 100 150 200 250 300 350 400 450 500 LIBRARYUSAGE COURSE Month of February A.Y. 2016-2017 0 100 200 300 400 500 600 700 800 900 1000 LIBRARYUSAGE COURSE Month of March A.Y. 2016-2017
- 7. The figure 9 revealed that junior high students frequently visit the library during the month of March. It was followed by the school of Teacher Education. Then followed by the school of Industrial Technology and school of Agriculture which shows still the same findings with the previous months. Followed by HRST. Still the school of BS-Mathematics shows no sign of visit. Figure 10 shows the summary of the data from August to March A.Y. 2016-2017 Discussion The figure shows a summary of the data gathered from August to March. In the month of August, the graph revealed that students from school of Teacher Education most often go to the library followed by school of school of Information Technology opposite from that of Senior and Junior High School which shows no signs of visit during the whole month of August. It also shows that the school of Industrial Technology had almost the same level of usage with the school of HRST and school of Agriculture. In the month of September, the graph revealed the almost the same results from that of the first figure(August) which means that teacher education students most often go to library. Followed by the school of Industrial Technology. The school of Information Technology shows almost the same level of library usage with the school of HRST. Opposite to the other courses, school of Agriculture, Senior High and Junior High shows no sign of visit in the library. Compared to the previous months, the school of BS-Mathematics showed signs of visit in the library. In October, the figure shows slight difference from the previous months. It shows that Junior high school students frequently visit the library during the month of October. It was followed by the school of Teacher Education. The school of Information Technology showed almost the same result in the level of library usage with the school of Agriculture, followed by the school of HRST. Opposite with BS-Mathematics which shows no sign of visit. During the month of November, it was the junior high school students who frequently visit the library same as with the result revealed in figure 4 (October). The school of Information Technology (SIT) and the school of Agriculture still revealed almost the same 0 500 1000 1500 2000 2500 3000 3500 STE SIT School of Industrial Tecnology School of HRST School of Agriculture BS Mathematics Senior High School JuniorHigh School LIBRARYUSAGE COURSE A survey data from August to March A.Y. 2016-2017 August September October November December January February March
- 8. result. Followed by the school of HRST. BS-Mathematics still revealed the same result with the previous months which shows no sign of visit. As of the month of December, the figure revealed that junior high school students still often visit the library. As depicted, students from other disciplines also visit the library often this time. In January, it was revealed that teacher education students and junior high school students almost had the same number in the level of library usage which means that both discipline often go to the library. It was followed by the school of Industrial Technology. Still SIT and school of Agriculture revealed the same findings with the previous months. Still followed by the school of HRST. BS-Mathematics shows no sign of visit. In February results revealed that both junior high school and teacher education students most often go to the library. This was followed by the school of school of Industrial Technology. Unlike the previous months, the school of HRST almost had the same result with the school of Agriculture. This was followed by Senior High School. BS-Math shows signs of visit. In the month of March, results revealed that junior high students frequently visit the library during the month of March. It was followed by the school of Teacher Education. Then followed by the school of Industrial Technology and school of Agriculture which shows still the same findings with the previous months. Followed by HRST. Still the school of BS-Mathematics shows no sign of visit. The following figures clearly presents the differences on the level of library usage among various courses in NMSCST. User’s characteristics such as means of study, personality and lifestyle, reasons for use, reading patterns, level of satisfaction and awareness of library services affects individuals’ mode of usage in the library (Powell, 1997). The differences on the graphs shown may be affected by these characteristics or maybe not. Library as a house of knowledge must have the broadest possible collection of books and other essential materials. It should constitute effective services for the students to find more information and thus, use the library maximally. NMSCST library specifically, provides services like books, magazines and other essential materials. Even so, the library lacks enough resources to address students’ satisfaction. 47.5% of the respondents assert that NMSCST library lack books, 27.5% say that the books are not updated and 25% say that the library specifically E-library possess slow internet connection based on the interview conducted. This pertains to show that the variation of library patterns of usage in every course as depicted on the graphs was greatly affected by different factors. Conclusion This study revealed the variation in library usage based on various courses. The “inner worlds of the user” asserted by Kimno (1997) was being strengthened by this study. The NMSCST library should give attention and priority to the students’ needs, of whom is the primary clientele inspite of their constituencies and obligations. The library should also be aware that students shared diverse characteristics. The library services of NMSCST should also be planned carefully. It should be designed in order to meet the series of students’ information needs that ascend in various courses. NMSCST library lacks enough resources that caters the needs and satisfaction of all the students of various courses. This means that the quality of library services has great failure in meeting the needs of the library users. This failure could lead to greater negative impact on the students’ academic performance or achievement. Quality of education in NMSCST is affected by the students’ academic achievement as these two variables are connected. Students views of the library greatly affects the quality of the library services. The administration responsible for the improvement of the library should take this as a serious
- 9. problem. There must be an immediate action to this as it can affect the quality of education in NMSCST. REFERENCES 21 Reasons to Visit the Library- Often! – Books & Chardonnay. Retrieved from: http://booksandchardonnay.com/top-reasons-to-visit-the-library-often/ COLLINS, Ellen; STONE, Graham. Understanding Patterns of Library Use Among Undergraduate Students from Different Disciplines. Evidence BasedLibrary and Information Practice, [S.l.], v. 9, n. 3, p. 51-67, sep. 2014. ISSN 1715-720X. Available at: <https://journals.library.ualberta.ca/eblip/index.php/EBLIP/article/view/21326/17132>. Date accessed: 15 may 2017. doi:http://dx.doi.org/10.18438/B8930K. FINDINGS POST 2: DISCIPLINE MATTERS. Retrieved from: https://library.hud.ac.uk/blogs/lidp/2012/08/08/findings-post-2-discipline-matters/ How often do you go to Library? Retrieved from: https://www.thestudentroom.co.uk/showthread.php?t=88094 Public library statistics Retrieved from: http://www.sl.nsw.gov.au/public-library-services/advice- best-practice/public-library-statistics Needsoflibraryusers-ocr.pdf Retrievedfrom: http://authors.library.caltech.edu/38272/6/Needsoflibraryusers-ocr.pdf Part 3_ Library users_ Pew Internet Libraries.html Retrieved from: http://libraries.pewinternet.org/2012/06/22/part-3-library-users/ Student Characteristics and Use of Library Services in the University of Uyo. Retrieved from: http://www.webpages.uidaho.edu/~mbolin/omehia-obi-okon.htm Student Perceptions and Expectations of Library Services Quality. Retrieved from: http://dc.etsu.edu/cgi/viewcontent.cgi?article=3188&context=etd Top Four Reasons Students Use Their College Library. Retrieved from: https://blog.cengage.com/top-four-reasons-students-use their -college-library/ User Groups in Academic Libraries-bibliographic instruction, disabled students, undergraduates, graduate, mission statement.html Retrieved from: http://www.moyak.com/papers/library- reference-service-users.html Use and non-use of public libraries in the information age_ A logistic regression analysis of household characteristics and library services variables(PDF download Available).html Retrieved from: https://www.researchgate.net/publication/238381563_Use_and_non- use_of_public_libraries_in_the_information_age_A_logistic_regression_analysis_of_hous ehold_characteristics_and_library_services_variables
- 10. Weave_ Journal of Library User Experience.html Retrieved from http://weaveux.org/ Why Students Should Go To The Library. Retrieved from: https://gradeslam.org/blog/why- students-should-go-to-the-library