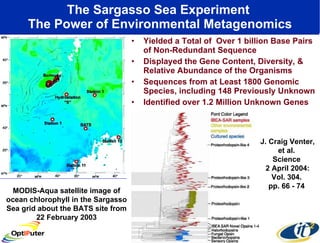
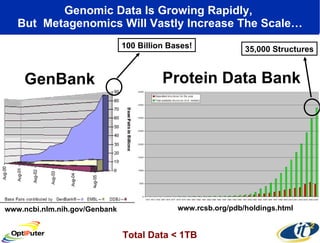
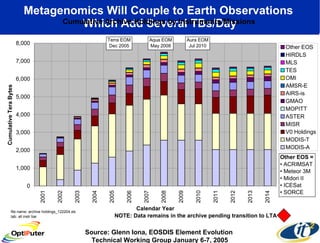
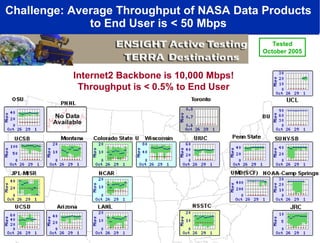
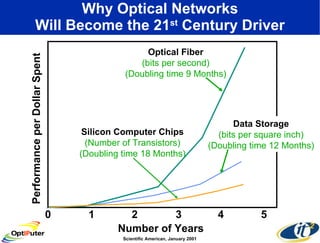
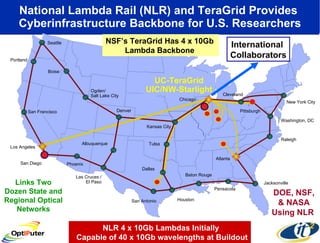
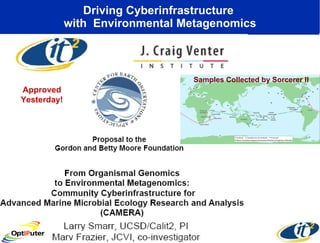
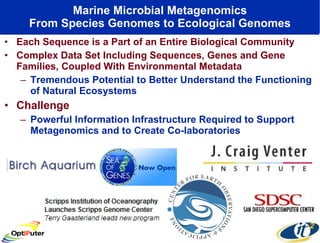
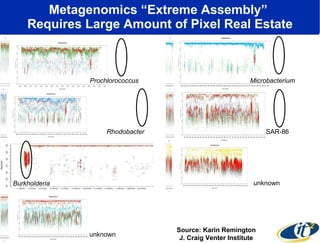
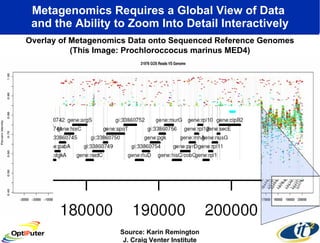
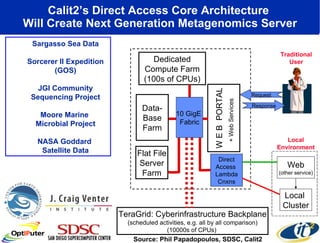
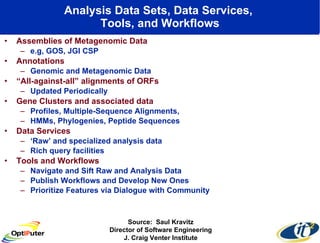
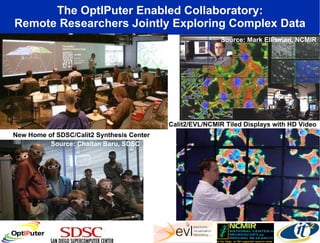
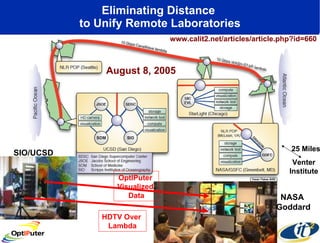
“ Building an Information Infrastructure to Support Genetic Sciences " Invited Talk Celebrating a Decade of Genome Sequencing  UCSD La Jolla, CA December 6, 2005 Dr. Larry Smarr Director, California Institute for Telecommunications and Information Technology; Harry E. Gruber Professor,  Dept. of Computer Science and Engineering Jacobs School of Engineering, UCSD
The Sargasso Sea Experiment  The Power of Environmental Metagenomics Yielded a Total of  Over 1 billion Base Pairs of Non-Redundant Sequence Displayed the Gene Content, Diversity, & Relative Abundance of the Organisms  Sequences from at Least 1800 Genomic Species, including 148 Previously Unknown Identified over 1.2 Million Unknown Genes MODIS-Aqua satellite image of ocean chlorophyll in the Sargasso Sea grid about the BATS site from 22 February 2003 J. Craig Venter, et al.  Science  2 April 2004: Vol. 304.  pp. 66 - 74
Genomic Data Is Growing Rapidly,  But  Metagenomics Will Vastly Increase The Scale… GenBank Protein Data Bank www.rcsb.org/pdb/holdings.html www.ncbi.nlm.nih.gov/Genbank 100 Billion Bases! Total Data < 1TB 35,000 Structures
Metagenomics Will Couple to Earth Observations  Which Add Several TBs/Day Source: Glenn Iona, EOSDIS Element Evolution  Technical Working Group January 6-7, 2005
Challenge: Average Throughput of NASA Data Products  to End User is < 50 Mbps  Tested October 2005 http://ensight.eos.nasa.gov/Missions/icesat/index.shtml Internet2 Backbone is 10,000 Mbps! Throughput is < 0.5% to End User
Why Optical Networks Will Become the 21 st  Century Driver Scientific American, January 2001 Number of Years 0 1 2 3 4 5 Performance per Dollar Spent Data Storage (bits per square inch) (Doubling time 12 Months) Optical Fiber (bits per second) (Doubling time 9 Months) Silicon Computer Chips (Number of Transistors) (Doubling time 18 Months)
Solution: Individual 1 or 10Gbps Lightpaths  -- “Lambdas on Demand” ( WDM) Source: Steve Wallach, Chiaro Networks “ Lambdas”
National Lambda Rail (NLR) and TeraGrid Provides  Cyberinfrastructure Backbone for U.S. Researchers San Francisco Pittsburgh Cleveland San Diego Los Angeles Portland Seattle Pensacola Baton Rouge Houston San Antonio Las Cruces / El Paso Phoenix New York City Washington, DC Raleigh Jacksonville Dallas Tulsa Atlanta Kansas City Denver Ogden/ Salt Lake City Boise Albuquerque UC-TeraGrid UIC/NW-Starlight Chicago International  Collaborators NLR 4 x 10Gb Lambdas Initially Capable of 40 x 10Gb wavelengths at Buildout NSF’s TeraGrid Has 4 x 10Gb  Lambda Backbone  Links Two Dozen State and Regional Optical Networks DOE, NSF, & NASA Using NLR
September 26-30, 2005 Calit2 @ University of California, San Diego California Institute for Telecommunications and Information Technology Calit2@UCSD Is Connected  to the World at 10,000 Mbps T   H   E  G   L   O   B   A   L  L   A   M   B   D   A  I   N   T   E   G   R   A   T   E   D  F   A   C   I   L   I   T   Y   Maxine Brown, Tom DeFanti, Co-Chairs www.igrid2005.org 50 Demonstrations, 20 Counties, 10 Gbps/Demo i Grid  2005
Prototyping Cabled Ocean Observatories Enabling  High Definition Video Exploration of Deep Sea Vents Source John Delaney & Deborah Kelley, UWash Canadian-U.S. Collaboration
A Near Future Metagenomics  Fiber Optic Cable Observatory Source John Delaney, UWash
Calit2 Brings Computer Scientists and Engineers  Together with Biomedical Researchers Some Areas of Concentration: Metagenomics Genomic Analysis of Organisms Evolution of Genomes Cancer Genomics Human Genomic Variation and Disease Mitochondrial Evolution Proteomics Computational Biology Information Theory and Biological Systems UC San Diego UC Irvine 1200 Researchers in Two Buildings
Driving Cyberinfrastructure  with  Environmental Metagenomics Samples Collected by Sorcerer II Approved Yesterday!
Marine Microbial Metagenomics From Species Genomes to Ecological Genomes Each Sequence is a Part of an Entire Biological Community Complex Data Set Including Sequences, Genes and Gene Families, Coupled With Environmental Metadata Tremendous Potential to Better Understand the Functioning of Natural Ecosystems Challenge Powerful Information Infrastructure Required to Support Metagenomics and to Create Co-laboratories Scripps Genome Center
Metagenomics “Extreme Assembly”  Requires Large Amount of Pixel Real Estate Source: Karin Remington J. Craig Venter Institute Prochlorococcus Microbacterium Burkholderia Rhodobacter SAR-86 unknown unknown
Metagenomics Requires a Global View of Data  and the Ability to Zoom Into Detail Interactively Overlay of Metagenomics Data onto Sequenced Reference Genomes (This Image: Prochloroccocus marinus MED4) Source: Karin Remington J. Craig Venter Institute
The OptIPuter – Creating High Resolution Portals  Over Dedicated Optical Channels to Global Science Data Green: Purkinje Cells Red: Glial Cells Light Blue: Nuclear DNA Source: Mark Ellisman, David Lee, Jason Leigh 300 MPixel Image! Calit2 (UCSD, UCI) and UIC Lead Campuses—Larry Smarr PI Partners: SDSC, USC, SDSU, NW, TA&M, UvA, SARA, KISTI, AIST
Scalable Displays Allow Both  Global Content and Fine Detail Source: Mark Ellisman, David Lee, Jason Leigh 30 MPixel SunScreen Display Driven by a 20-node Sun Opteron Visualization Cluster
Allows for Interactive Zooming  from Cerebellum to Individual Neurons Source: Mark Ellisman, David Lee, Jason Leigh
Calit2 Intends to Jump Beyond Traditional Web-Accessible Databases Data  Backend (DB, Files) W E B  PORTAL (pre-filtered,  queries metadata) Response Request + many others Source: Phil Papadopoulos, SDSC, Calit2 BIRN PDB NCBI Genbank
Calit2’s Direct Access Core Architecture  Will Create Next Generation Metagenomics Server Traditional User Response Request Source: Phil Papadopoulos, SDSC, Calit2 + Web Services Sargasso Sea Data Sorcerer II Expedition (GOS) JGI Community Sequencing Project Moore Marine  Microbial Project NASA Goddard  Satellite Data Flat File Server Farm W E B  PORTAL Dedicated Compute Farm (100s of CPUs) TeraGrid: Cyberinfrastructure Backplane (scheduled activities, e.g. all by all comparison) (10000s of CPUs)  Web (other service) Local  Cluster Local Environment Direct Access  Lambda Cnxns Data- Base Farm 10 GigE  Fabric
Analysis Data Sets, Data Services,  Tools, and Workflows Assemblies of Metagenomic Data e.g, GOS, JGI CSP Annotations Genomic and Metagenomic Data “ All-against-all” alignments of ORFs Updated Periodically Gene Clusters and associated data Profiles, Multiple-Sequence Alignments,  HMMs, Phylogenies, Peptide Sequences Data Services ‘ Raw’ and specialized analysis data Rich query facilities Tools and Workflows Navigate and Sift Raw and Analysis Data Publish Workflows and Develop New Ones Prioritize Features via Dialogue with Community Source:  Saul Kravitz Director of Software Engineering J. Craig Venter Institute
The OptIPuter Enabled Collaboratory: Remote Researchers Jointly Exploring Complex Data New Home of SDSC/Calit2 Synthesis Center Calit2/EVL/NCMIR Tiled Displays with HD Video Source: Chaitan Baru, SDSC Source: Mark Ellisman, NCMIR
Eliminating Distance  to Unify Remote Laboratories SIO/UCSD NASA  Goddard www.calit2.net/articles/article.php?id=660 August 8, 2005 HDTV Over  Lambda OptIPuter  Visualized  Data 25 Miles Venter Institute
Looking Back Nearly 4 Billion Years In the Evolution of Microbe Genomics Science Falkowski and Vargas 304 (5667): 58

Building an Information Infrastructure to Support Genetic Sciences

  • 1.
    “ Building anInformation Infrastructure to Support Genetic Sciences &quot; Invited Talk Celebrating a Decade of Genome Sequencing UCSD La Jolla, CA December 6, 2005 Dr. Larry Smarr Director, California Institute for Telecommunications and Information Technology; Harry E. Gruber Professor, Dept. of Computer Science and Engineering Jacobs School of Engineering, UCSD
  • 2.
    The Sargasso SeaExperiment The Power of Environmental Metagenomics Yielded a Total of Over 1 billion Base Pairs of Non-Redundant Sequence Displayed the Gene Content, Diversity, & Relative Abundance of the Organisms Sequences from at Least 1800 Genomic Species, including 148 Previously Unknown Identified over 1.2 Million Unknown Genes MODIS-Aqua satellite image of ocean chlorophyll in the Sargasso Sea grid about the BATS site from 22 February 2003 J. Craig Venter, et al. Science 2 April 2004: Vol. 304. pp. 66 - 74
  • 3.
    Genomic Data IsGrowing Rapidly, But Metagenomics Will Vastly Increase The Scale… GenBank Protein Data Bank www.rcsb.org/pdb/holdings.html www.ncbi.nlm.nih.gov/Genbank 100 Billion Bases! Total Data < 1TB 35,000 Structures
  • 4.
    Metagenomics Will Coupleto Earth Observations Which Add Several TBs/Day Source: Glenn Iona, EOSDIS Element Evolution Technical Working Group January 6-7, 2005
  • 5.
    Challenge: Average Throughputof NASA Data Products to End User is < 50 Mbps Tested October 2005 http://ensight.eos.nasa.gov/Missions/icesat/index.shtml Internet2 Backbone is 10,000 Mbps! Throughput is < 0.5% to End User
  • 6.
    Why Optical NetworksWill Become the 21 st Century Driver Scientific American, January 2001 Number of Years 0 1 2 3 4 5 Performance per Dollar Spent Data Storage (bits per square inch) (Doubling time 12 Months) Optical Fiber (bits per second) (Doubling time 9 Months) Silicon Computer Chips (Number of Transistors) (Doubling time 18 Months)
  • 7.
    Solution: Individual 1or 10Gbps Lightpaths -- “Lambdas on Demand” ( WDM) Source: Steve Wallach, Chiaro Networks “ Lambdas”
  • 8.
    National Lambda Rail(NLR) and TeraGrid Provides Cyberinfrastructure Backbone for U.S. Researchers San Francisco Pittsburgh Cleveland San Diego Los Angeles Portland Seattle Pensacola Baton Rouge Houston San Antonio Las Cruces / El Paso Phoenix New York City Washington, DC Raleigh Jacksonville Dallas Tulsa Atlanta Kansas City Denver Ogden/ Salt Lake City Boise Albuquerque UC-TeraGrid UIC/NW-Starlight Chicago International Collaborators NLR 4 x 10Gb Lambdas Initially Capable of 40 x 10Gb wavelengths at Buildout NSF’s TeraGrid Has 4 x 10Gb Lambda Backbone Links Two Dozen State and Regional Optical Networks DOE, NSF, & NASA Using NLR
  • 9.
    September 26-30, 2005Calit2 @ University of California, San Diego California Institute for Telecommunications and Information Technology Calit2@UCSD Is Connected to the World at 10,000 Mbps T H E G L O B A L L A M B D A I N T E G R A T E D F A C I L I T Y Maxine Brown, Tom DeFanti, Co-Chairs www.igrid2005.org 50 Demonstrations, 20 Counties, 10 Gbps/Demo i Grid 2005
  • 10.
    Prototyping Cabled OceanObservatories Enabling High Definition Video Exploration of Deep Sea Vents Source John Delaney & Deborah Kelley, UWash Canadian-U.S. Collaboration
  • 11.
    A Near FutureMetagenomics Fiber Optic Cable Observatory Source John Delaney, UWash
  • 12.
    Calit2 Brings ComputerScientists and Engineers Together with Biomedical Researchers Some Areas of Concentration: Metagenomics Genomic Analysis of Organisms Evolution of Genomes Cancer Genomics Human Genomic Variation and Disease Mitochondrial Evolution Proteomics Computational Biology Information Theory and Biological Systems UC San Diego UC Irvine 1200 Researchers in Two Buildings
  • 13.
    Driving Cyberinfrastructure with Environmental Metagenomics Samples Collected by Sorcerer II Approved Yesterday!
  • 14.
    Marine Microbial MetagenomicsFrom Species Genomes to Ecological Genomes Each Sequence is a Part of an Entire Biological Community Complex Data Set Including Sequences, Genes and Gene Families, Coupled With Environmental Metadata Tremendous Potential to Better Understand the Functioning of Natural Ecosystems Challenge Powerful Information Infrastructure Required to Support Metagenomics and to Create Co-laboratories Scripps Genome Center
  • 15.
    Metagenomics “Extreme Assembly” Requires Large Amount of Pixel Real Estate Source: Karin Remington J. Craig Venter Institute Prochlorococcus Microbacterium Burkholderia Rhodobacter SAR-86 unknown unknown
  • 16.
    Metagenomics Requires aGlobal View of Data and the Ability to Zoom Into Detail Interactively Overlay of Metagenomics Data onto Sequenced Reference Genomes (This Image: Prochloroccocus marinus MED4) Source: Karin Remington J. Craig Venter Institute
  • 17.
    The OptIPuter –Creating High Resolution Portals Over Dedicated Optical Channels to Global Science Data Green: Purkinje Cells Red: Glial Cells Light Blue: Nuclear DNA Source: Mark Ellisman, David Lee, Jason Leigh 300 MPixel Image! Calit2 (UCSD, UCI) and UIC Lead Campuses—Larry Smarr PI Partners: SDSC, USC, SDSU, NW, TA&M, UvA, SARA, KISTI, AIST
  • 18.
    Scalable Displays AllowBoth Global Content and Fine Detail Source: Mark Ellisman, David Lee, Jason Leigh 30 MPixel SunScreen Display Driven by a 20-node Sun Opteron Visualization Cluster
  • 19.
    Allows for InteractiveZooming from Cerebellum to Individual Neurons Source: Mark Ellisman, David Lee, Jason Leigh
  • 20.
    Calit2 Intends toJump Beyond Traditional Web-Accessible Databases Data Backend (DB, Files) W E B PORTAL (pre-filtered, queries metadata) Response Request + many others Source: Phil Papadopoulos, SDSC, Calit2 BIRN PDB NCBI Genbank
  • 21.
    Calit2’s Direct AccessCore Architecture Will Create Next Generation Metagenomics Server Traditional User Response Request Source: Phil Papadopoulos, SDSC, Calit2 + Web Services Sargasso Sea Data Sorcerer II Expedition (GOS) JGI Community Sequencing Project Moore Marine Microbial Project NASA Goddard Satellite Data Flat File Server Farm W E B PORTAL Dedicated Compute Farm (100s of CPUs) TeraGrid: Cyberinfrastructure Backplane (scheduled activities, e.g. all by all comparison) (10000s of CPUs) Web (other service) Local Cluster Local Environment Direct Access Lambda Cnxns Data- Base Farm 10 GigE Fabric
  • 22.
    Analysis Data Sets,Data Services, Tools, and Workflows Assemblies of Metagenomic Data e.g, GOS, JGI CSP Annotations Genomic and Metagenomic Data “ All-against-all” alignments of ORFs Updated Periodically Gene Clusters and associated data Profiles, Multiple-Sequence Alignments, HMMs, Phylogenies, Peptide Sequences Data Services ‘ Raw’ and specialized analysis data Rich query facilities Tools and Workflows Navigate and Sift Raw and Analysis Data Publish Workflows and Develop New Ones Prioritize Features via Dialogue with Community Source: Saul Kravitz Director of Software Engineering J. Craig Venter Institute
  • 23.
    The OptIPuter EnabledCollaboratory: Remote Researchers Jointly Exploring Complex Data New Home of SDSC/Calit2 Synthesis Center Calit2/EVL/NCMIR Tiled Displays with HD Video Source: Chaitan Baru, SDSC Source: Mark Ellisman, NCMIR
  • 24.
    Eliminating Distance to Unify Remote Laboratories SIO/UCSD NASA Goddard www.calit2.net/articles/article.php?id=660 August 8, 2005 HDTV Over Lambda OptIPuter Visualized Data 25 Miles Venter Institute
  • 25.
    Looking Back Nearly4 Billion Years In the Evolution of Microbe Genomics Science Falkowski and Vargas 304 (5667): 58