
Recommended
Recommended
More Related Content
What's hot
What's hot (20)
Similar to OECD-FAO Agricultural Outlook 2023-2032
Similar to OECD-FAO Agricultural Outlook 2023-2032 (20)
Recently uploaded
Recently uploaded (20)
OECD-FAO Agricultural Outlook 2023-2032
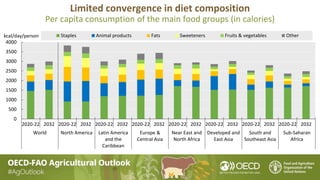
- 1. Limited convergence in diet composition Per capita consumption of the main food groups (in calories) 0 500 1000 1500 2000 2500 3000 3500 4000 2020-22 2032 2020-22 2032 2020-22 2032 2020-22 2032 2020-22 2032 2020-22 2032 2020-22 2032 2020-22 2032 World North America Latin America and the Caribbean Europe & Central Asia Near East and North Africa Developed and East Asia South and Southeast Asia Sub-Saharan Africa kcal/day/person Staples Animal products Fats Sweeteners Fruits & vegetables Other
- 2. Persistent differences across income group in the composition of protein sources for food consumption 0 10 20 30 40 50 60 70 0 20 40 60 80 100 120 2020-22 2032 2020-22 2032 2020-22 2032 2020-22 2032 High-income countries Upper middle-income countries Lower middle-income countries Low-income countries % g/person/day Staples Other vegetal Meat Dairy Egg Fish % animal protein in total protein availability (right axis)
- 3. 0.00 0.50 1.00 1.50 2.00 2.50 3.00 3.50 4.00 High-income countries Upper middle-income countries Lower middle-income countries Low-income countries % p.a. Non-ruminants Aquaculture Ruminants Milk Feed Higher production efficiency results in slow growth of feed use Annual change in feed use and in livestock production, 2023-2032
- 4. Higher blending rates and mandates to increase biofuel use in key consuming countries, while declining transport fuel demand and reduced policy incentives to decrease it in others 0 5 10 15 20 25 30 35 2010-12 to 2020-22 2020-22 to 2032 2010-12 to 2020-22 2020-22 to 2032 Ethanol Biodiesel Bln L Brazil United States European Union China India Indonesia Other
- 5. Middle- and low-income countries to continue to drive global agricultural production growth 0 5 10 15 20 25 30 35 0 100 200 300 400 500 600 700 800 2020-22 2032 2020-22 2032 2020-22 2032 2020-22 2032 2020-22 2032 2020-22 2032 2020-22 2032 2020-22 2032 India China Asia Pacific (excl. China and India) Sub-Saharan Africa Near East and North Africa Europe and Central Asia North America Latin America and the Caribbean % Bln 2014-16 USD Crops Livestock Fisheries Growth in production, 2020-22 to 2032 (right axis)
- 6. Crop production to be driven by productivity improvements rather than expansion of land use -100 0 100 200 300 400 500 600 -20 -10 0 10 20 30 40 50 2013-22 2023-32 2013-22 2023-32 2013-22 2023-32 2013-22 2023-32 2013-22 2023-32 2013-22 2023-32 Asia Pacific Sub-Saharan Africa Near East and North Africa Europe and Central Asia North America Latin America and the Caribbean Mha % Growth in land use Growth in multi-cropped land Growth in yields Area harvested in 2032 (right axis)
- 7. Surge in agricultural input prices raises concerns about global food security 1% increase in fertiliser prices would increase commodity prices by 0.2% 0 2 4 6 8 10 12 Average Wheat Maize Other coarse grains Rice Soybean Other oilseeds Vegetable oils Protein meals Sugar Cotton Poultry Pigmeat Beef Sheep Butter Cheese Whole milk powder Skim milk powder Cereals Oilseeds Meat Dairy %
- 8. The carbon intensity of agricultural production is projected to decline Annual change in agricultural production and direct GHG emissions, 2023 to 2032 0.0 0.5 1.0 1.5 2.0 2.5 Asia Pacific Sub-Saharan Africa Near East and North Africa Europe and Central Asia North America Latin America and Caribbean % p.a. Growth in agricultural production Growth in GHG emissions
- 9. Growing differentiation between net exporting and net importing regions Net trade by region, in constant value -120 -70 -20 30 80 North America Latin America and the Caribbean Europe and Central Asia South and Southeast Asia Sub Saharan Africa Near East and North Africa Developed and East Asia Bln USD 2000-02 2010-12 2020-22 2032
- 10. Real prices of agricultural commodities are expected to continue declining due to rising productivity 0 50 100 150 200 250 300 350 400 450 500 1960 1962 1964 1966 1968 1970 1972 1974 1976 1978 1980 1982 1984 1986 1988 1990 1992 1994 1996 1998 2000 2002 2004 2006 2008 2010 2012 2014 2016 2018 2020 2022 2024 2026 2028 2030 2032 (2019=100) Soybeans Wheat Maize Beef Pork
Editor's Notes
- Note: The population growth component is calculated assuming per capita demand remains constant at the level of the year preceding the decade. Growth rates refer to total demand (for food, feed and other uses).
- Staples include cereals, pulses, and roots and tubers.
- Note: Ruminants include beef and veal and sheepmeat. Non-ruminants include poultry and pigmeat. The bars show annual changes in production volumes for the different livestock products. The black line shows annual changes in feed use.
- Feed to production ratio Note: This ratio includes only feed prepared from cereals, oilseeds and a number of by-products, it therefore slightly overestimates the feed efficiency of the livestock and aquaculture sector. Pasture-based cattle and sheep convert feed that cannot be accessed directly by humans into meat and milk. Similarly, pigs and poultry are still being raised on organic residues in non-commercial operations. Simple forms of aquaculture rely solely on naturally available feed. Because the nutritional value of these feed sources is difficult to quantify, it is excluded from the above calculation.
- Note: Estimates are based on historical time series from the FAOSTAT Value of Agricultural Production domain which are extended with the Outlook database. Remaining products are trend-extended. The Net Value of Production uses own estimates for internal seed and feed use. Values are measured at constant USD of the period 2014-2016.
- Note: Figure shows the decomposition of total production growth (2012-21 and 2022-31) into growth in land use, land intensification through growth in multi-cropped land, and growth in yields. It covers the following crops: cotton, maize, other coarse grains, other oilseeds, pulses, rice, roots and tubers, soybean, sugarbeet, sugarcane, wheat and palm oil.
- This figure shows projected annual growth in direct GHG emissions from agriculture together with annual growth in the estimated net value of production of crop and livestock commodities covered in the Outlook (measured in constant USD 2014-16 prices). Estimates are based on historical time series from the FAOSTAT Emissions Agriculture databases which are extended with the Outlook database. CO2 equivalents are calculated using the global warming potential of each gas as reported in the IPCC Sixth Assessment Report (AR6). Emission types that are not related to any Outlook variable (organic soil cultivation and burning Savannahs) are kept constant at their latest available value. The category ''other'' includes direct GHG emissions from burning crop residues, burning savanna, crop residues, and cultivation of organic soils. The Net Value of Production uses own estimates for internal seed and feed use.
- Note: Net trade (exports minus imports) of commodities covered in the Agricultural Outlook, measured in constant 2014-16 USD. Net trade figures include intra regional trade but exclude intra-EU trade. The regions Developed and East Asia, and South and South East Asia are defined as in Chapter 2.
- Historical data for soybeans, maize and beef from World Bank, "World Commodity Price Data" (1960-1989). Historical data for pork from USDA QuickStats (1960-1989).