
Recommended
Recommended
More Related Content
What's hot
What's hot (20)
Similar to OECD-FAO Agricultural Outlook 2017
Similar to OECD-FAO Agricultural Outlook 2017 (20)
Recently uploaded
Recently uploaded (20)
OECD-FAO Agricultural Outlook 2017
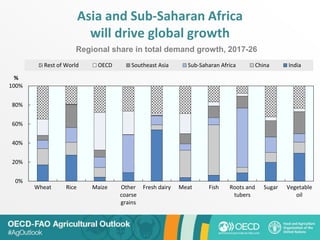
- 1. Asia and Sub-Saharan Africa will drive global growth 0% 20% 40% 60% 80% 100% Wheat Rice Maize Other coarse grains Fresh dairy Meat Fish Roots and tubers Sugar Vegetable oil % Rest of World OECD Southeast Asia Sub-Saharan Africa China India Regional share in total demand growth, 2017-26
- 2. Asia continues to increase calorie availability per capita 0 500 1000 1500 2000 2500 3000 3500 4000 2006 2016 2026 2006 2016 2026 2006 2016 2026 2006 2016 2026 2006 2016 2026 Sub-Saharan Africa India China Southeast Asia OECD kcal/day/person Other Fish Dairy Sugar Meat Vegetable oils Roots and tubers Cereals
- 3. Convergence in per capita food consumption patterns remains limited 0 20 40 60 80 100 120 Sub-Saharan Africa India China Southeast Asia OECD World kg/cap Fish Sheepmeat Beef and veal Pigmeat Poultry Per capita food consumption, 2026
- 4. Global demand for feed will grow at a slower pace 0 50 100 150 200 250 300 350 2006-16 2016-26 Mt Rest of World OECD Southeast Asia Sub-Saharan Africa China India 0 50 100 150 200 250 300 350 400 450 China European Union United States Brazil Mt 2014-16 2026 Regional share in total demand growth Feed demand in key consuming regions
- 5. Biofuels market is expected to slow down as well 0 20 40 60 80 100 120 140 2000 2005 2010 2015 2020 2025 bln L World ethanol production World biodiesel production 0 2 4 6 8 10 12 14 16 18 20 2000 2005 2010 2015 2020 2025 % Maize Sugarcane Vegetable oil Biofuel production, 2000-26 Biofuel use as % of total demand
- 6. Fish production increases, driven by aquaculture 0 20 40 60 80 100 120 1990 1993 1996 1999 2002 2005 2008 2011 2014 2017 2020 2023 2026 Thousands Aquaculture Total capture Capture for human consumptionMt Global fish production, by source
- 7. Agricultural trade growth is slowing down compared to last decade - 4 - 2 0 2 4 6 8 Wheat Maize Othercoarsegrains Rice Soybean Otheroilseeds Vegetableoils Proteinmeals Whitesugar Rawsugar Poultry Pork Beef Sheep Butter Cheese Skimmilkpowder Wholemilkpowder Fish Ethanol Biodiesel Cotton Cereals Oilseeds Sugar Meat Dairy Biofuels % 2007-16 2017-26 Growth in trade volumes, by commodity
- 8. Agricultural exports are concentrated among a few key suppliers 0 10 20 30 40 50 60 70 80 90 100 % 5th exporter 4th exporter 3rd exporter 2nd exporter 1st exporter Top 5 in 2014-16 Export shares of top 5 exporters in 2026, by commodity
- 9. Real prices are expected to remain at, or below, current levels 40 60 80 100 120 140 160 180 1996 1999 2002 2005 2008 2011 2014 2017 2020 2023 2026 Index (2014-16=100) Cereals Dairy Meat Oilseeds Medium-term evolution of commodity prices in real terms