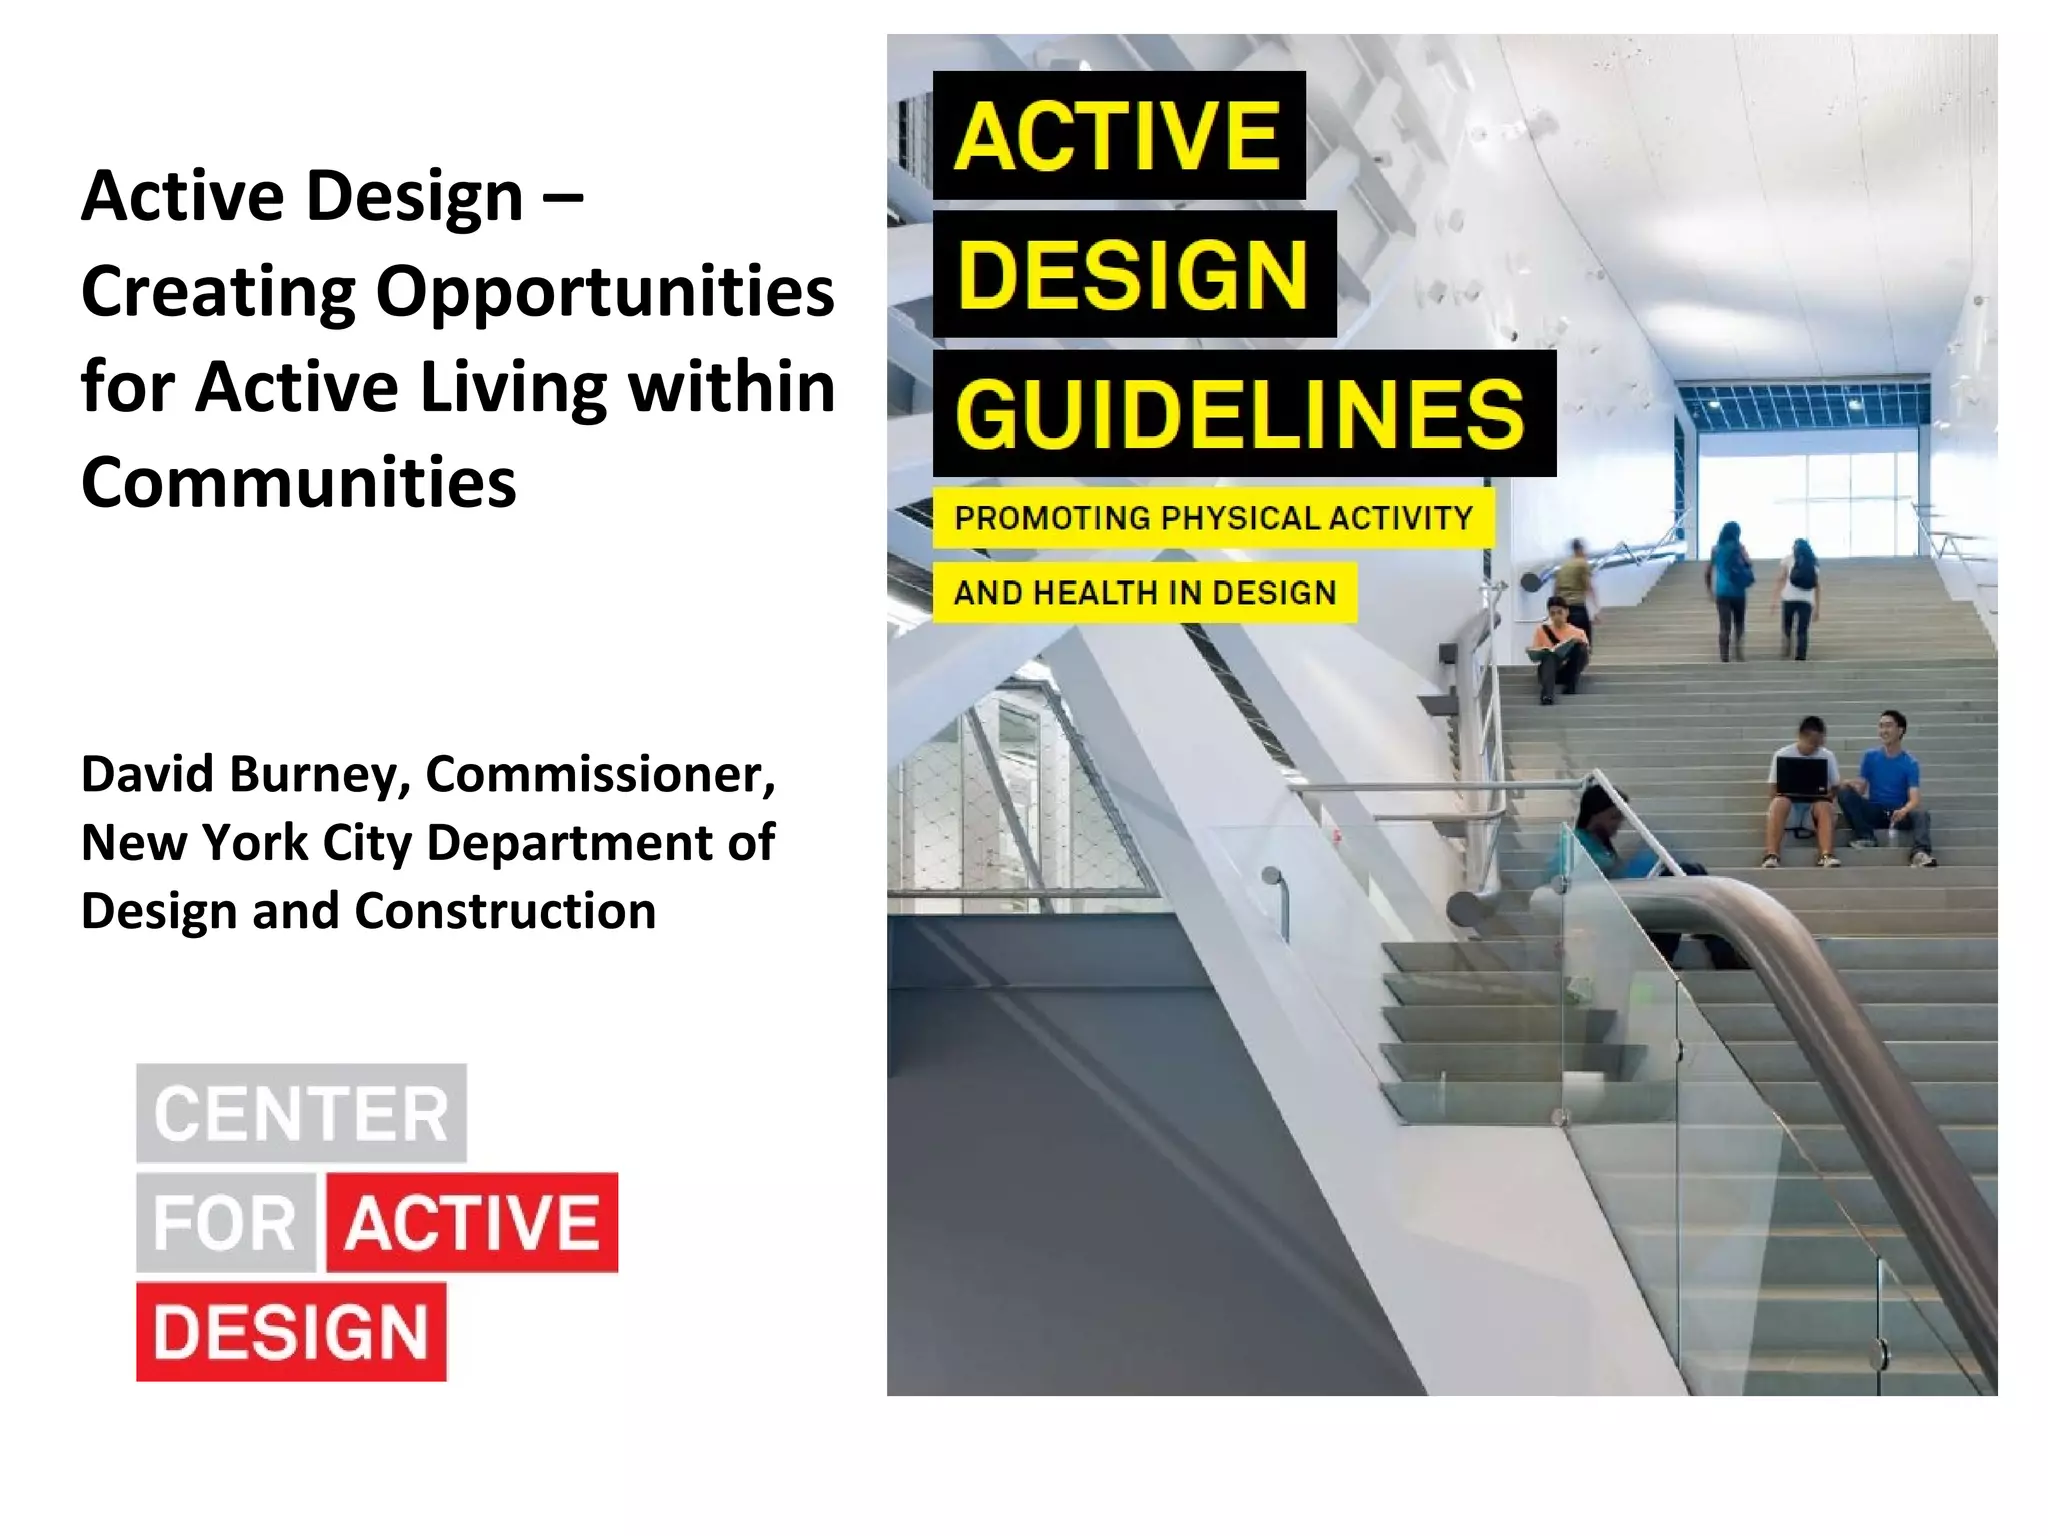
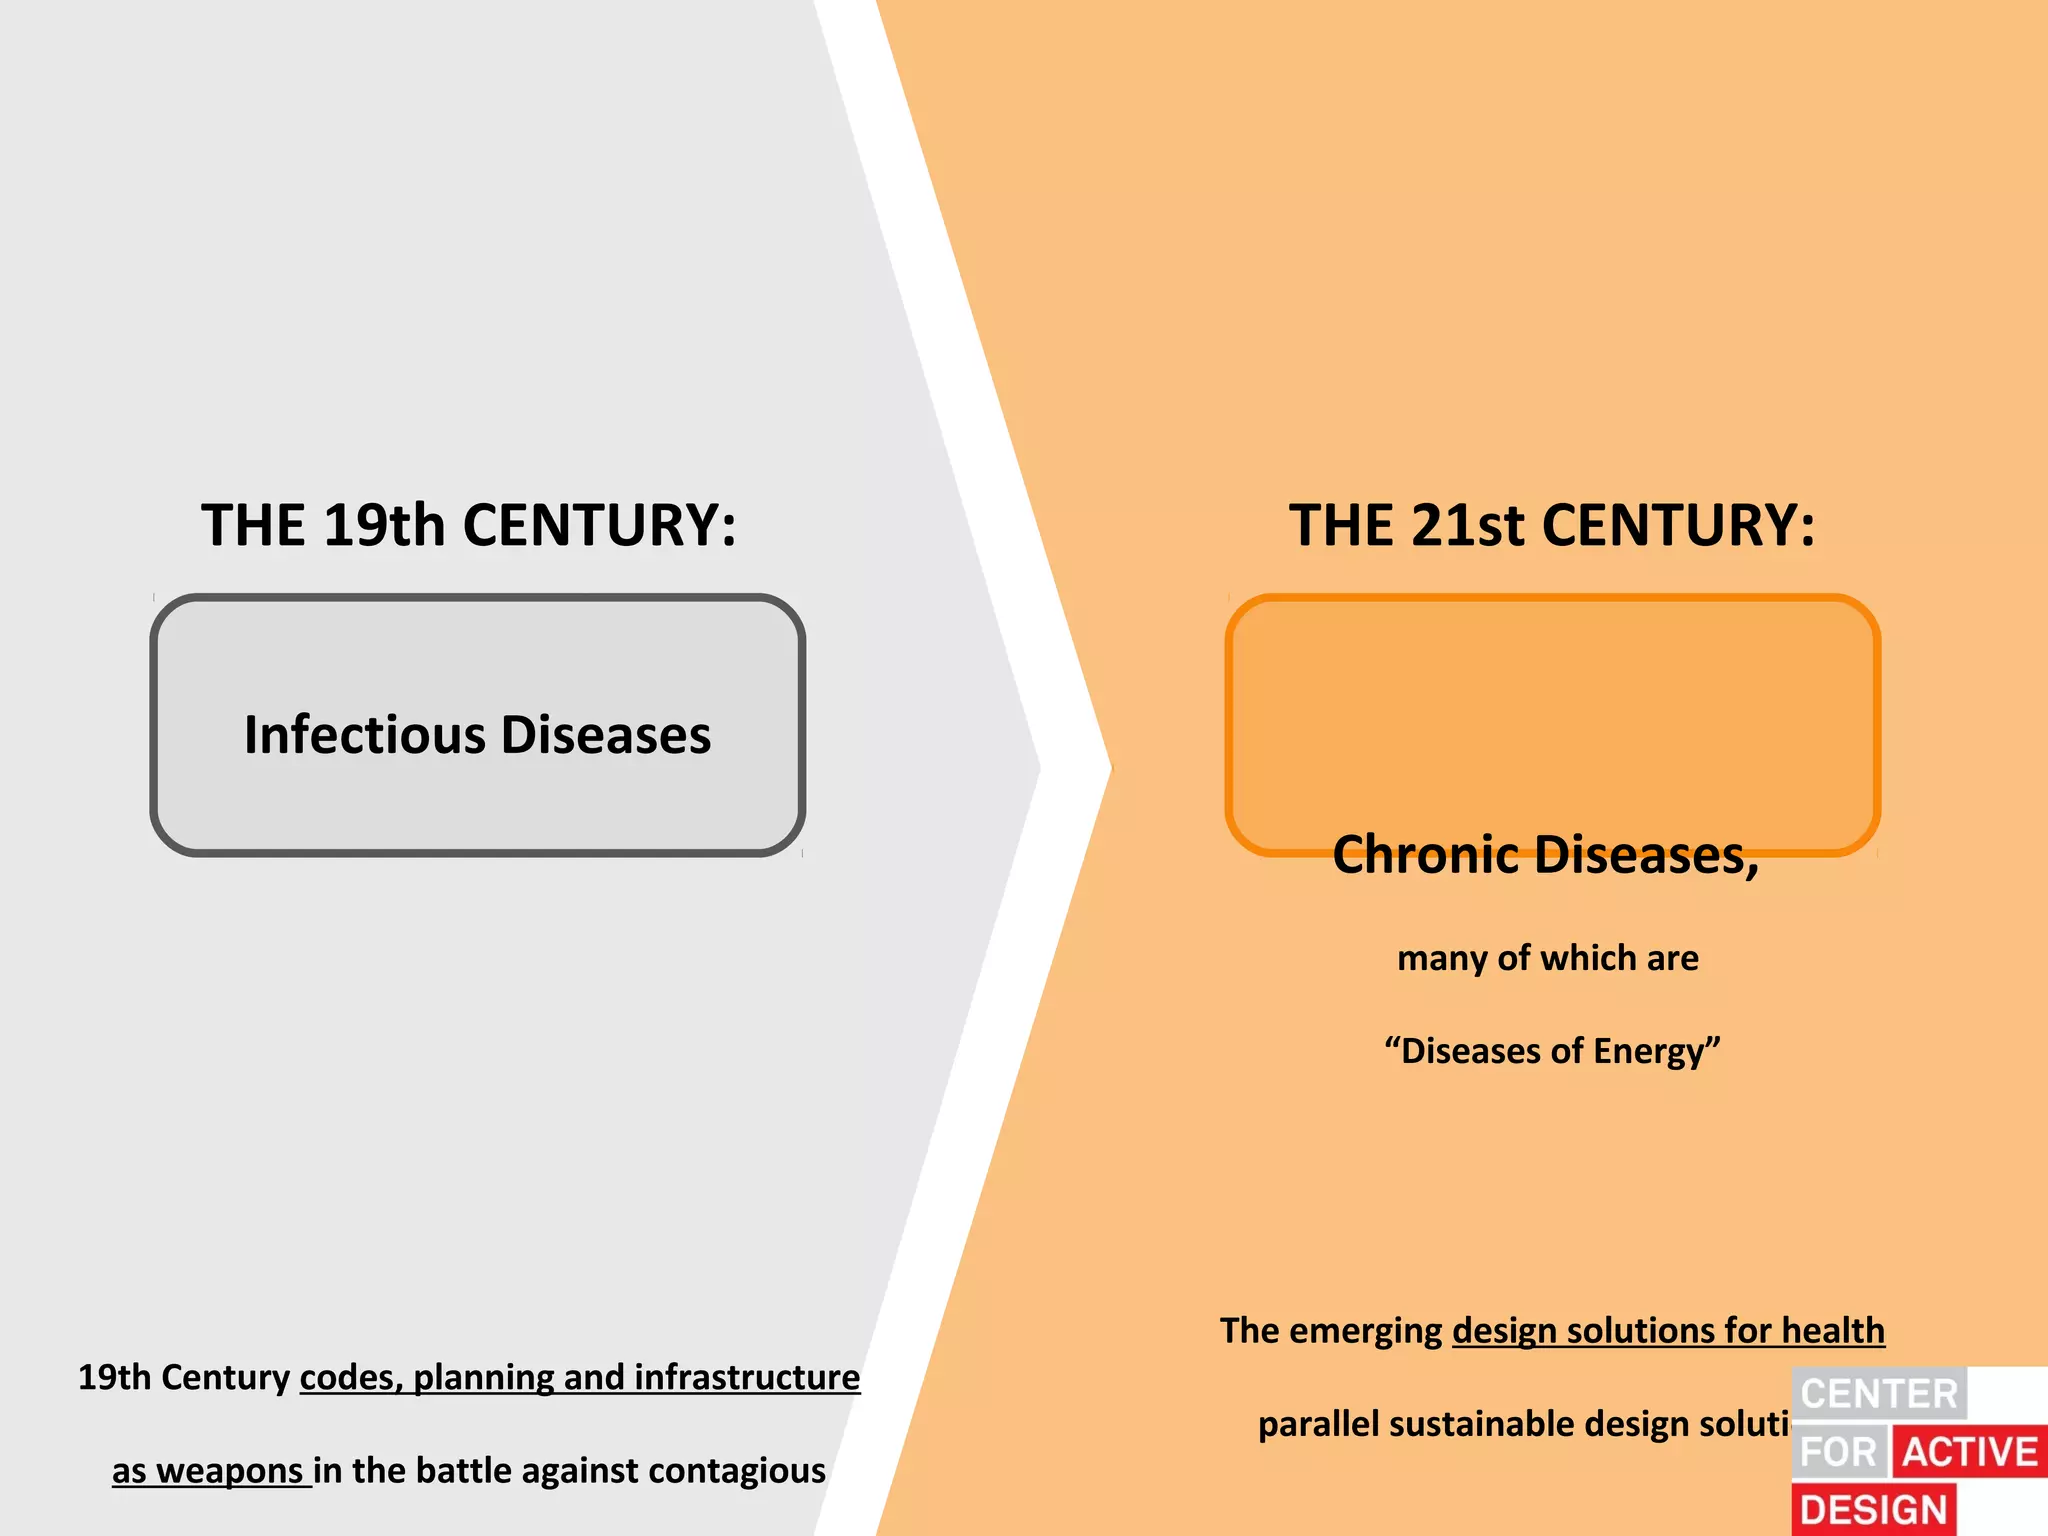
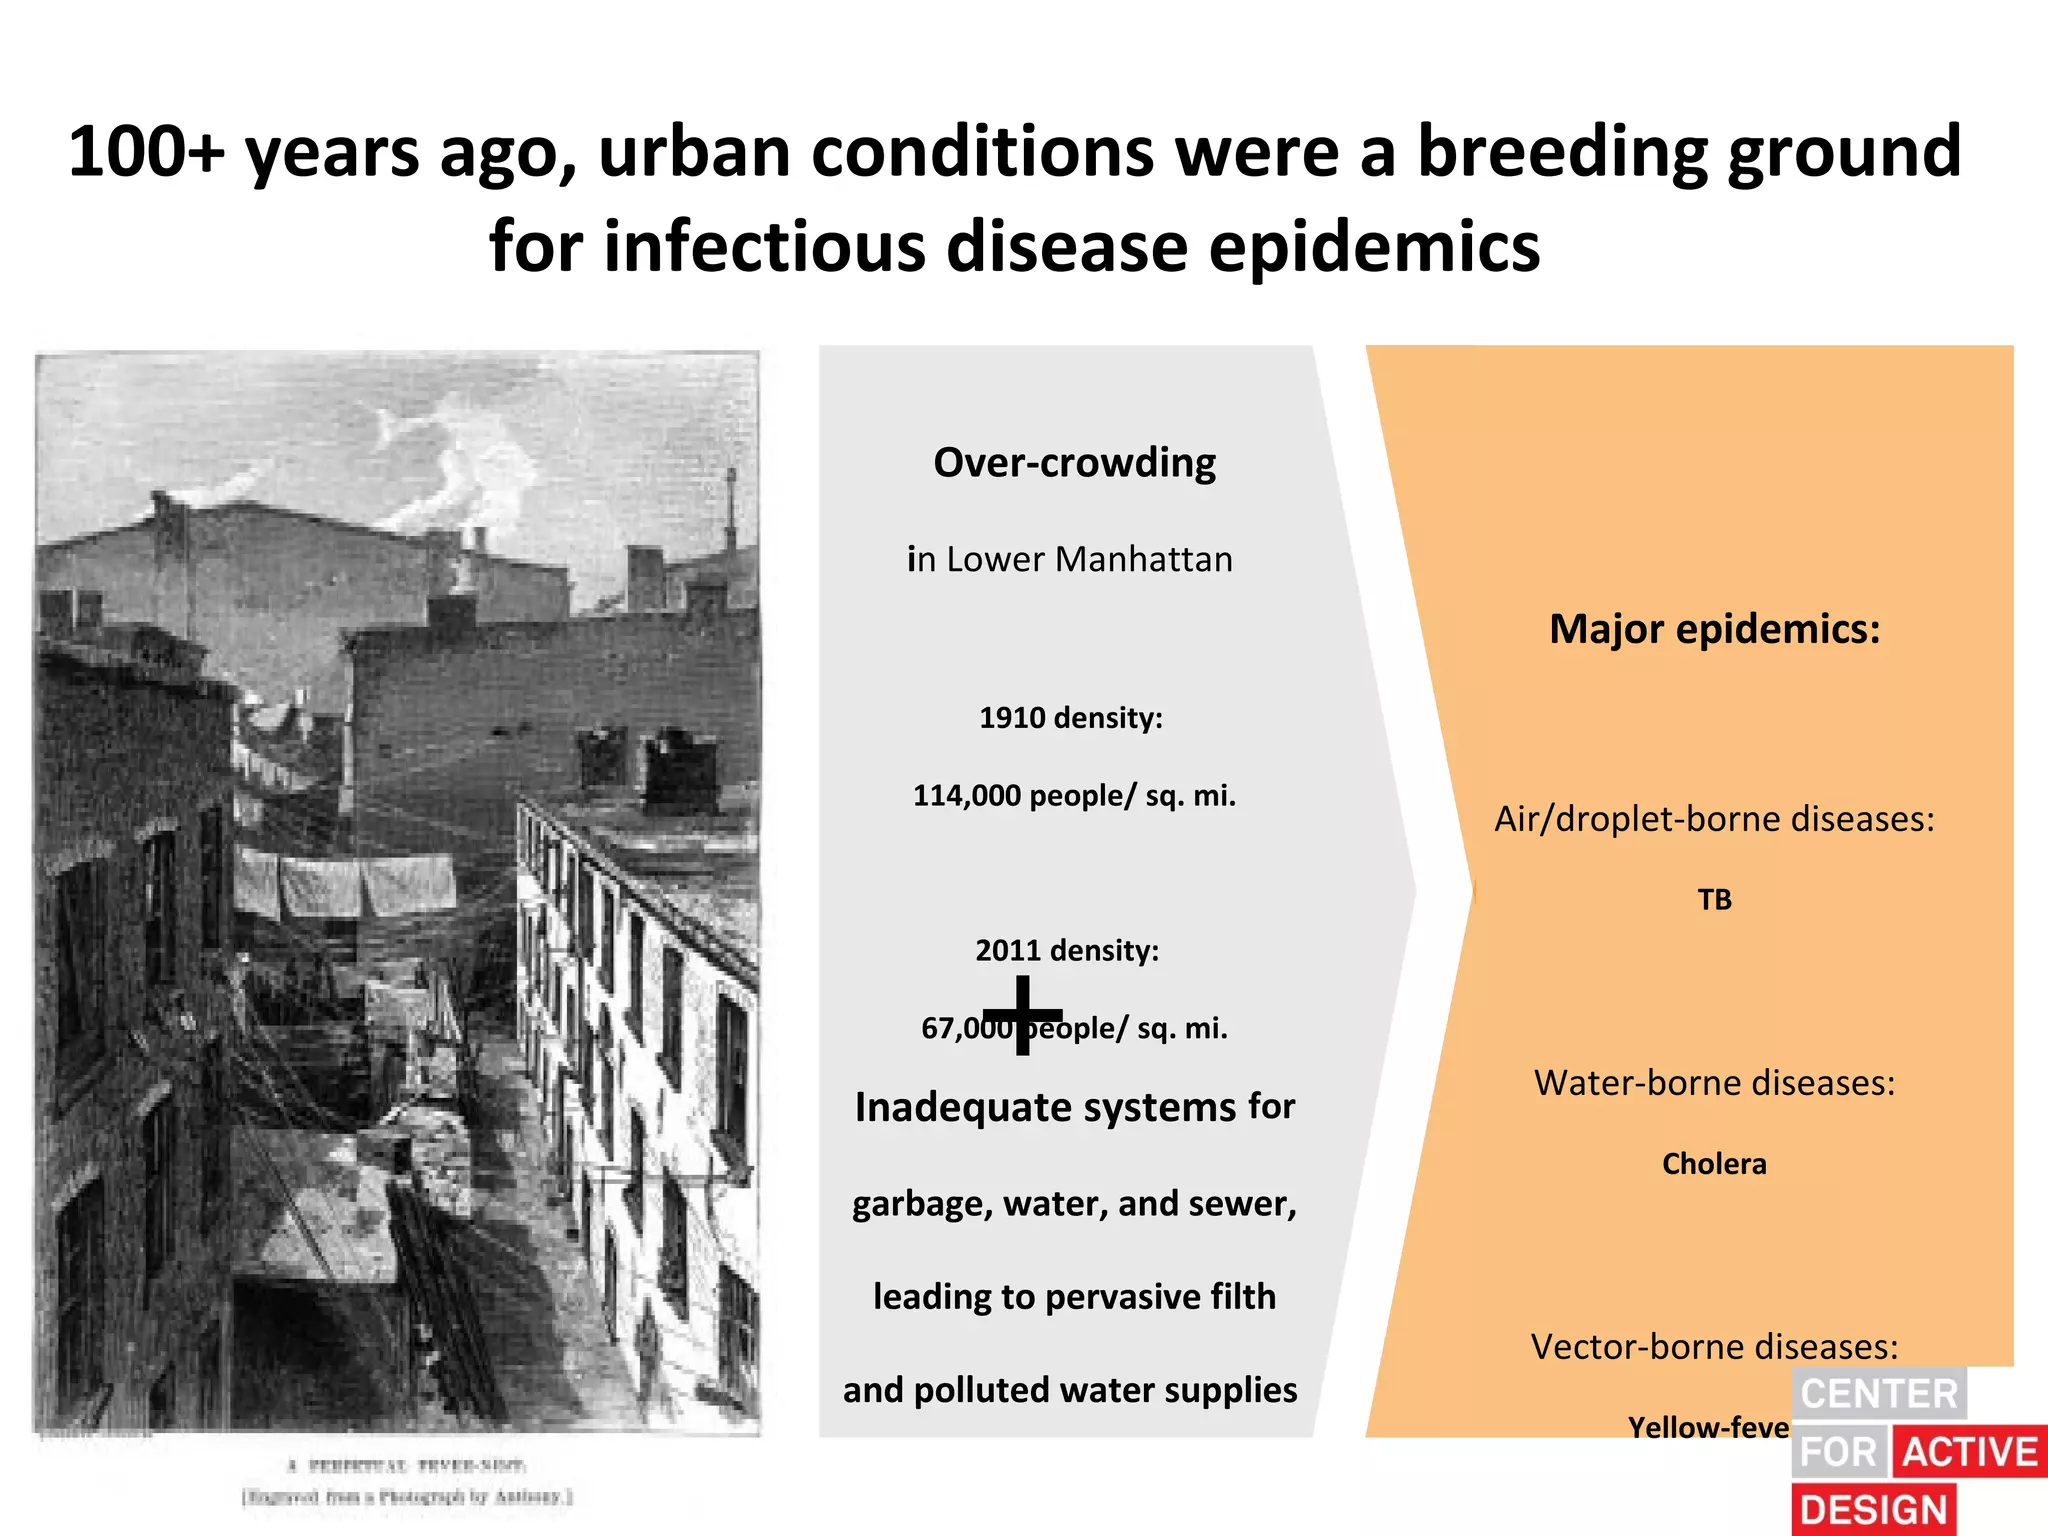
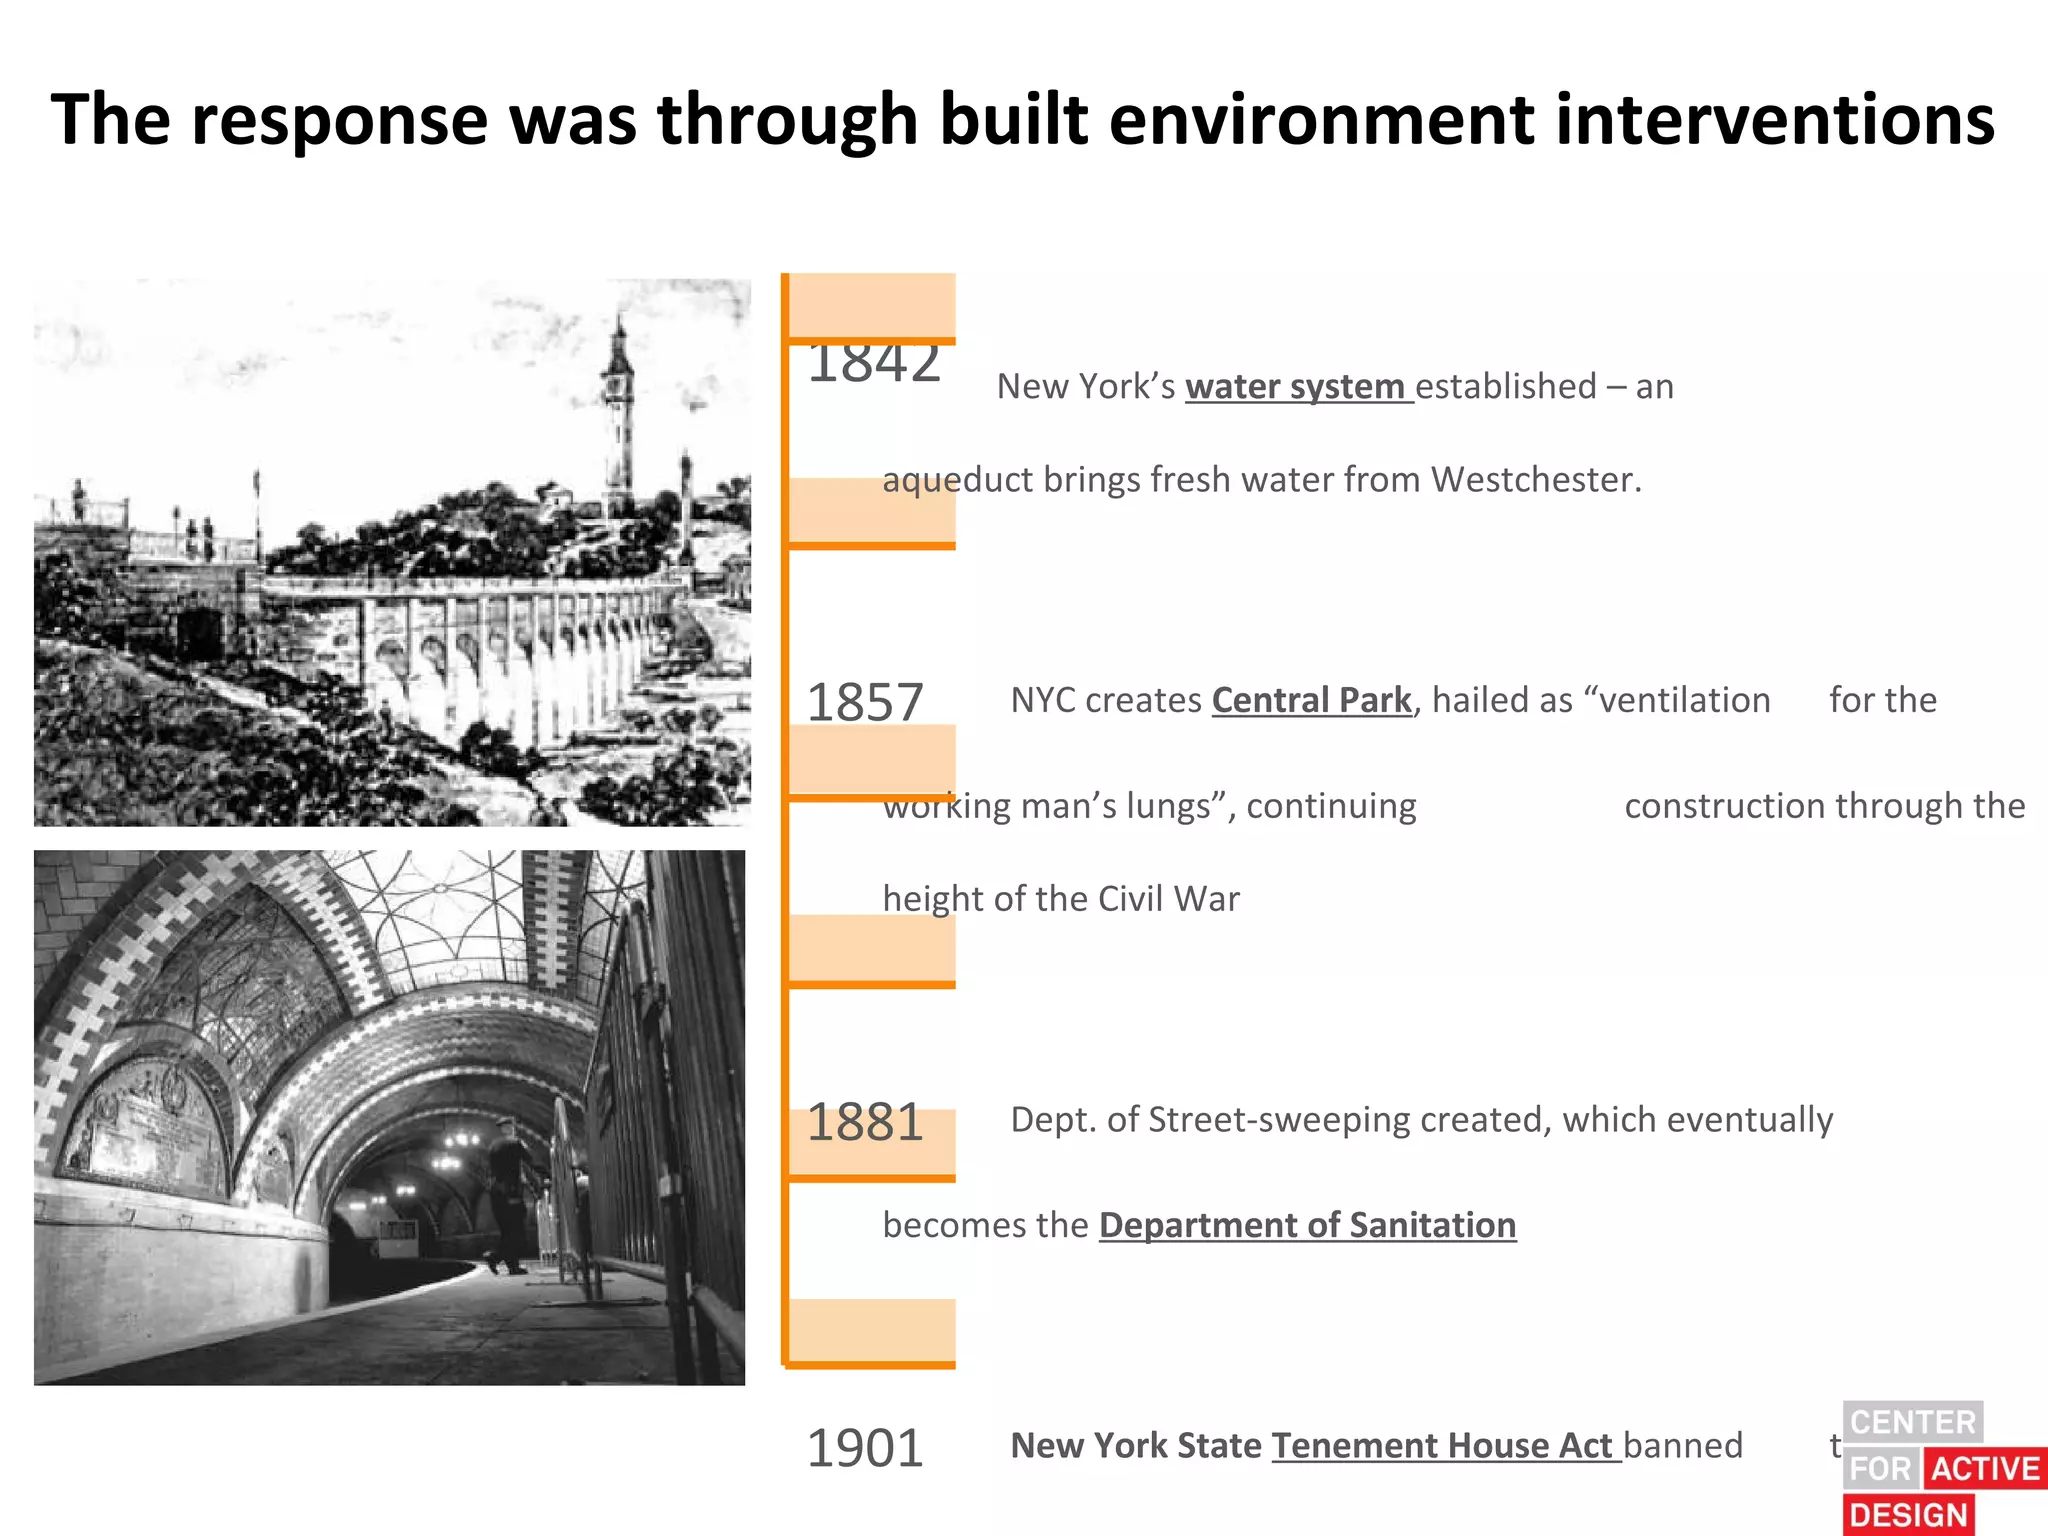
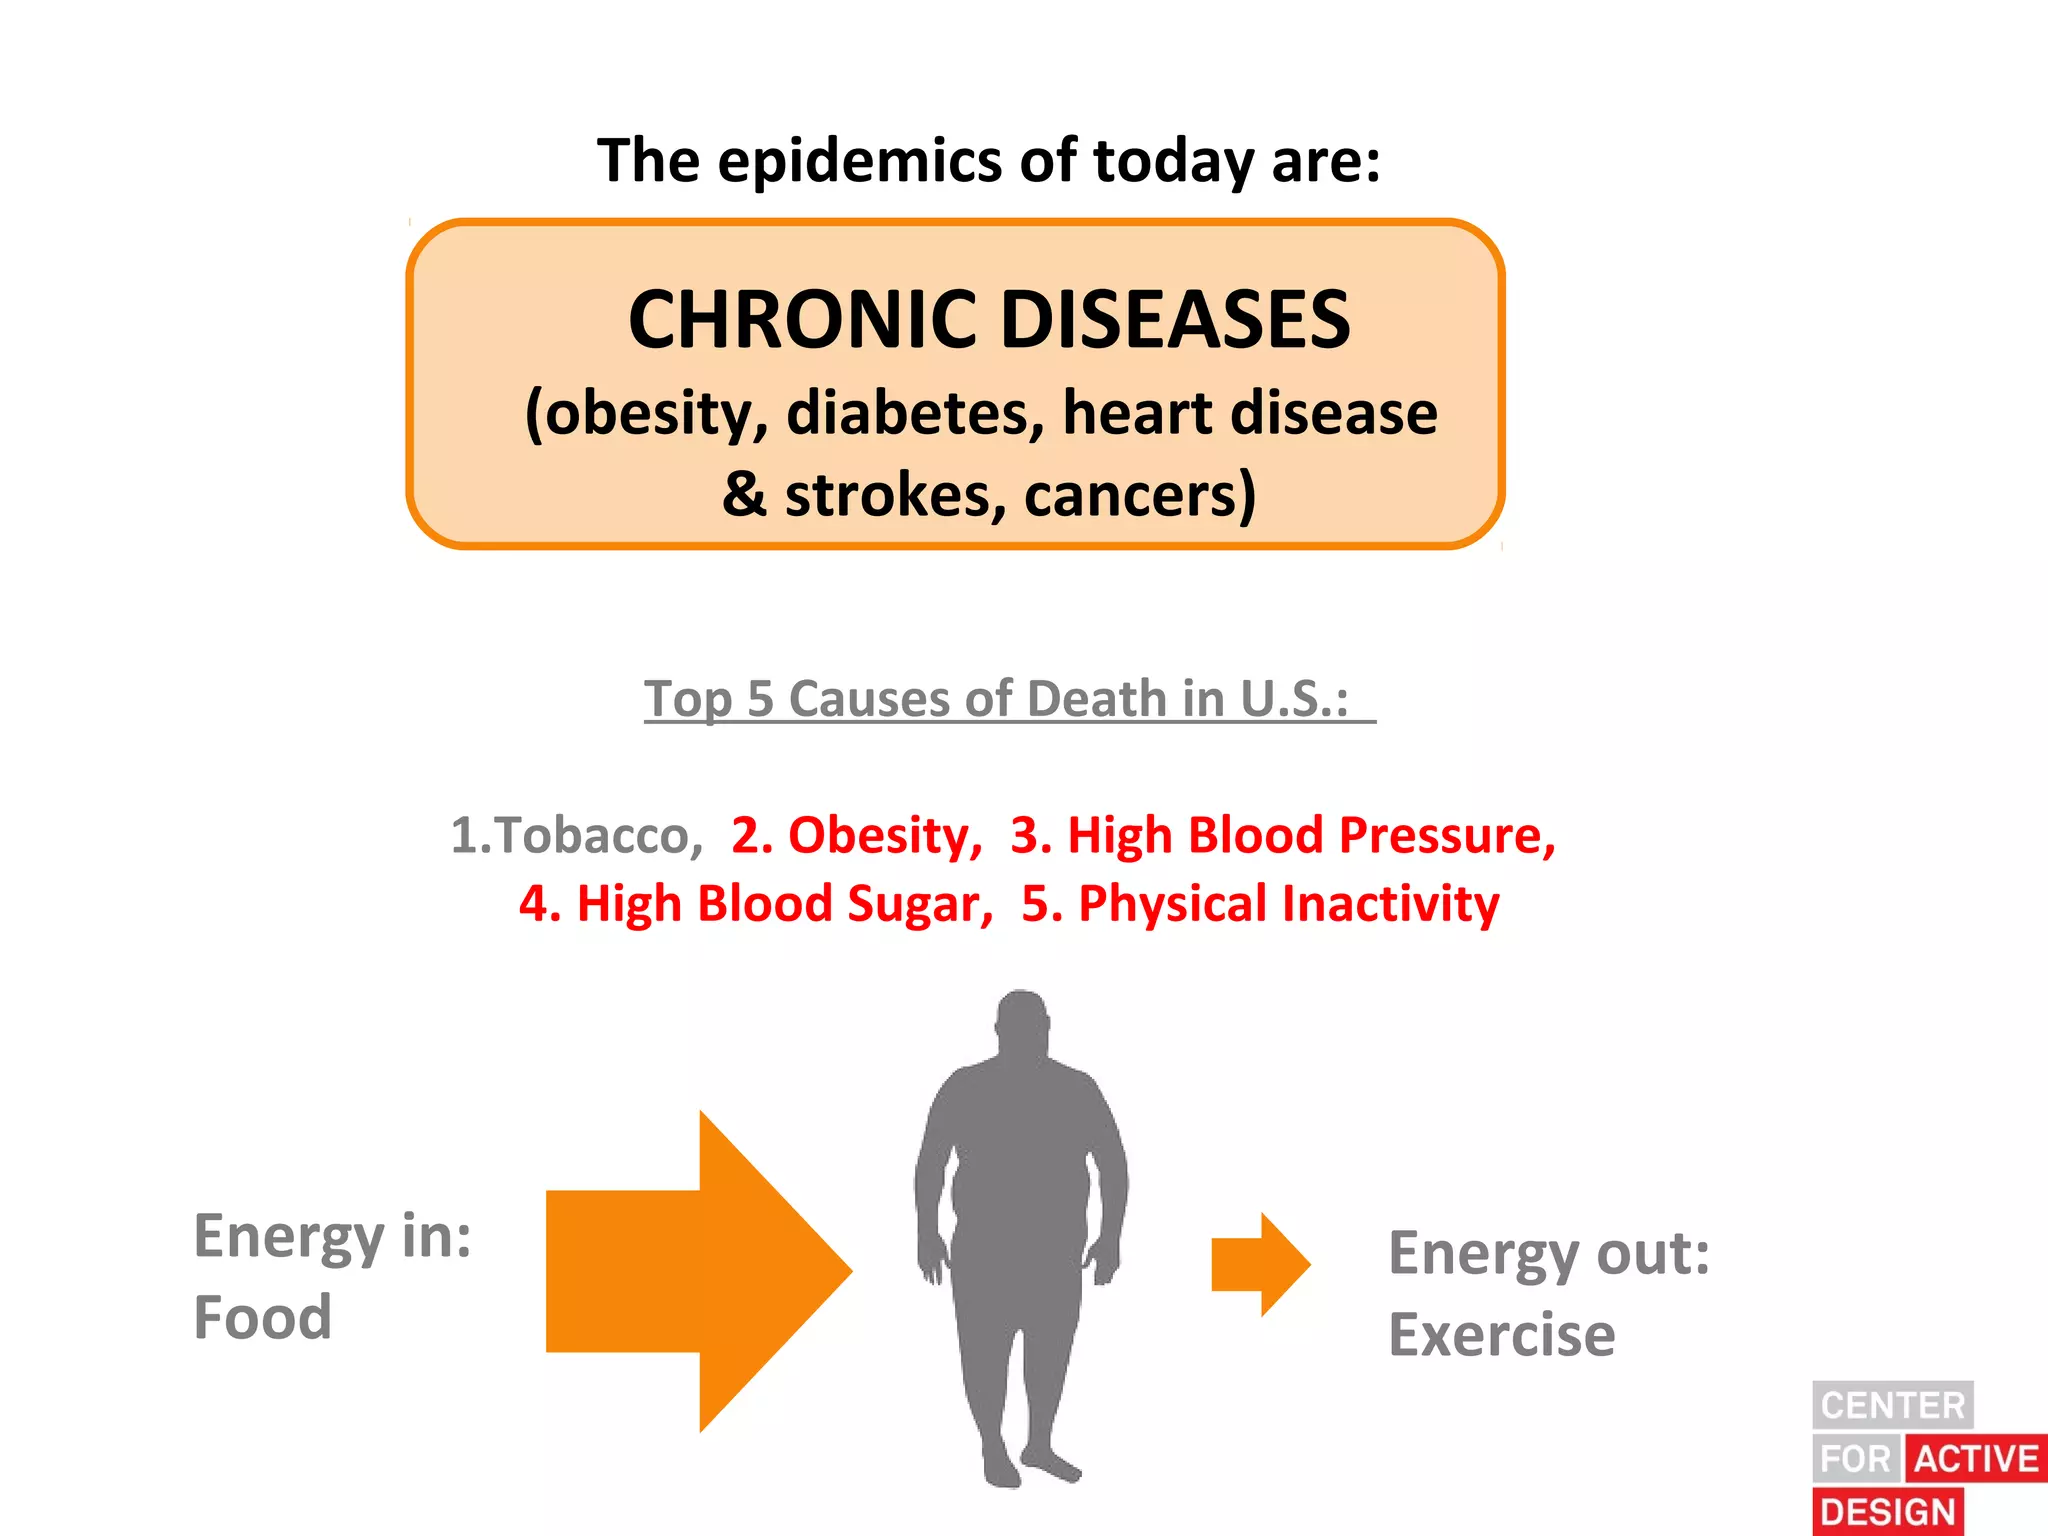
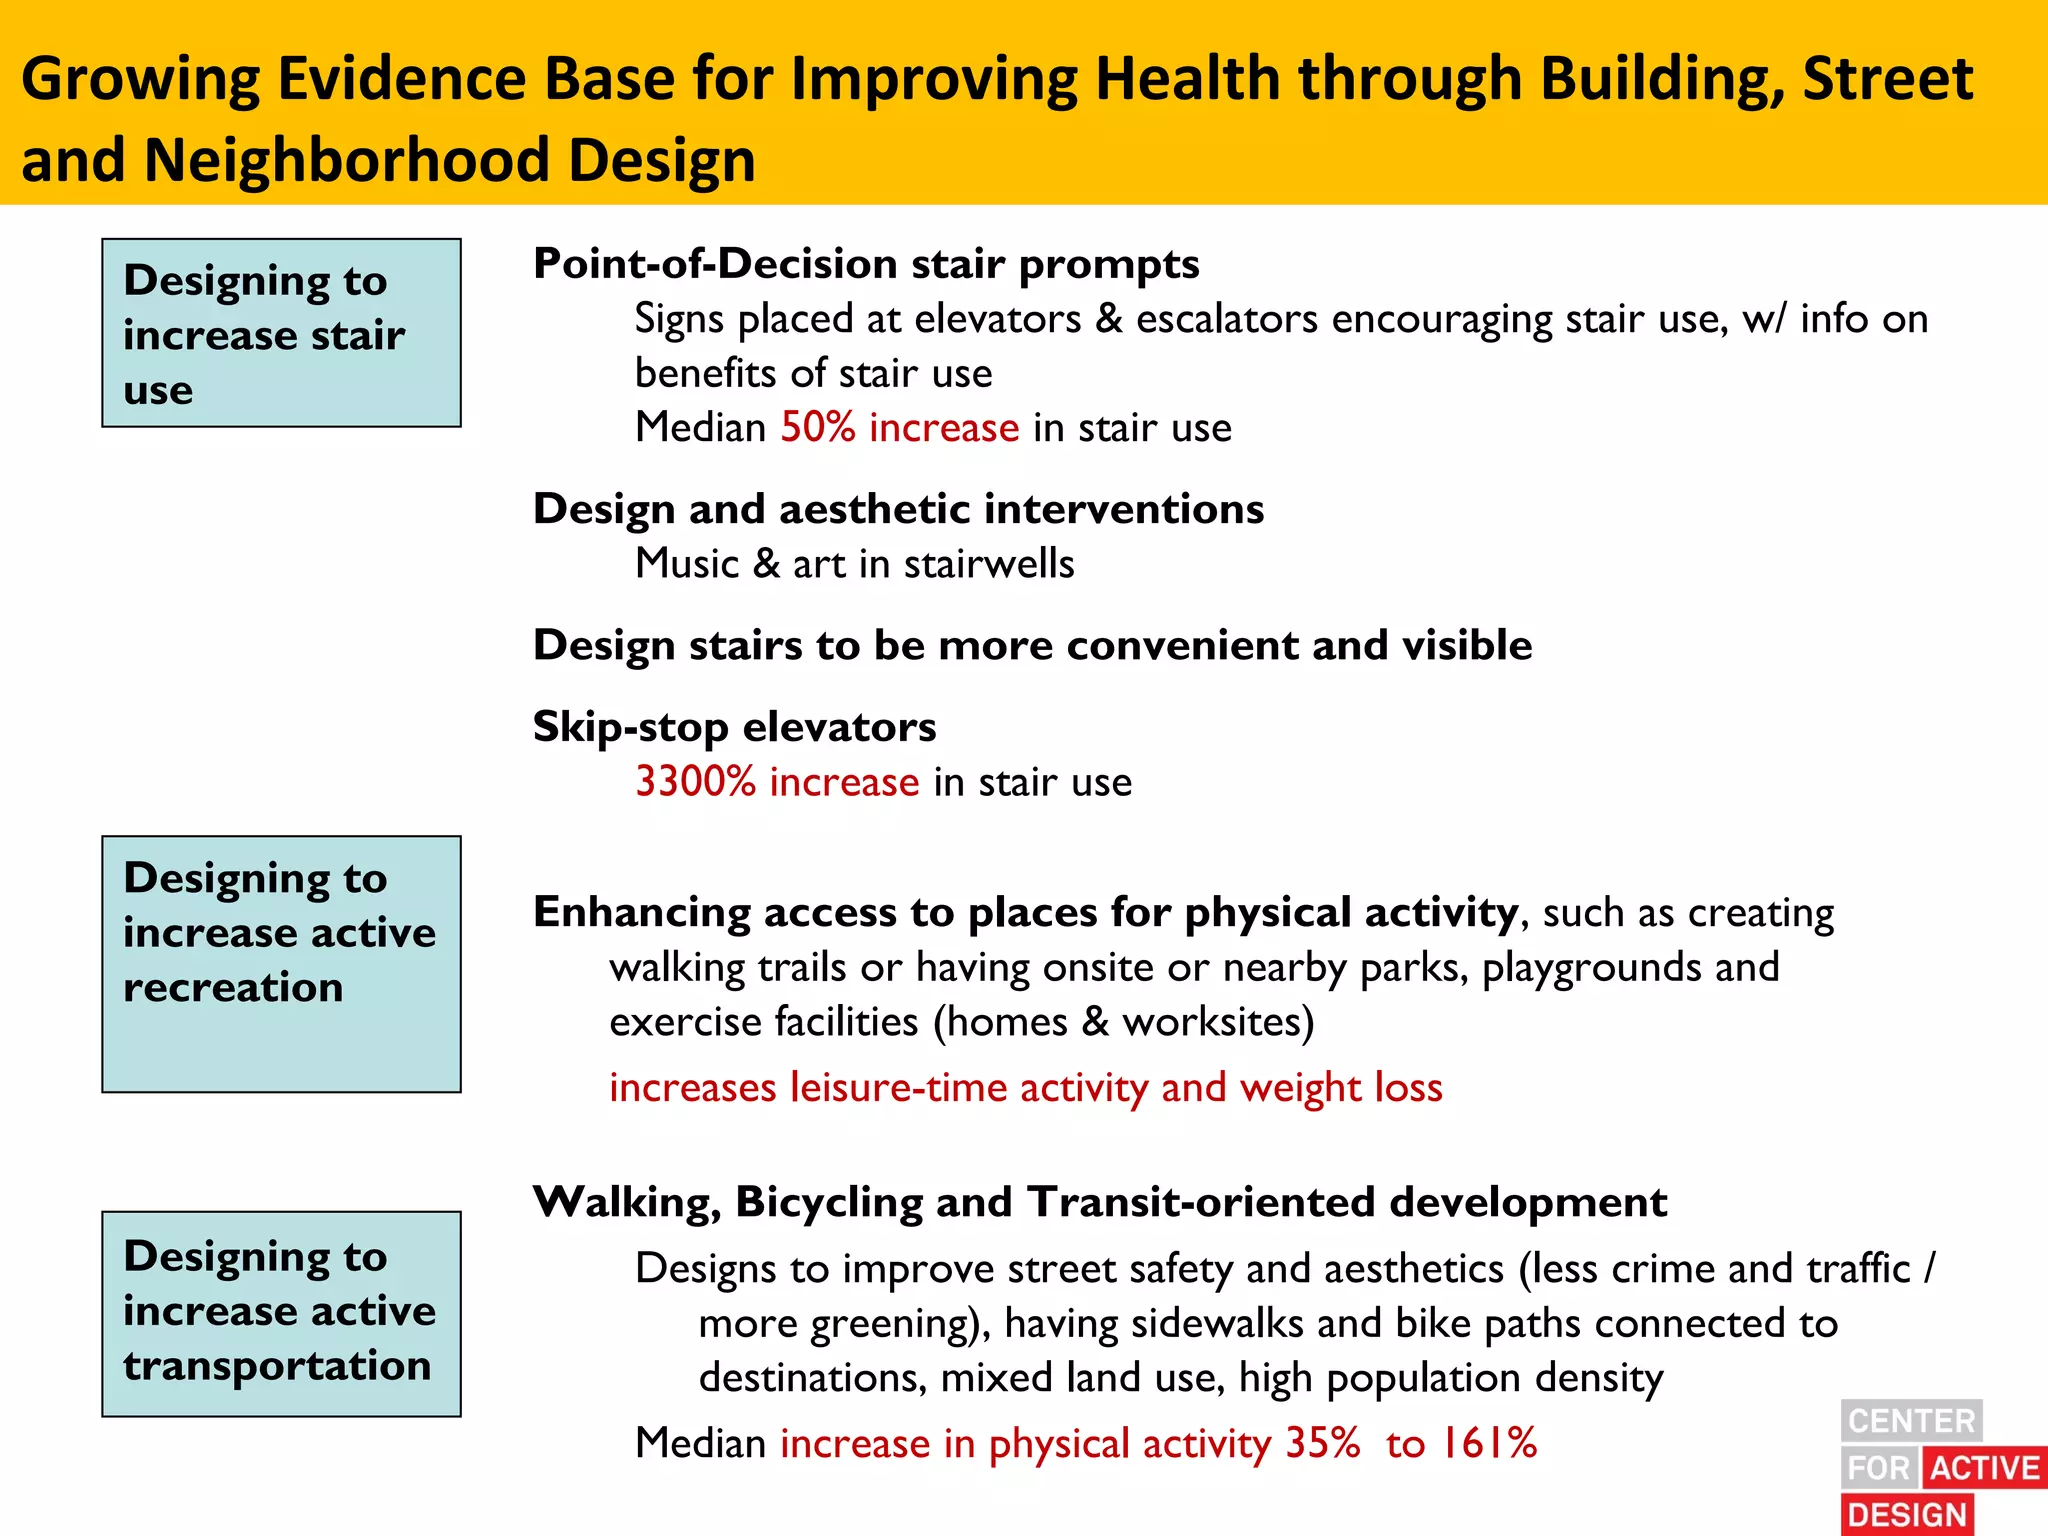
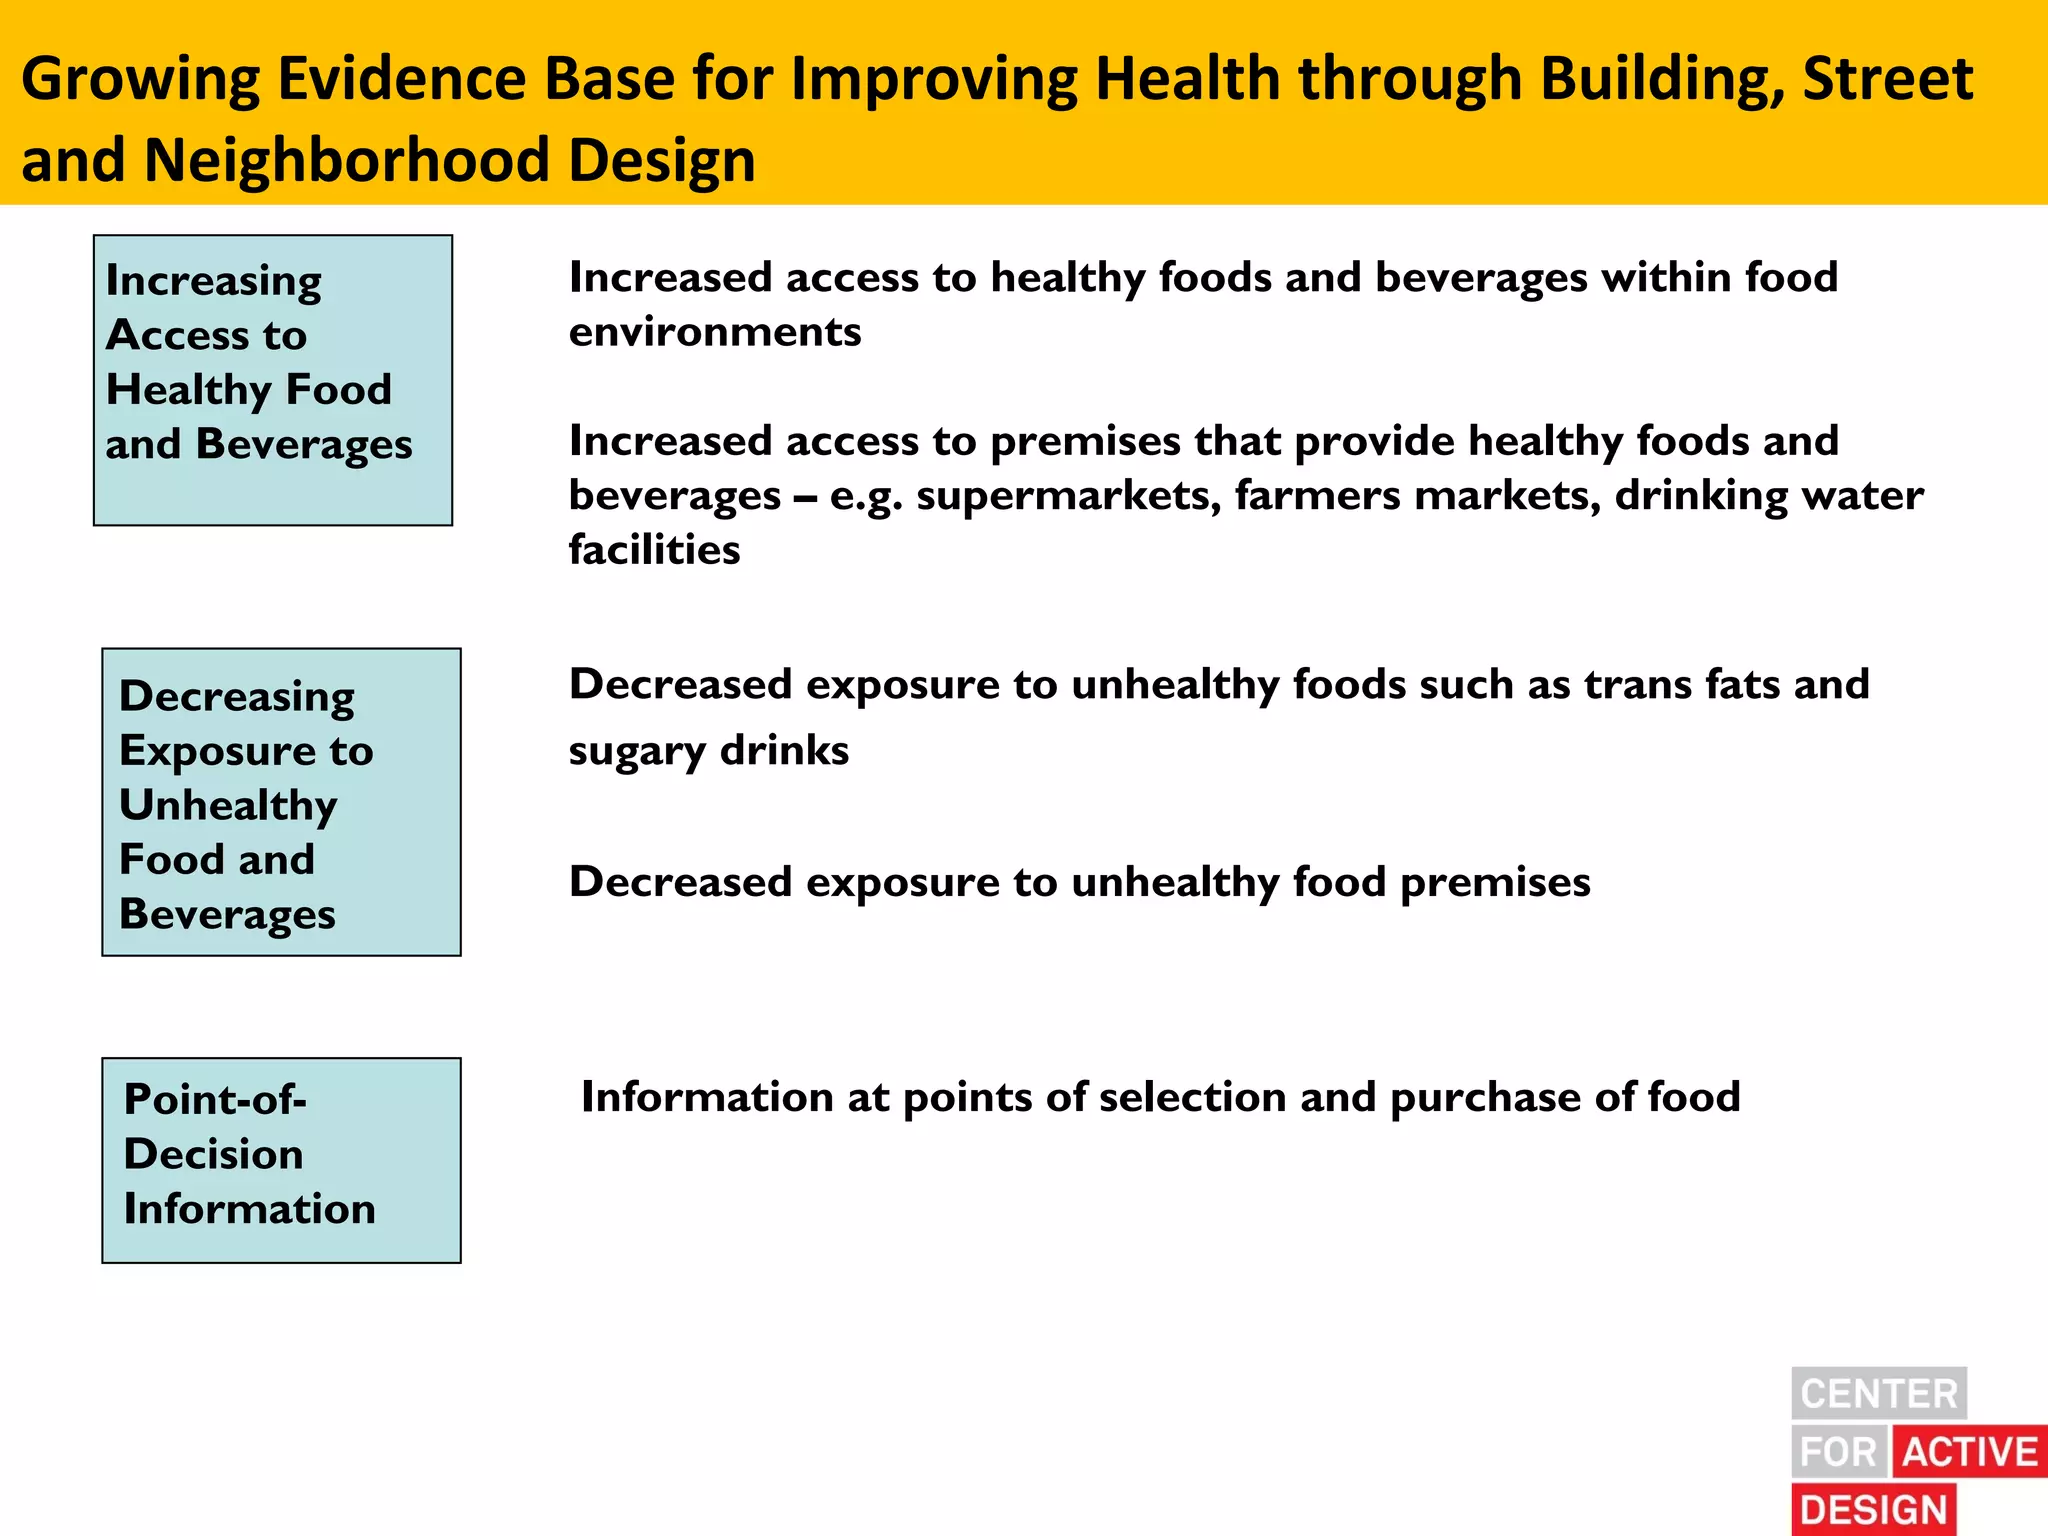
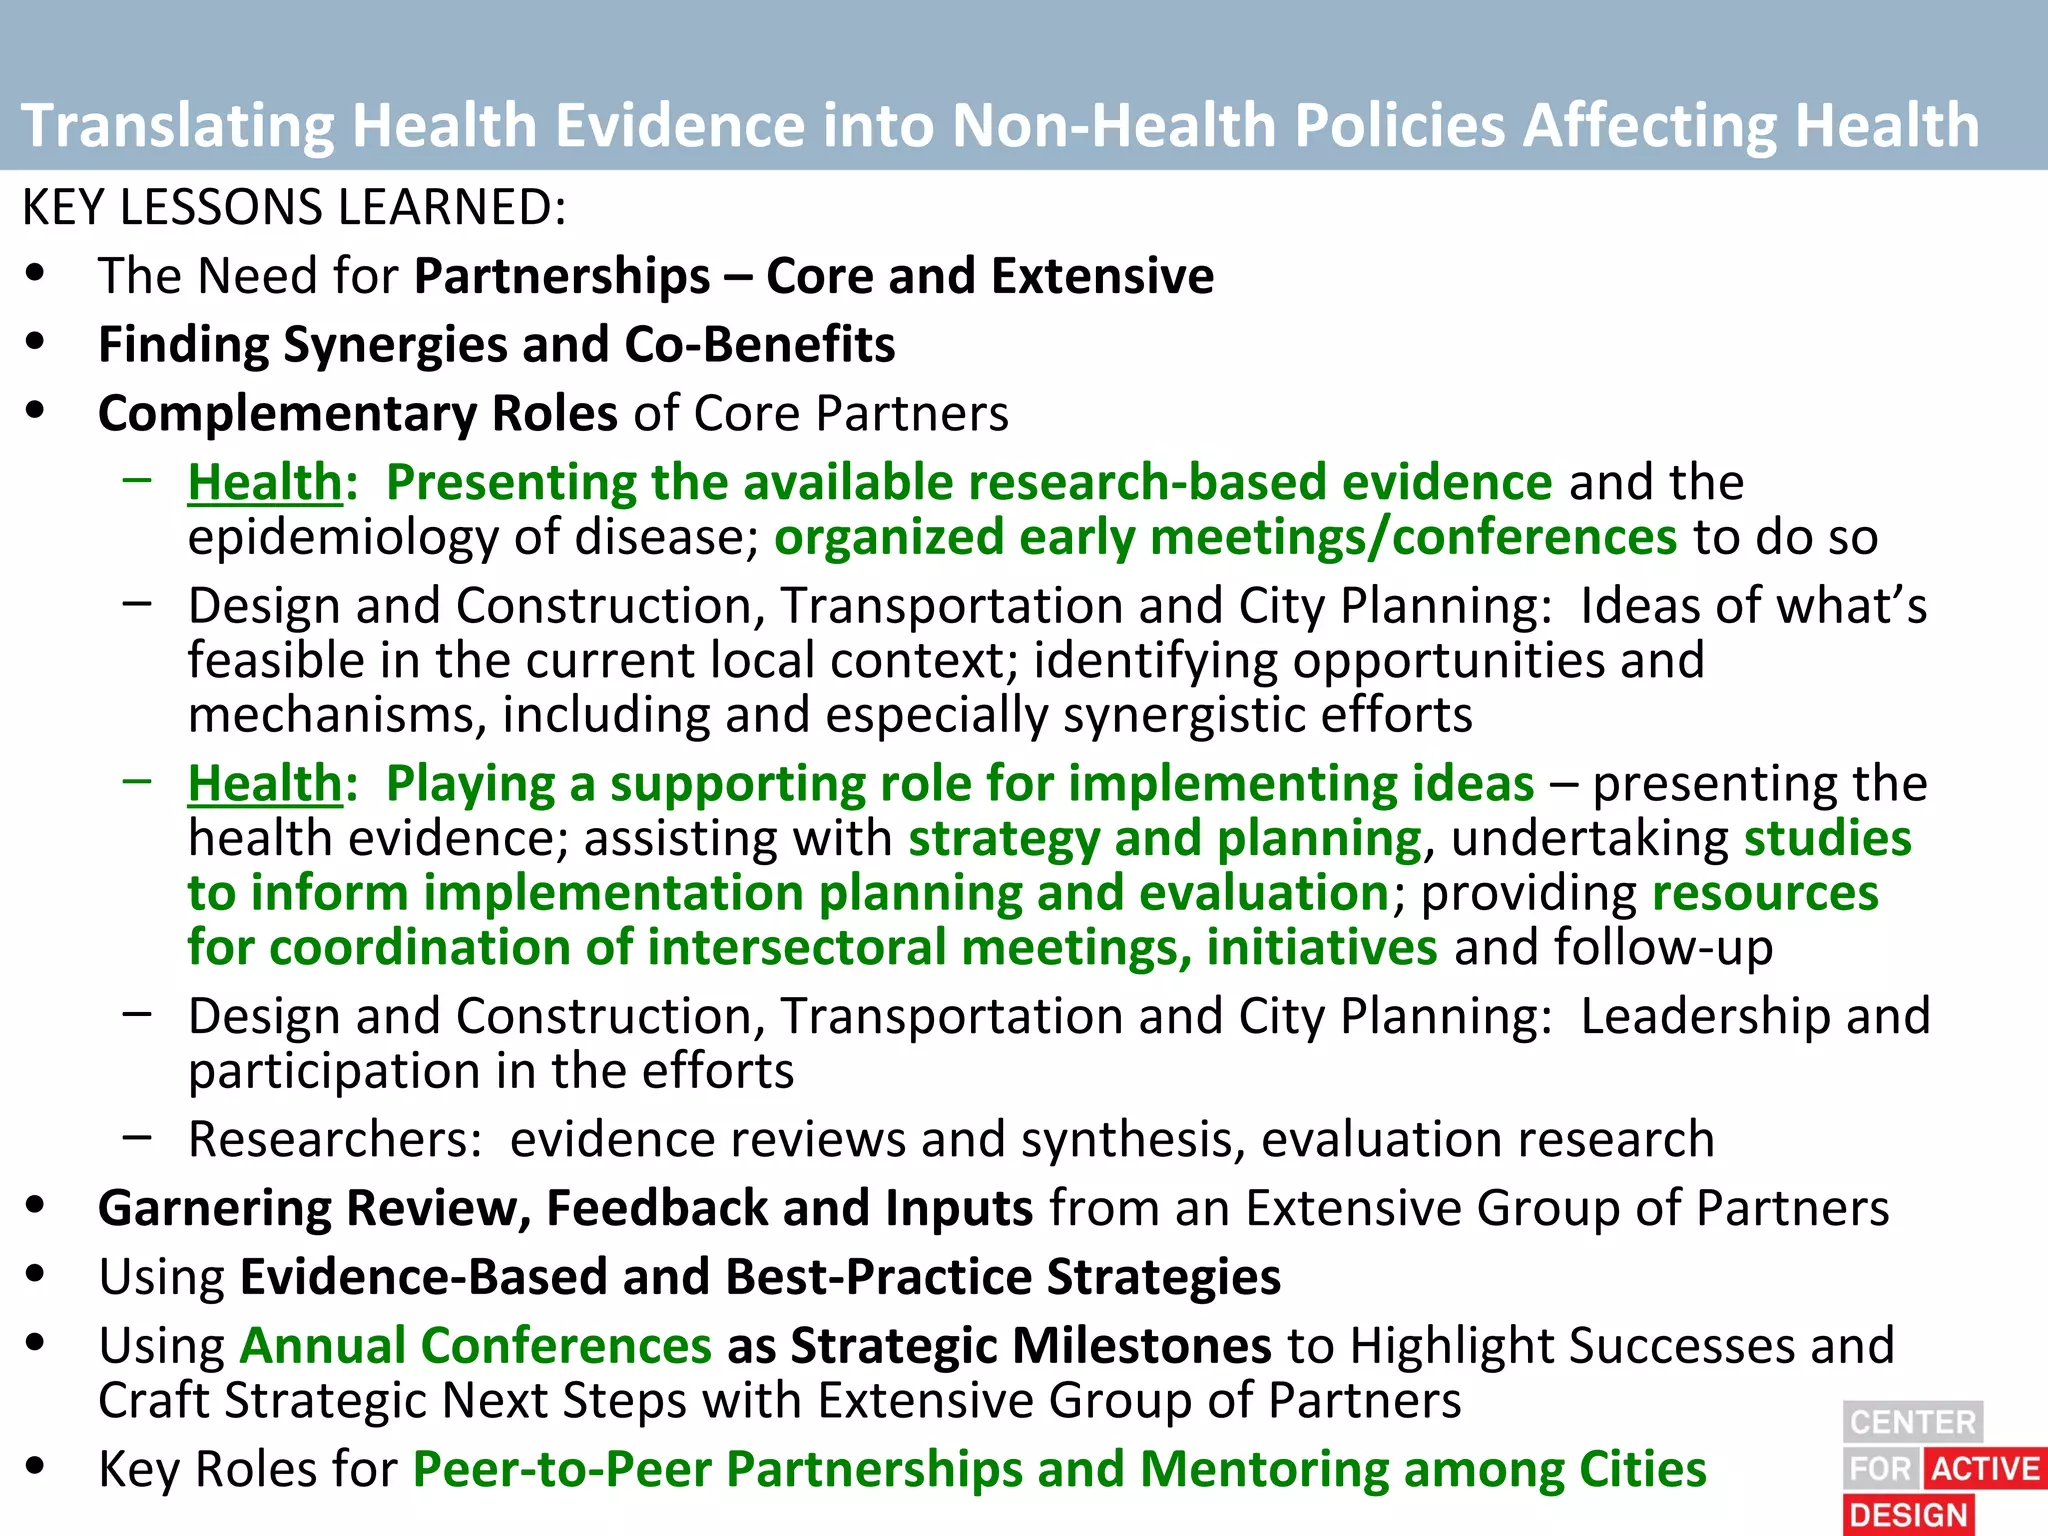
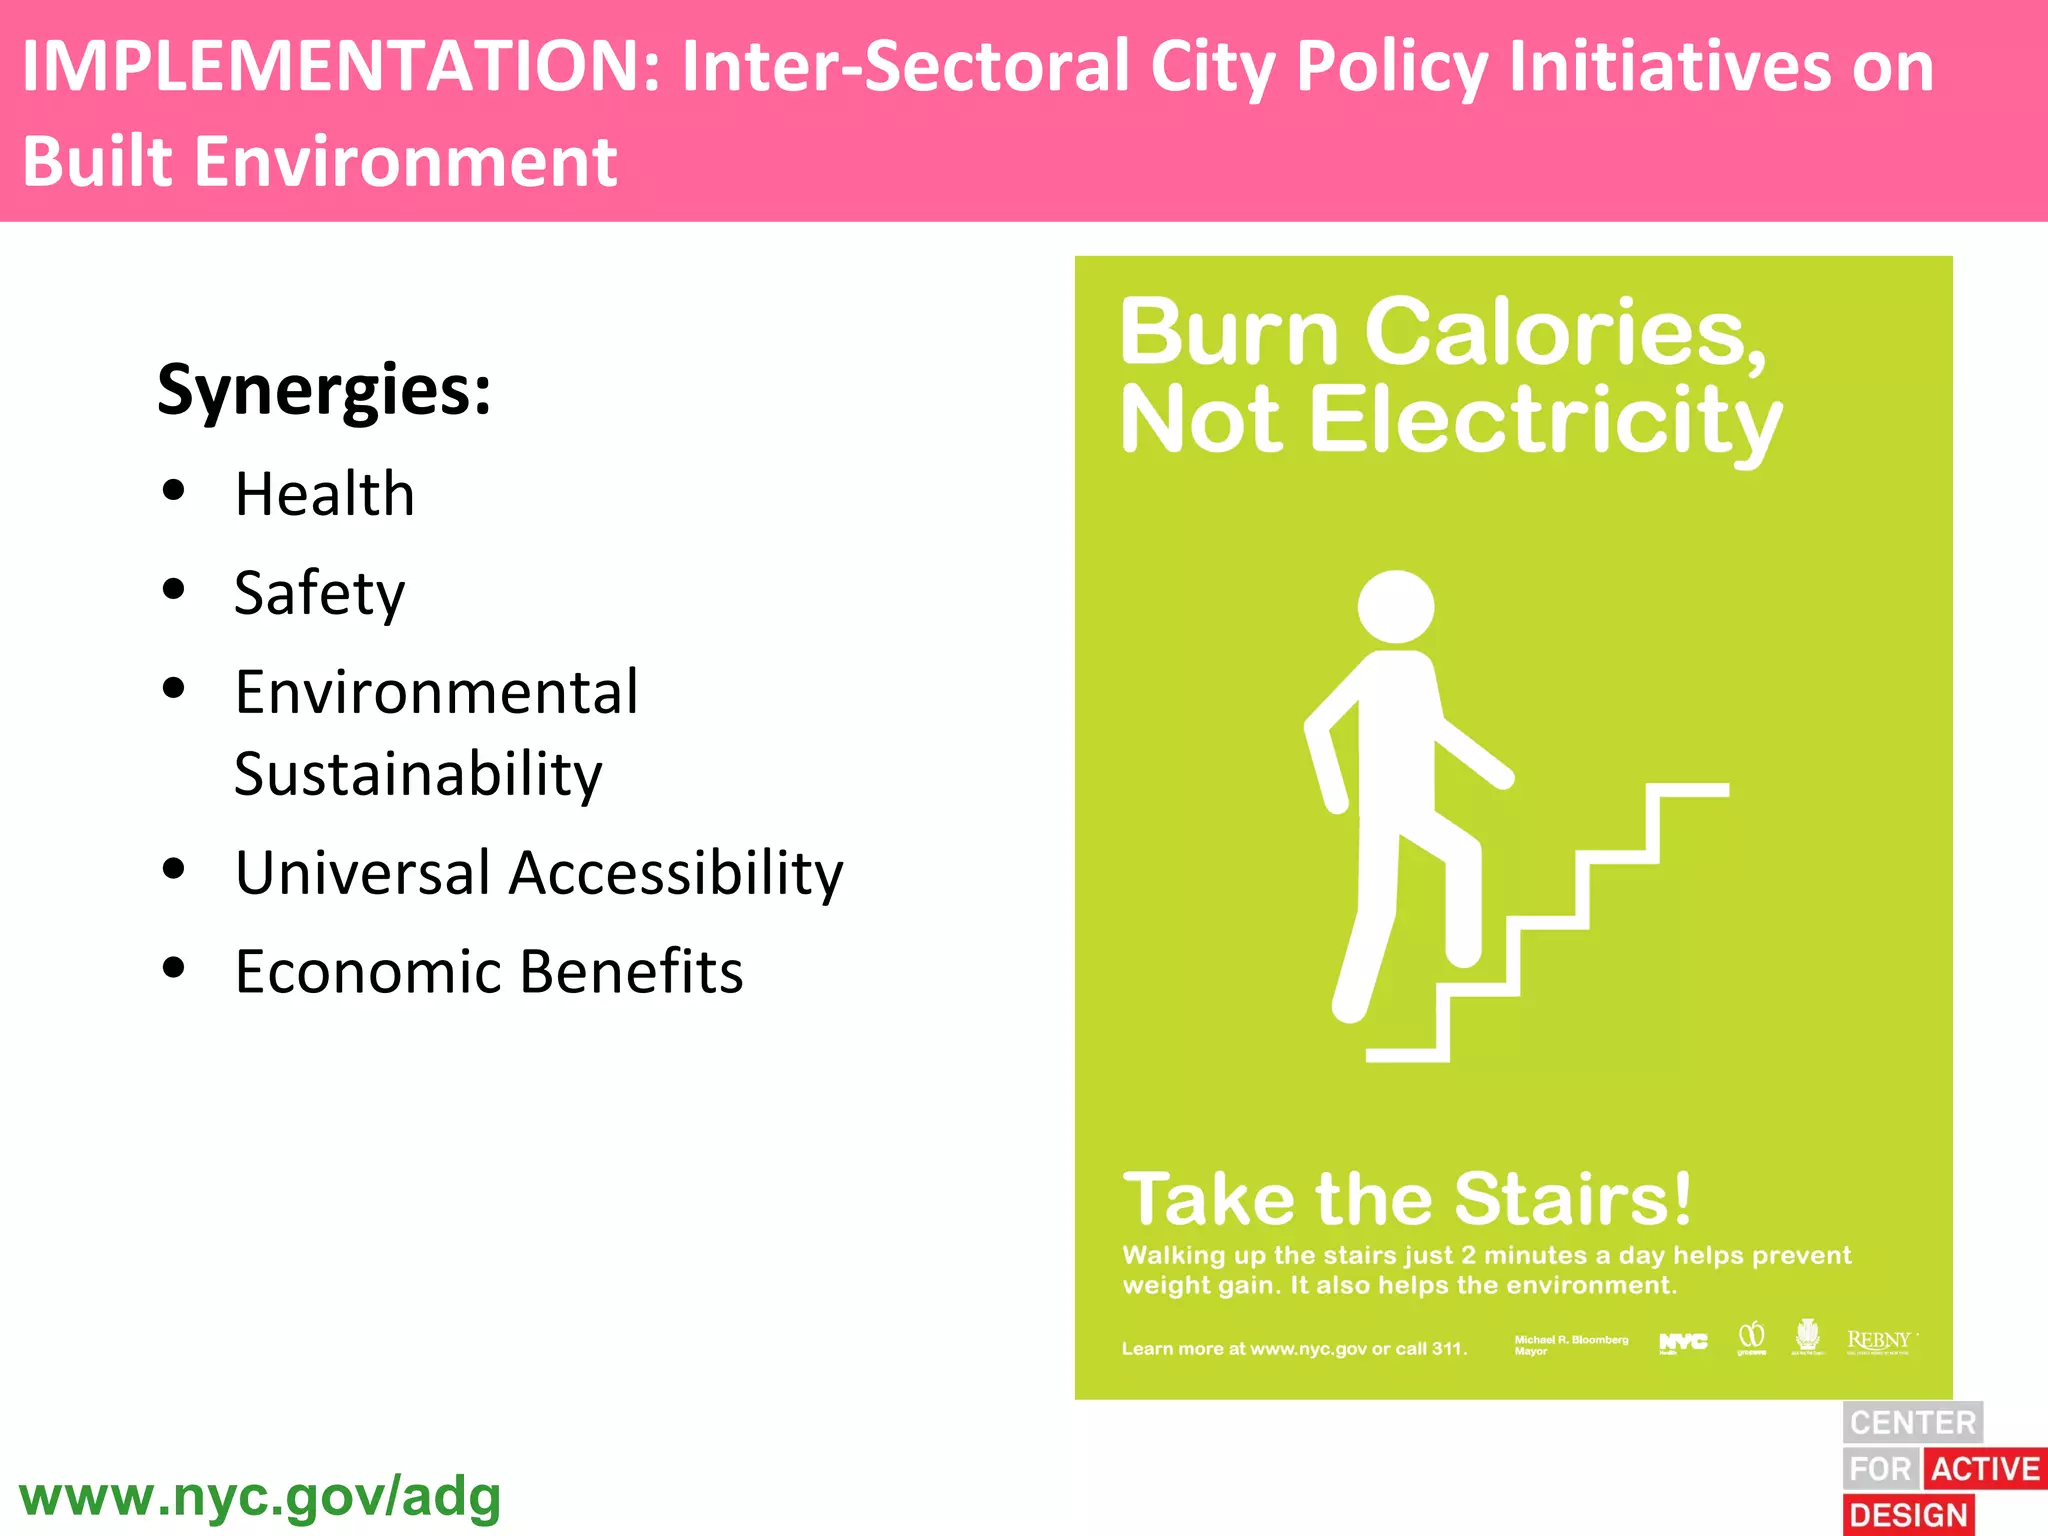
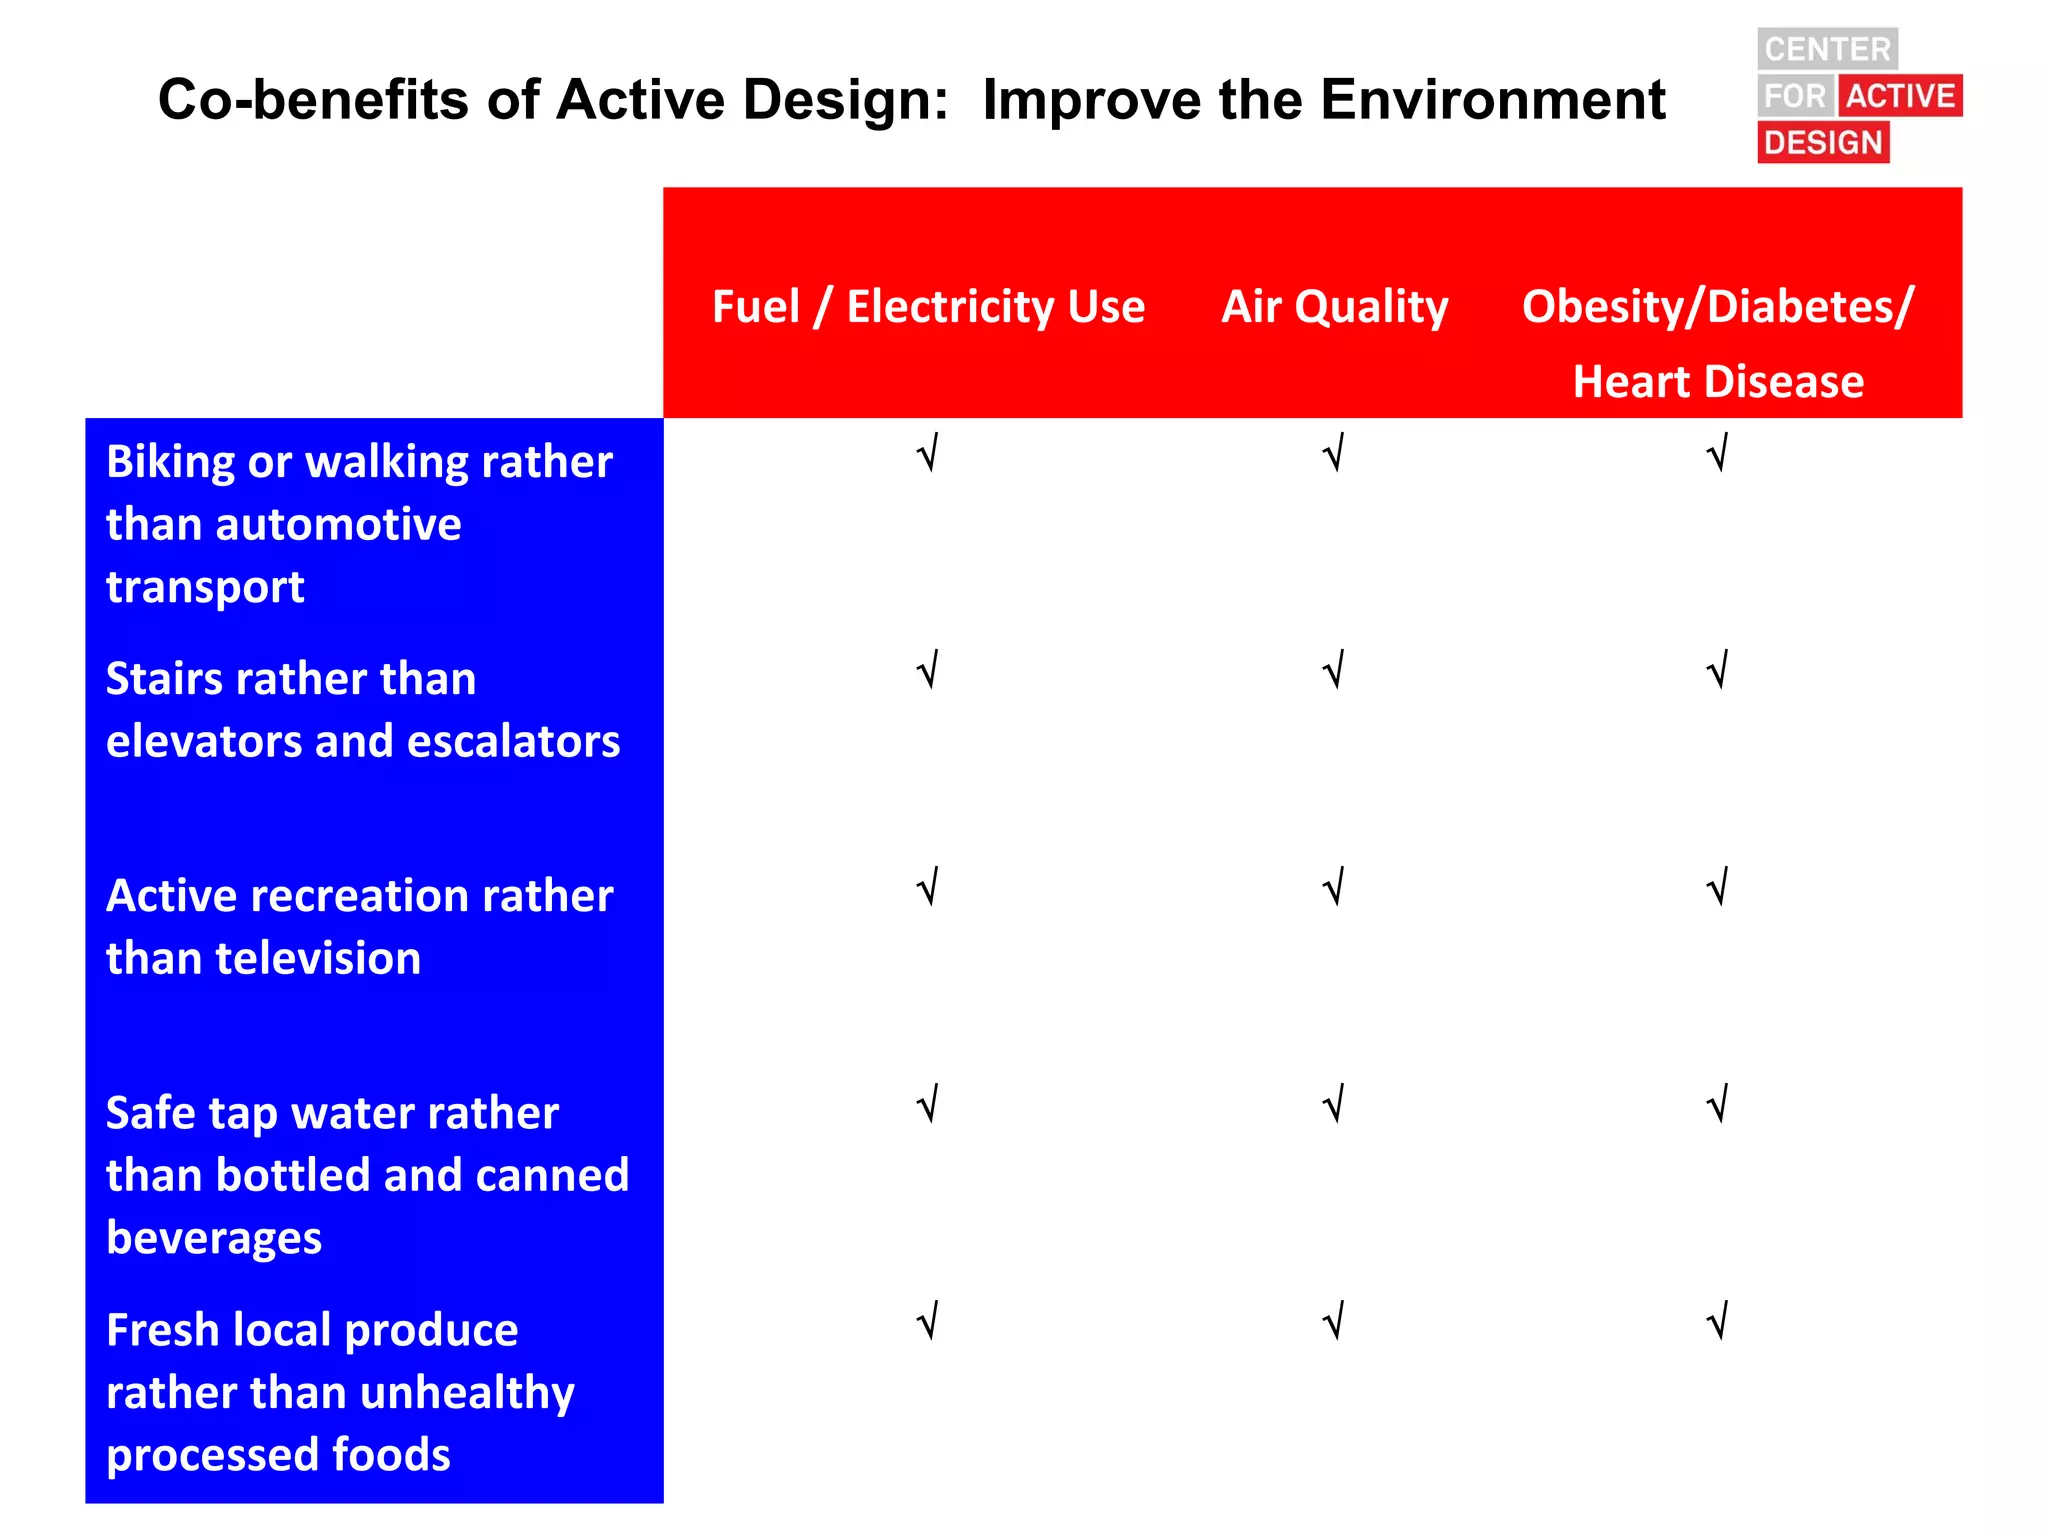
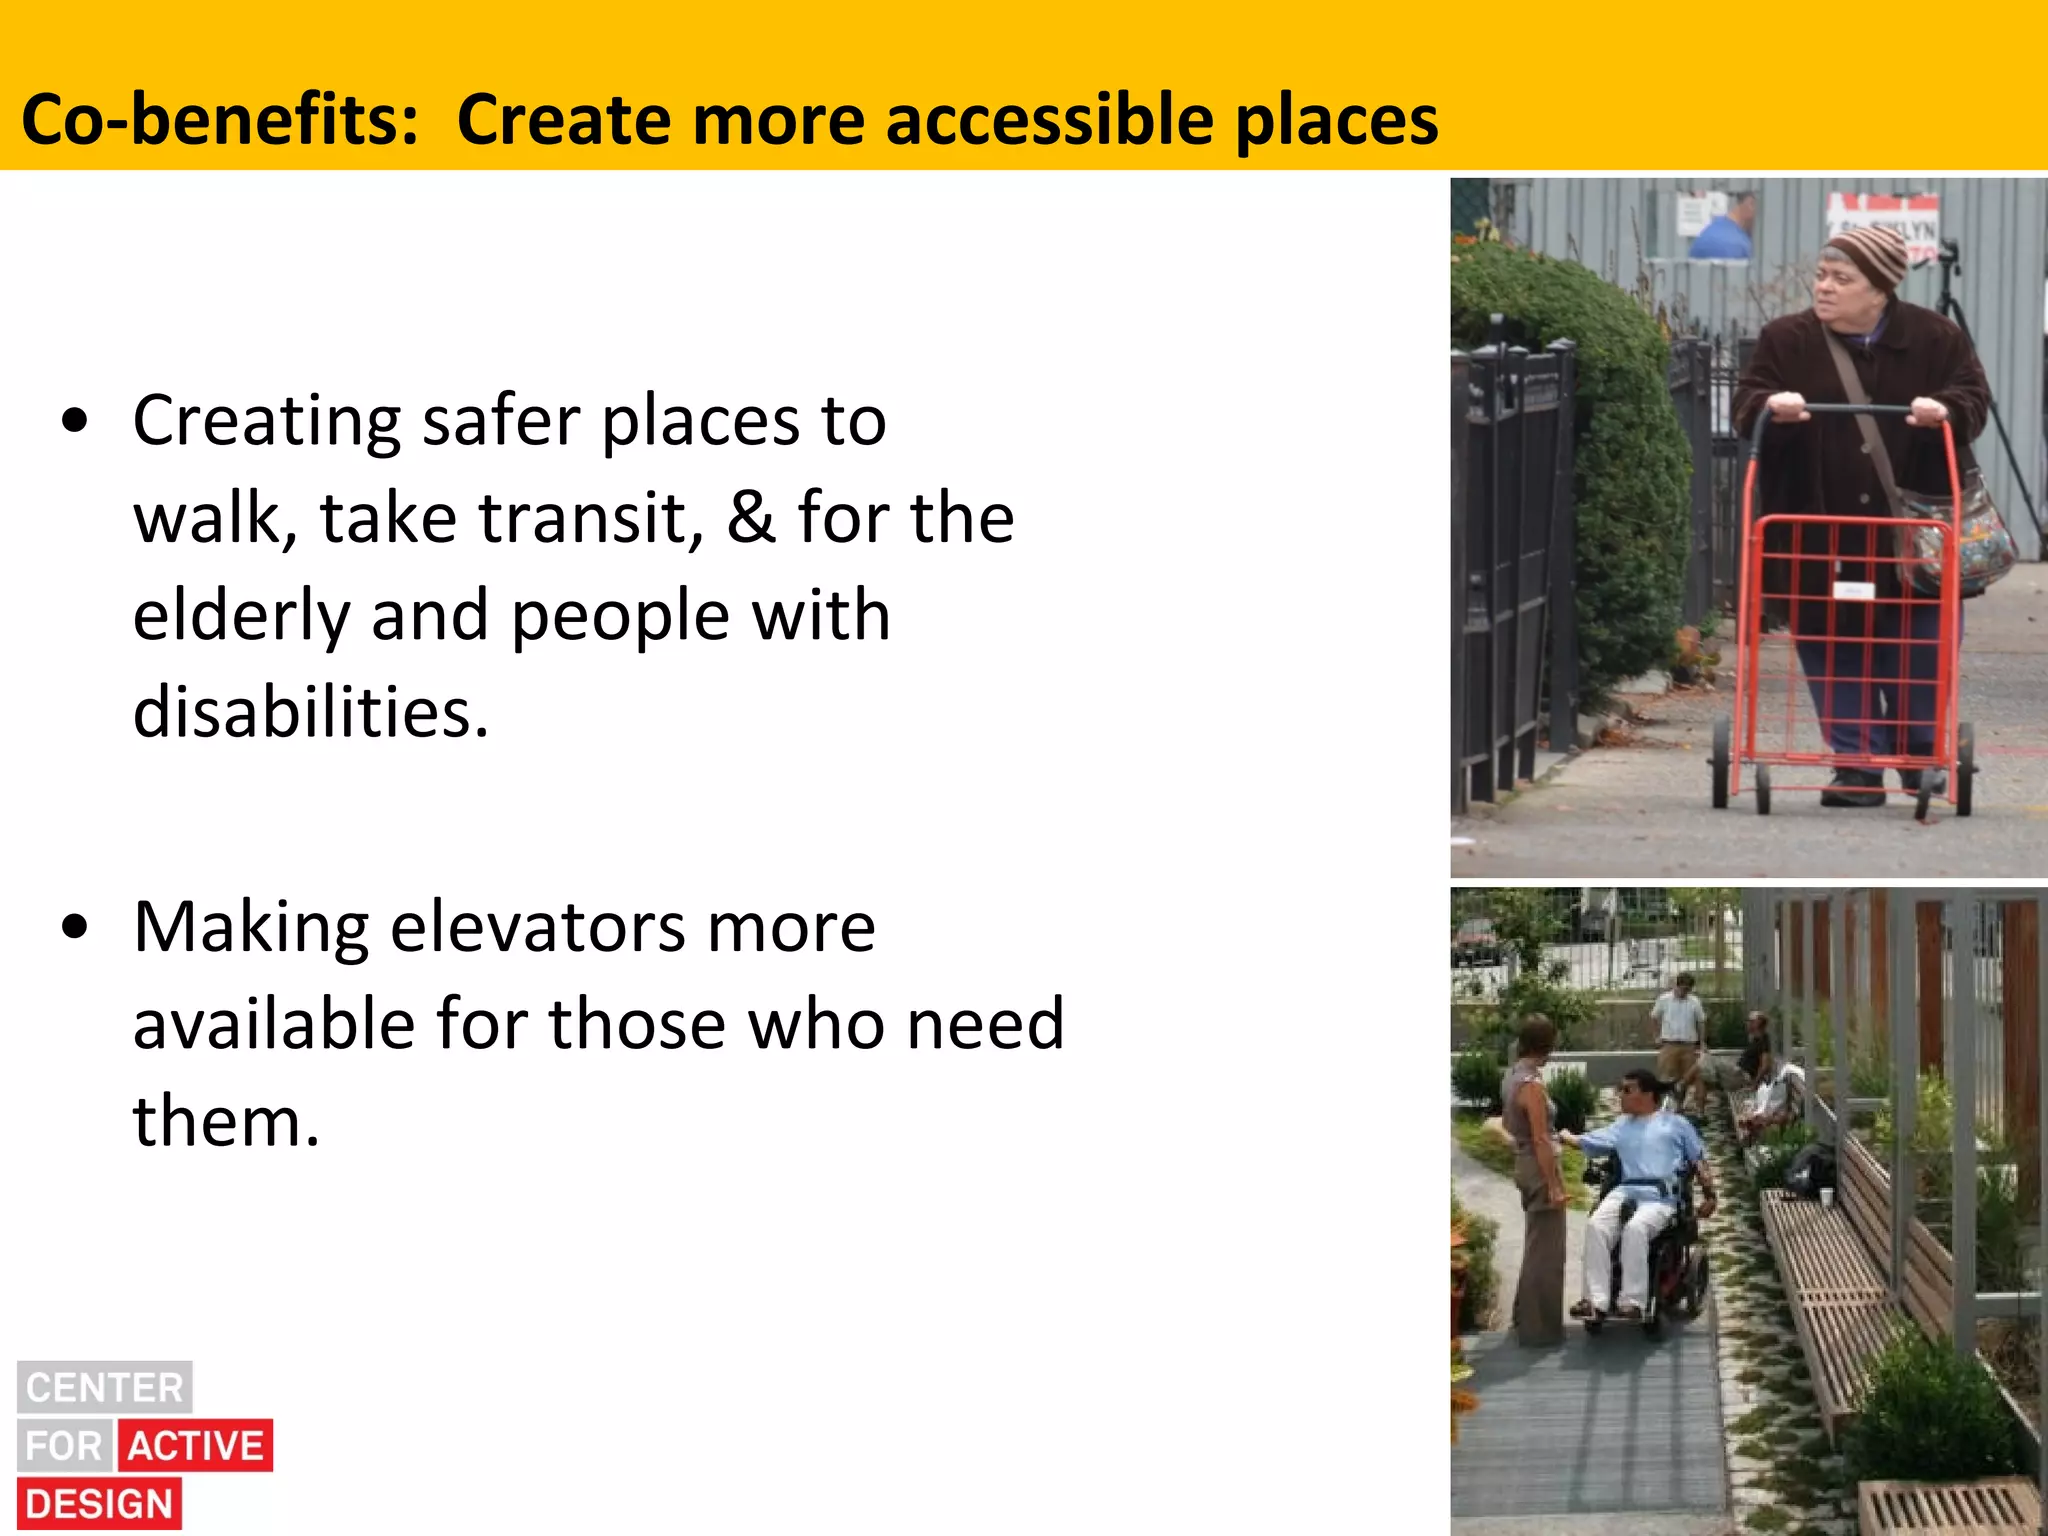
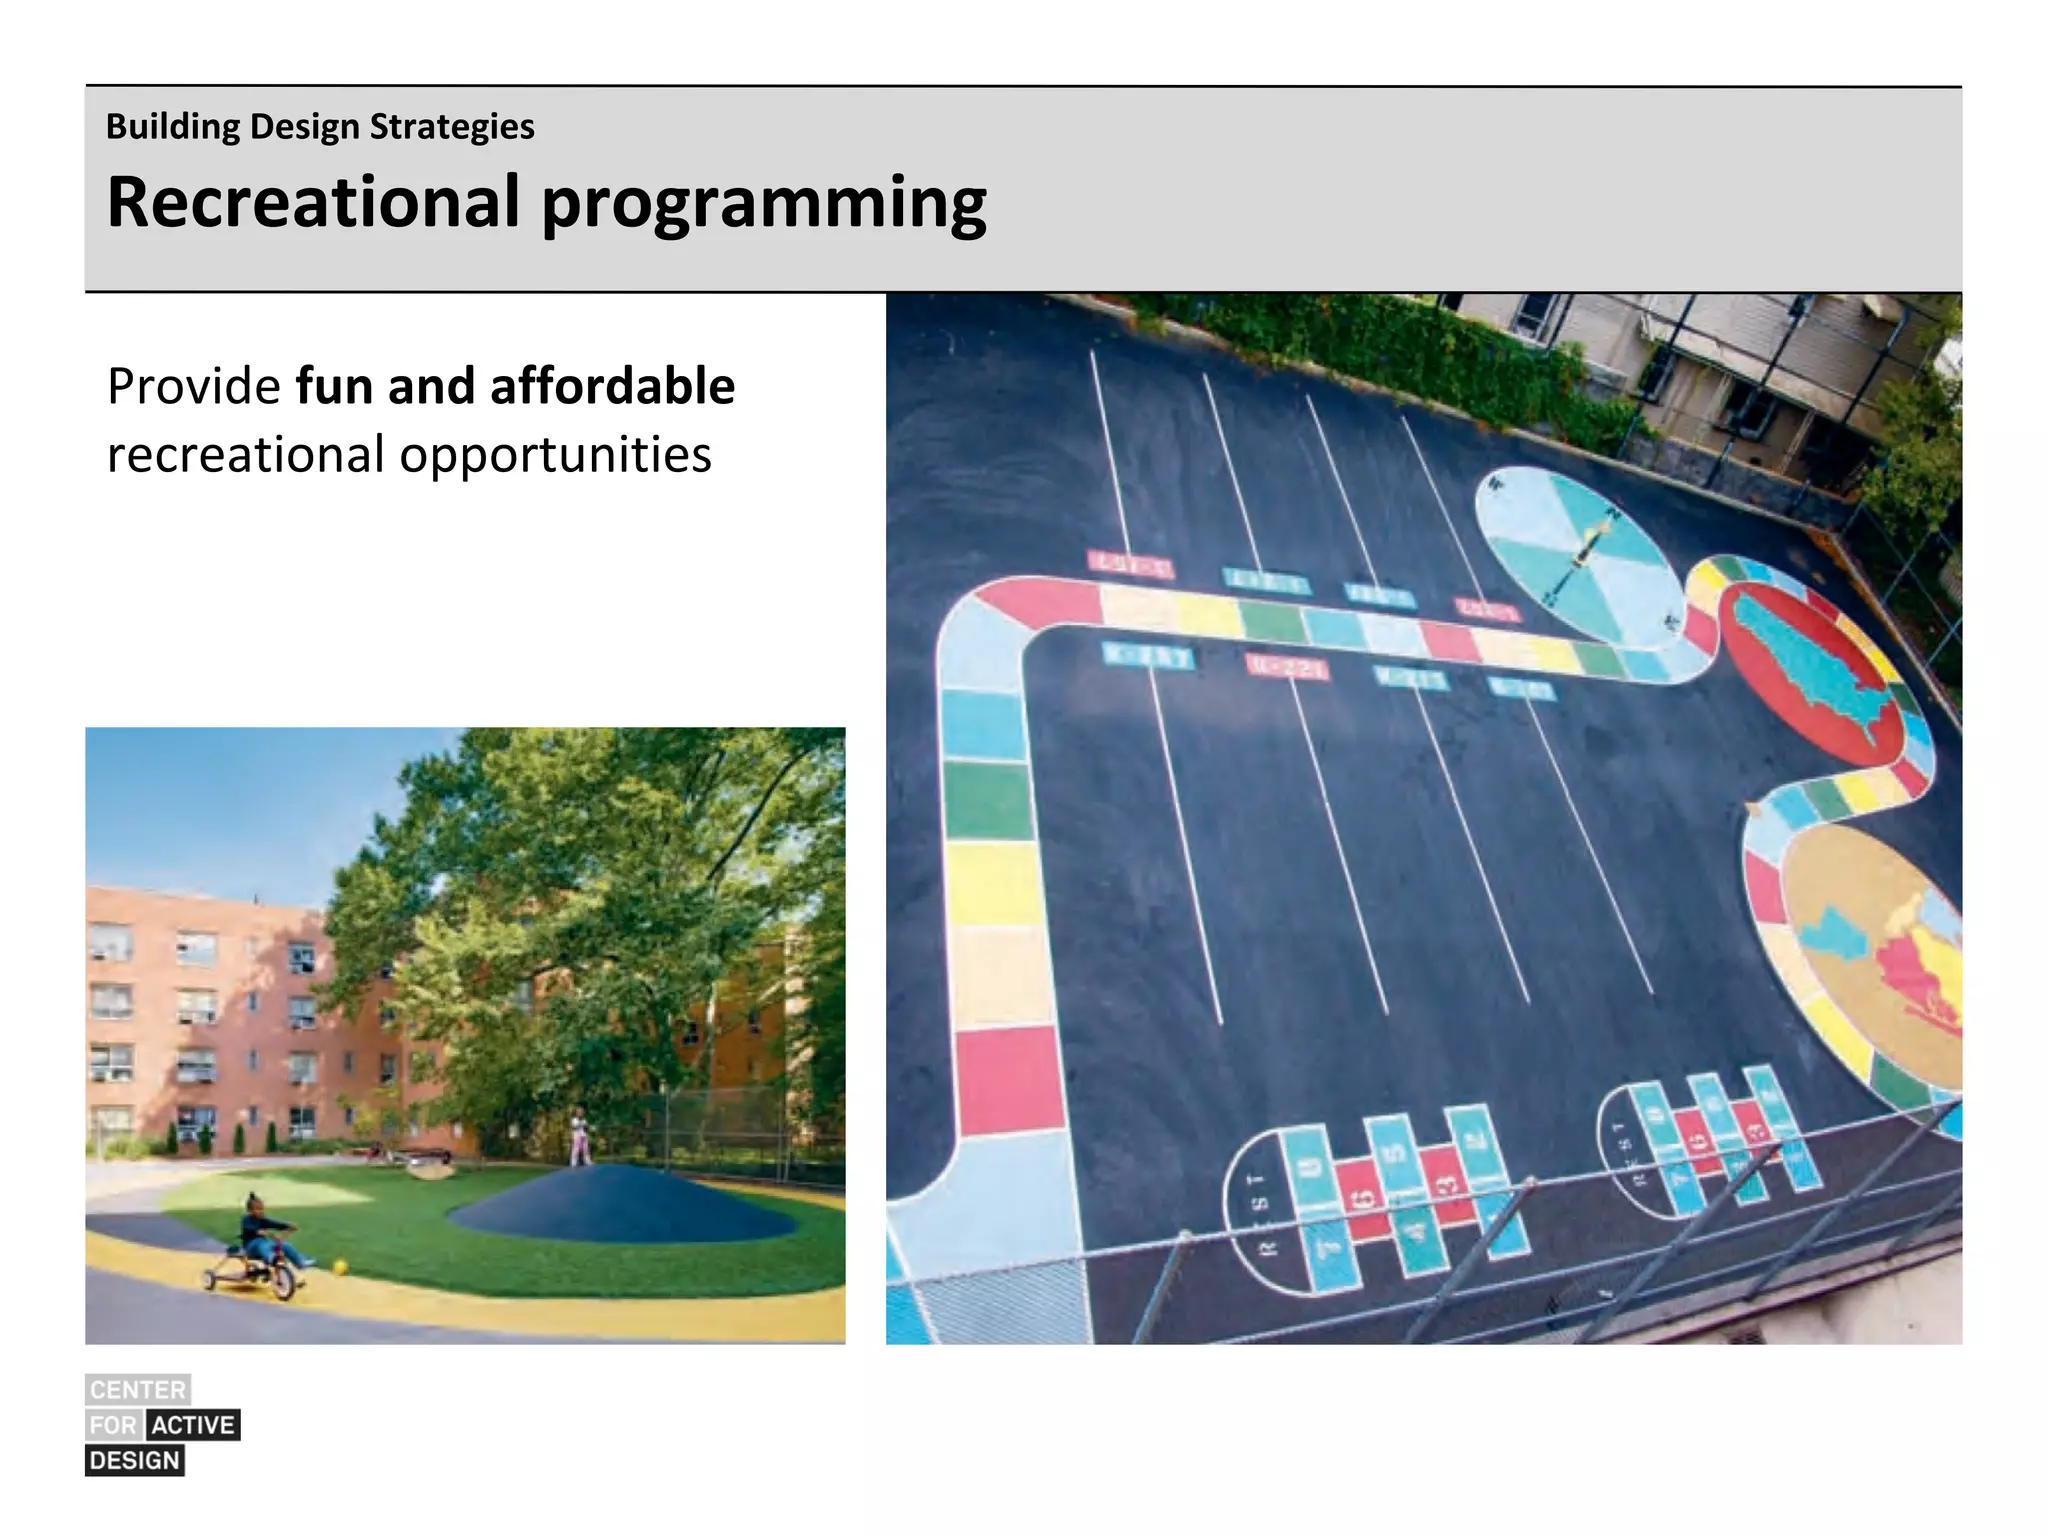
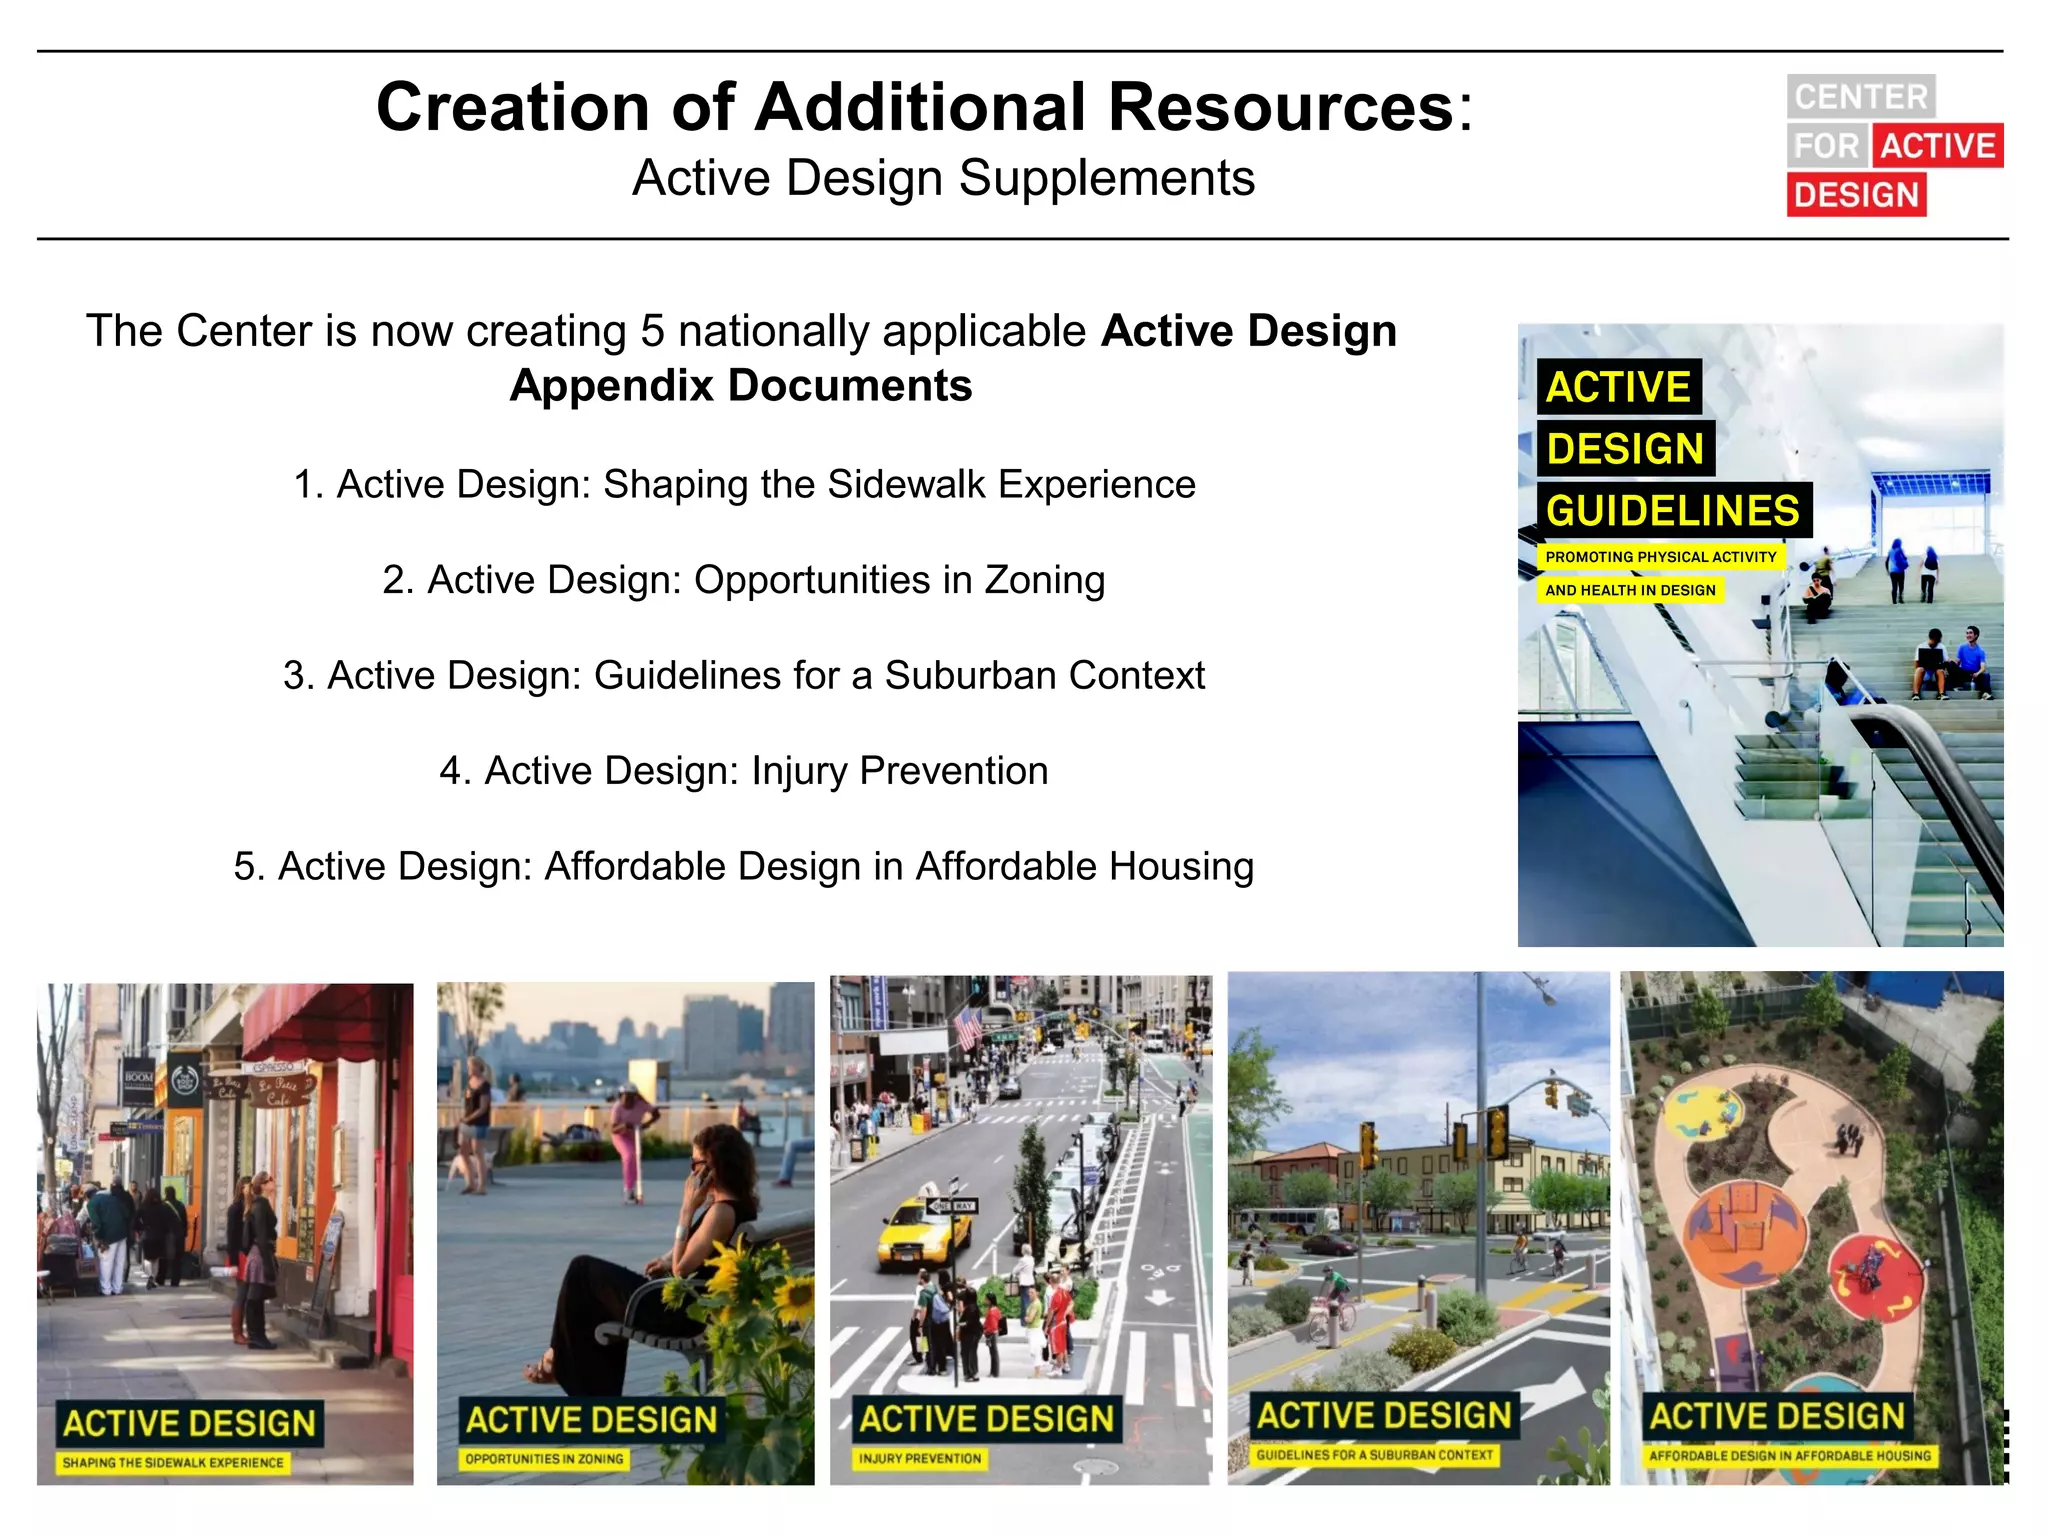
SlideShare a Scribd company logo
1 of 73
Active Design –
Creating Opportunities
for Active Living within
Communities


David Burney, Commissioner,
New York City Department of
Design and Construction
THE 19th CENTURY:                              THE 21st CENTURY:


         Infectious Diseases

                                                        Chronic Diseases,
                                                            many of which are

                                                           “Diseases of Energy”


                                                  The emerging design solutions for health
19th Century codes, planning and infrastructure
                                                    parallel sustainable design solutions
  as weapons in the battle against contagious
100+ years ago, urban conditions were a breeding ground
            for infectious disease epidemics

                           Over-crowding

                         in Lower Manhattan
                                                       Major epidemics:
                              1910 density:

                          114,000 people/ sq. mi.
                                                    Air/droplet-borne diseases:
                                                                TB


                              +
                              2011 density:

                          67,000 people/ sq. mi.
                                                      Water-borne diseases:
                      Inadequate systems for
                                                              Cholera
                      garbage, water, and sewer,

                       leading to pervasive filth
                                                      Vector-borne diseases:
                      and polluted water supplies
                                                            Yellow-fever
The response was through built environment interventions

                     1842     New York’s water system established – an

                       aqueduct brings fresh water from Westchester.


                     1857      NYC creates Central Park, hailed as “ventilation   for the

                       working man’s lungs”, continuing              construction through the

                       height of the Civil War


                     1881      Dept. of Street-sweeping created, which eventually

                       becomes the Department of Sanitation


                     1901      New York State Tenement House Act banned           the
The Results: Infectious disease rates

             BEFORE the wide use
                of antibiotics!


57.1%         45.8%
                                    AFTER the wide use
                                      of antibiotics!


               11.3%               2.3%
                                        9%
 1880            1940                  2011
The epidemics of today are:

                CHRONIC DISEASES
             (obesity, diabetes, heart disease
                    & strokes, cancers)

                 Top 5 Causes of Death in U.S.:

         1.Tobacco, 2. Obesity, 3. High Blood Pressure,
            4. High Blood Sugar, 5. Physical Inactivity


Energy in:                                        Energy out:
Food                                              Exercise
Obesity Trends* Among U.S. Adults
BRFSS, 1985
                              (*BMI ≥30, or ~ 30 lbs overweight for 5’ 4” woman)


     No Data        <10%         10%–14%


 Source: U.S. Centers for Disease Control and Prevention (CDC)
Obesity Trends* Among U.S. Adults
                           BRFSS, 1986
                             (*BMI ≥30, or ~ 30 lbs overweight for 5’ 4” woman)


    No Data        <10%         10%–14%


Source: U.S. Centers for Disease Control and Prevention (CDC)
Obesity Trends* Among U.S. Adults
                           BRFSS, 1987
                             (*BMI ≥30, or ~ 30 lbs overweight for 5’ 4” woman)


    No Data        <10%         10%–14%


Source: U.S. Centers for Disease Control and Prevention (CDC)
Obesity Trends* Among U.S. Adults
                           BRFSS, 1988
                             (*BMI ≥30, or ~ 30 lbs overweight for 5’ 4” woman)


    No Data        <10%         10%–14%


Source: U.S. Centers for Disease Control and Prevention (CDC)
Obesity Trends* Among U.S. Adults
                           BRFSS, 1989
                             (*BMI ≥30, or ~ 30 lbs overweight for 5’ 4” woman)


    No Data        <10%         10%–14%


Source: U.S. Centers for Disease Control and Prevention (CDC)
Obesity Trends* Among U.S. Adults
                           BRFSS, 1990
                             (*BMI ≥30, or ~ 30 lbs overweight for 5’ 4” woman)


    No Data        <10%         10%–14%


Source: U.S. Centers for Disease Control and Prevention (CDC)
Obesity Trends* Among U.S. Adults
                           BRFSS, 1991
                             (*BMI ≥30, or ~ 30 lbs overweight for 5’ 4” woman)


     No Data        <10%         10%–14%           15%-19%


Source: U.S. Centers for Disease Control and Prevention (CDC)
Obesity Trends* Among U.S. Adults
                           BRFSS, 1992
                             (*BMI ≥30, or ~ 30 lbs overweight for 5’ 4” woman)


     No Data        <10%         10%–14%           15%-19%


Source: U.S. Centers for Disease Control and Prevention (CDC)
Obesity Trends* Among U.S. Adults
                           BRFSS, 1993
                             (*BMI ≥30, or ~ 30 lbs overweight for 5’ 4” woman)


     No Data        <10%         10%–14%           15%-19%


Source: U.S. Centers for Disease Control and Prevention (CDC)
Obesity Trends* Among U.S. Adults
                           BRFSS, 1994
                             (*BMI ≥30, or ~ 30 lbs overweight for 5’ 4” woman)


     No Data        <10%         10%–14%           15%-19%


Source: U.S. Centers for Disease Control and Prevention (CDC)
Obesity Trends* Among U.S. Adults
                           BRFSS, 1995
                             (*BMI ≥30, or ~ 30 lbs overweight for 5’ 4” woman)


     No Data        <10%         10%–14%           15%-19%


Source: U.S. Centers for Disease Control and Prevention (CDC)
Obesity Trends* Among U.S. Adults
                           BRFSS, 1996
                             (*BMI ≥30, or ~ 30 lbs overweight for 5’ 4” woman)


     No Data        <10%         10%–14%           15%-19%


Source: U.S. Centers for Disease Control and Prevention (CDC)
Obesity Trends* Among U.S. Adults
                           BRFSS, 1997
                             (*BMI ≥30, or ~ 30 lbs overweight for 5’ 4” woman)


      No Data       <10%          10%–14%           15%-19%     20%


Source: U.S. Centers for Disease Control and Prevention (CDC)
Obesity Trends* Among U.S. Adults
                           BRFSS, 1998
                             (*BMI ≥30, or ~ 30 lbs overweight for 5’ 4” woman)


      No Data       <10%          10%–14%           15%-19%     20%


Source: U.S. Centers for Disease Control and Prevention (CDC)
Obesity Trends* Among U.S. Adults
                           BRFSS, 1999
                             (*BMI ≥30, or ~ 30 lbs overweight for 5’ 4” woman)


      No Data       <10%          10%–14%           15%-19%     20%


Source: U.S. Centers for Disease Control and Prevention (CDC)
Obesity Trends* Among U.S. Adults
                           BRFSS, 2000
                             (*BMI ≥30, or ~ 30 lbs overweight for 5’ 4” woman)


      No Data       <10%          10%–14%           15%-19%     20%


Source: U.S. Centers for Disease Control and Prevention (CDC)
Obesity Trends* Among U.S. Adults
                            BRFSS, 2001
                             (*BMI ≥30, or ~ 30 lbs overweight for 5’ 4” woman)


       No Data       <10%          10%–14%           15%-19%    20%-24%     25%


Source: U.S. Centers for Disease Control and Prevention (CDC)
Obesity Trends* Among U.S. Adults
                            BRFSS, 2002
                             (*BMI ≥30, or ~ 30 lbs overweight for 5’ 4” woman)


       No Data       <10%          10%–14%           15%-19%    20%-24%     25%


Source: U.S. Centers for Disease Control and Prevention (CDC)
Obesity Trends* Among U.S. Adults
                            BRFSS, 2003
                             (*BMI ≥30, or ~ 30 lbs overweight for 5’ 4” woman)


       No Data       <10%          10%–14%           15%-19%    20%-24%     25%


Source: U.S. Centers for Disease Control and Prevention (CDC)
Obesity Trends* Among U.S. Adults
                            BRFSS, 2004
                             (*BMI ≥30, or ~ 30 lbs overweight for 5’ 4” woman)


       No Data       <10%          10%–14%           15%-19%    20%-24%     25%


Source: U.S. Centers for Disease Control and Prevention (CDC)
Obesity Trends* Among U.S. Adults
                           BRFSS, 2005
                             (*BMI ≥30, or ~ 30 lbs overweight for 5’ 4” woman)


        No Data        <10%         10%–14%           15%-19%   20%-24%      25%-29%   30%


Source: U.S. Centers for Disease Control and Prevention (CDC)
Obesity Trends* Among U.S. Adults
                           BRFSS, 2006
                             (*BMI ≥30, or ~ 30 lbs overweight for 5’ 4” woman)


        No Data        <10%         10%–14%           15%-19%   20%-24%      25%-29%   30%


Source: U.S. Centers for Disease Control and Prevention (CDC)
Obesity Trends* Among U.S. Adults
                           BRFSS, 2007
                             (*BMI ≥30, or ~ 30 lbs overweight for 5’ 4” woman)


        No Data        <10%         10%–14%           15%-19%   20%-24%      25%-29%   30%


Source: U.S. Centers for Disease Control and Prevention (CDC)
Obesity Trends* Among U.S. Adults
                           BRFSS, 2008
                             (*BMI ≥30, or ~ 30 lbs overweight for 5’ 4” woman)


        No Data        <10%         10%–14%           15%-19%   20%-24%      25%-29%   30%


Source: U.S. Centers for Disease Control and Prevention (CDC)
Obesity Trends* Among U.S. Adults
                           BRFSS, 2009
                             (*BMI ≥30, or ~ 30 lbs overweight for 5’ 4” woman)


        No Data        <10%         10%–14%           15%-19%   20%-24%      25%-29%   30%


Source: U.S. Centers for Disease Control and Prevention (CDC)
Diabetes trends among U.S. adults


     1994                                   2000                                  2009


No Data       <4.5%          4.5-5.9%           6.0-7.4%                7.5-8.9%            >9.0%


    Source: CDC’s Division of Diabetes Translation. National Diabetes Surveillance System
                      available at http://www.cdc.gov/diabetes/statistics
Only half of NYC elementary school children are at a healthy weight
                                                                         Underweight
                                                                             4%
                                    Obese
                                     24%


                                                                                       Normal
                                                                                       Weight
                                                                                        53%
                         Overweight
                            19%


 Source: NYC Department of Health and Mental Hygiene, NYC Vital Signs, 2003.
World Obesity rates among adults - 2011
Obesity and Diabetes have increased rapidly.
Our genetics have not changed in one generation, but
             our built environment has!
Growing EvidenceResearch Improving Health through Building, Street
 Evidence-based Base for shows that we can Increase Physical
and Neighborhood Design Street and Neighborhood Design
 Activity through Building,
 OOD SCALES
   Designing to      Point-of-Decision stair prompts
   increase stair        Signs placed at elevators & escalators encouraging stair use, w/ info on
   use                   benefits of stair use
                         Median 50% increase in stair use
                     Design and aesthetic interventions
                         Music & art in stairwells
                     Design stairs to be more convenient and visible
                     Skip-stop elevators
                          3300% increase in stair use

   Designing to
   increase active   Enhancing access to places for physical activity, such as creating
   recreation           walking trails or having onsite or nearby parks, playgrounds and
                        exercise facilities (homes & worksites)
                        increases leisure-time activity and weight loss

                     Walking, Bicycling and Transit-oriented development
   Designing to          Designs to improve street safety and aesthetics (less crime and traffic /
   increase active          more greening), having sidewalks and bike paths connected to
   transportation           destinations, mixed land use, high population density
                         Median increase in physical activity 35% to 161%
WE CAN ADDRESS THESE ISSUES AT THE BUILDING,
Growing Evidence Base for Improving Health through Building, Street
STREET AND NEIGHBORHOOD SCALES
and Neighborhood Design
                  Increased access to healthy foods and beverages within food
  Increasing      environmentsaccess to healthy foods and beverages within food
                      Increased
  Access to           environments
  Healthy Food    Increased access to premises that provide healthy foods and
  and Beverages       Increased access to premises that provide healthy foods and
                  beverages – e.g. supermarkets, farmers markets, drinking water
                      beverages – e.g. supermarkets, farmers markets, drinking water
                  facilities
                      facilities


   Decreasing        Decreased exposure to unhealthy foods such as trans fats and
   Exposure to       sugary drinks
   Unhealthy
   Food and          Decreased exposure to unhealthy food premises
   Beverages


   Point-of-          Information at points of selection and purchase of food
   Decision
   Information
Translating Health Evidence into Non-Health Policies Affecting Health
KEY LESSONS LEARNED:
• The Need for Partnerships – Core and Extensive
• Finding Synergies and Co-Benefits
• Complementary Roles of Core Partners
    – Health: Presenting the available research-based evidence and the
       epidemiology of disease; organized early meetings/conferences to do so
    – Design and Construction, Transportation and City Planning: Ideas of what’s
       feasible in the current local context; identifying opportunities and
       mechanisms, including and especially synergistic efforts
    – Health: Playing a supporting role for implementing ideas – presenting the
       health evidence; assisting with strategy and planning, undertaking studies
       to inform implementation planning and evaluation; providing resources
       for coordination of intersectoral meetings, initiatives and follow-up
    – Design and Construction, Transportation and City Planning: Leadership and
       participation in the efforts
    – Researchers: evidence reviews and synthesis, evaluation research
• Garnering Review, Feedback and Inputs from an Extensive Group of Partners
• Using Evidence-Based and Best-Practice Strategies
• Using Annual Conferences as Strategic Milestones to Highlight Successes and
   Craft Strategic Next Steps with Extensive Group of Partners
• Key Roles for Peer-to-Peer Partnerships and Mentoring among Cities
Fit City Conferences


  Fit-City:
  Promoting Physical Activity Through Design


          Fit-City 3:
          Promoting Physical Activity Through Design
The Active Design Guidelines
Published in 2010, the Guidelines brought
together a number of best practices for
design professionals.

Chapters
1) Environmental Design and Health:
   Past and Present
2) Urban Design:
   Creating an Active City
1) Building Design:
   Creating Opportunities for
   Daily Physical Activity
1) Synergies with Sustainable and
   Universal Design

The Guidelines can be downloaded at:
  www.centerforactivedesign.org
Creation of the Guidelines
Active Design Guidelines Team
                                  New York City Staff*                    Department of City Planning          Editor
                                                                          Alexandros Washburn, AIA             Irene Chang, March, MPhil
                                  Department of Design and                Chief Urban Designer                 Cheng+Snyder
                                  Construction
                                  David Burney, FAIA                      Skye Duncan, MSAUD, BArch            Community, Academic and
                                  Commissioner                            Associate Urban Designer             Private Sector
Michael Bloomberg                                                         Mayor’s Office of Management and     Ernest Hutton, Hutton Associates,
                                  Margo Woolley, AIA
MAYOR                                                                     Budget                               INC.
                                  Assistant Commissioner,
                                                                          Joyce Lee, AIA, LEED AP              Ellen Martin, 1100 Architects
                                  Architecture and Engineering
David Burney                                                              Chief Architect                      Linda Polack Marpillero Pollak,
                                  Division
COMMISSIONER                                                                                                   Architects
Department of Design and          Vitoria Milne, MID                      Academic Partners                    John Pucher, Bloustein School of
Construction                      Director, Office of Creative Services                                        Planning and Public Policy,
                                                                          Craig Zimring PhD.                   Rutgers University
                                  Department of Health and Mental         Professor, Georgia Institute of      Jessica Spiegel, 1100 Architects
Thomas Farley                                                             Technology
                                  Hygiene                                                                      William Stein, Dattner Architects
COMMISSIONER                                                              College of Architecture              Shin-Pei Tsay, Transportation
Department of Health and Mental   Karen Lee, MD, MHSc, FRCPC                                                   Alternatives
Hygiene                           Director, Built Environment             Gayle Nicoll, M.Arch, PhD, OAA
                                                                          Associate Professor and Chair,       Thanks to all the design
Janette Sadik-Khan                Sarah Wolf, MPH, RD                     University of Texas at San Antonio
                                  Built Environment Coordinator                                                practitioners and organizations
COMMISSIONER                                                              Department of Architecture           who participated in the 2009
Department of Transportation      Department of Transportation                                                 Design Charrette to help test the
                                                                          Julie Brand Zook, M.Arch
                                  Wendy Feuer, MA                         Researcher, Georgia Institute of     Guidelines prior to its publication.
Amanda Burden                     Assistant Commissioner of Urban         Technology
COMMISSIONER                      Design and Art, Division of Planning    College of Architecture
Department of City Planning       and Sustainability                                                           *We also thank the many city
                                                                          Reid Ewing, PhD                      agencies that gave input including
                                  Hanna Gustafsson                        Professor, University of Utah,       the Depts of Parks and
                                  Former Urban Fellow, Division of        Department of                        Recreation, Buildings, Housing
                                  Planning and Sustainability             City and Metropolitan Planning       Preservation and Development,
                                                                                                               School Construction Authority,
                                                                          American Institute of Architects     Aging, and Mayor’s Offices of
                                                                          New York Chapter                     Long-Term Planning and
                                                                          Fredric Bell, FAIA                   Sustainability, and of People with
                                                                          Executive Director                   Disabilities.
                                                                          Sherida Paulsen, FAIA
                                                                          2009 President
IMPLEMENTATION: Inter-Sectoral City Policy Initiatives on
Built Environment

    Synergies:
    • Health
    • Safety
    • Environmental
      Sustainability
    • Universal Accessibility
    • Economic Benefits


www.nyc.gov/adg
Co-benefits of Active Design: Improve the Environment


                           Fuel / Electricity Use   Air Quality   Obesity/Diabetes/
                                                                    Heart Disease
Biking or walking rather             √                  √                √
than automotive
transport
Stairs rather than                   √                  √                √
elevators and escalators


Active recreation rather             √                  √                √
than television


Safe tap water rather                √                  √                √
than bottled and canned
beverages
Fresh local produce                  √                  √                √
rather than unhealthy
processed foods
Co-benefits: Create more accessible places


 • Creating safer places to
   walk, take transit, & for the
   elderly and people with
   disabilities.

 • Making elevators more
   available for those who need
   them.
Co-benefits: Save money, particularly for low-income people


         People in walkable, transit-rich neighborhoods spend only
     9 percent of their monthly income on transportation costs; those in
             auto-dependent neighborhoods spend 25 percent.

     Source: Center for Transit-Oriented Development
Building Design Strategies
 Site + Building Design
Stairs: promoting easy access
Stairs: accessibility, visibility, convenience
 Stair of Prominence         Skip Stop Elevators to   Enclosed stairs that use
 and Visual Interest         increase stair use       Fire Rated Glass to
                                                      Increase Visibility
Building Design Strategies

Stairs: aesthetics


Stairs to receive plenty     Art in stairs to increase   Stairs designed to
of natural daylight             visual interest          invite users
Building Strategies

Stairs: signage and prompts

Motivational Signage placed at points of decision
Promoting stair use at work – Stair Week
City Policy + Implementation
Use of LEED Green Building Credits that Promote PA
 Development density            Public transportation
 and community                  access                   Bicycle storage and
 connectivity                                            changing rooms


                                LEED Physical Activity
Building Design Strategies

Recreational programming

Provide fun and affordable
recreational opportunities
City Policy + Implementation
NYC Green Codes


                    Increasing drinking water access through better tap
                    water facilities – passed in Plumbing Code
City Policy + Implementation
NYC Green Codes


              How do we incentivize good stair design and remove
              barriers to stair use through Zoning and Building Codes?
NYC// Complete Neighborhoods
Walkable
NYC: Complete Neighborhoods
         JOBS   LOCAL RETAIL   OPEN SPACE
City Policy + Implementation
 City Policy + Implementation
Zoning for Bicycle Parking


                    Zoning for Bicycle Parking:
                    Increasing active transport by providing
                    safe and secure parking for bike commuters
Site + Building Design
Bicycle parking + storage


                            Secure Bike Storage with Easy Access
City Policy + Implementation
NYC World Class Streets


                                Remaking NYC’s public realm:
                                •   Street Design Manual
                                •   Plaza Program
                                •   World Class Boulevards
                                •   Complete Streets Projects and
                                    Design Standards, incl. bike lanes
                                •   Public Art Program
                                •   New Streetscape Materials
                                •   Coordinated Street Furniture
                                    Program
                                •   Weekend Pedestrian and
                                    Cycling Streets
Urban Design
Pedestrian Environment / Streetscape
 Provide places of rest                    Enliven the sidewalk
                                       Attractive plazas have
 to complement                             with street cafes
                                       mix of trees, lighting, &
 active walking                        movable/ fixed seating
 and jogging


                                         Integrate public art
                                         into the streetscape
Playstreets
 On request of DOT, Playstreets Coordinator hired by Health


 Evaluation by Health:

 Ages of children attending Playstreets (from surveys): Ages 1-13

 Visited Playstreets at least once before: >80%

 Average length of time children stayed at the Playstreet (from surveys):
    ~1.5hours
 Most likely activity if children had not come to the Playstreet:
         TV or other inside activity:                      52%
         Outdoor activity:                                 38%
         Indoor or outdoor activity equally likely:        10%
owww.nyc.gov/dot
o www.facebook.com/NYCDOT
        o #NYC_DOT
Transit: Infrastructure

Provide attractive and sheltered seating
        areas to encourage use
            of transit routes
                                           Bus Rapid Transit systems
                                            for more convenient and
                                                  faster travel
ty Policy + Implementation
                       Streetscape Components


                                                Steinway Street Master Plan
City Policy + Implementation
 City Policy + Implementation
Creation of Additional Active Spaces: Summer Streets
• DOT closes Park Avenue to traffic from
  Brooklyn Bridge to Central Park and the
  Upper East Side on Saturdays in August

• Evaluation:
    – Average amount of physical activity
      from distances walked, ran, biked on
      route: >40 minutes of vigorous
      physical activity, or >70 minutes of
      moderate physical activity
    – 24% of people were those who didn’t
      meet PA Recs
    – 87% of participants got to event by
      active modes
    – High Needs Neighborhoods and
      Neighborhoods Outside Manhattan
      underrepresented
City Policy + Implementation
NYC FRESH Program

                                  FRESH Food Store Areas
                                FRESH Food Store Program Areas
                                  where zoning and
                                  financial incentives
                                AdditionalFoodeas owherPreoFRESH efinasancial incentives may be available
                                FRESH ar St re gram Ar
                                  apply

                                  Additional areas where
                                Additional areas where FRESH financial incentives may be available
                                  FRESH financial
                                  incentives may be
                                  available


Zoning and tax incentives for providing fresh food options
in the city’s underserved areas with high health needs
Impacts

• Won 5 National Awards (Health Policy, Environmental Protection,
  Sustainable Buildings, Architecture)

• Distributed >15,000 copies of ADGs nationally & internationally

• Trained >3,000 built environment professionals in NYC and U.S.

• Mentored 14 other U.S. cities and communities
  (others now adopting initiatives such as integrating use of ADGs,
  “Burn Calories, Not Electricity” Stair Prompts, Playstreets, Fit City)
Impacts
To date, NYC has…

•Increased:
       - Commuter cycling 262%
       - Bus and subway ridership 10%
       - Stair use - >40% increase at 9 mos in 10-story low-income
                    housing
       - Places for children’s play - ~40 new Playstreets permitted

• Decreased:
     - Traffic fatalities 30%
     - Traffic volumes 25%
     - Car registrations 5%

• Started Reversing Childhood Obesity (also in San Diego!)
Established in New York City in 2012, the Center for
                       Active Design works to support prevention and
                       control of obesity and chronic diseases by increasing
                       opportunities for physical activity through the design
                       of buildings, streets, and neighborhoods.


The Center for Active Design is a non-profit
organization that has grown out of an inter-
disciplinary partnership among New York
City agencies, the American Institute of
Architects New York City Chapter (AIANY),
private sector architects and developers,
and academic partners. After collaboratively
developing the Active Design Guidelines
published in 2010, the Center for Active
Design      was   established    to   foster
widespread implementation of Active
Design strategies among public and private
sector design, planning, policy and real
estate professionals.

 www.centerforactivedesign.org
Anticipated Programs at the Center for Active Design


 Award and Certification Program: recognizing and providing incentives for individual
  and project achievements in Active Design,

 Training: for all design and real estate professions,

 Technical Assistance: ranging from providing resources for implementing strategies for
  building managers to research and rollout consulting to other municipalities nationally
  and internationally,

 Policy Development:: implementing zoning, code, and other incentives,

 Evaluation and Research: linking to researchers, ongoing data collection and support,

 Communications: using printed material, website and other material for education and
  training

 Knowledge Translation and Resource Development: using available research for
  updating practice and policy materials,


    www.centerforactivedesign.org
Fit-City:
        Promoting Physical Activity Through Design
                                                      Fit-City 3:
                                                     Promoting Physical Activity Thro


  Fit City conferences have
helped promote Active Design
Implementing the Guidelines
Technical assistance and training
Testing the guidelines
through an interactive and
interdisciplinary
Design Charrette

Participants:
Government Agencies/
Developers/
Architects/Landscape
Architects/Engineers
Mentoring communities in public healthPartnership environment
       Built Environment & Health and the built
Supported by CDC
    Communities
 Putting Prevention
 to Work Mentoring
        grant

   Partnership
  between NYC
DOHMH, AIANY, and
 14 communities

 All communities
 are recipients of
  CPPW grants


       Boston MA ~ Cherokee Nation OK ~ Chicago IL ~ Cook County IL ~
  Douglas County NE ~ Jefferson County AL ~ King County WA ~ Louisville KY ~
Miami-Dade County FL ~ Multnomah County OR ~ Nashville TN ~ Philadelphia PA ~
                       Pima County AZ ~ San Diego CA
Creation of Additional Resources:
                             Active Design Supplements

The Center is now creating 5 nationally applicable Active Design
                    Appendix Documents

          1. Active Design: Shaping the Sidewalk Experience

               2. Active Design: Opportunities in Zoning

         3. Active Design: Guidelines for a Suburban Context

                  4. Active Design: Injury Prevention

       5. Active Design: Affordable Design in Affordable Housing
David Burney - How New York is getting active

More Related Content

What's hot

Robyn Toomath on obesity in New Zealand
Robyn Toomath on obesity in New ZealandRobyn Toomath on obesity in New Zealand
Robyn Toomath on obesity in New Zealandmhjbnz
 
Hue Ump English Club Dec 09 Health Overview
Hue Ump English Club Dec 09 Health OverviewHue Ump English Club Dec 09 Health Overview
Hue Ump English Club Dec 09 Health OverviewBinhThang
 
Diabetes in the Arabs world .
Diabetes in the Arabs world .Diabetes in the Arabs world .
Diabetes in the Arabs world .Mohamed Herzallah
 
NON-COMMUNICABLE DISEASES WITH REFERENCE TO OBESITY AND CA CERVIX
NON-COMMUNICABLE DISEASES WITH REFERENCE TO OBESITY AND CA CERVIXNON-COMMUNICABLE DISEASES WITH REFERENCE TO OBESITY AND CA CERVIX
NON-COMMUNICABLE DISEASES WITH REFERENCE TO OBESITY AND CA CERVIXAP Singh
 
Métodos de investigación en epidemiología ambiental
Métodos de investigación en epidemiología ambientalMétodos de investigación en epidemiología ambiental
Métodos de investigación en epidemiología ambientalSalud en todas
 
Mortality & Morbidity in the 21st Century
Mortality & Morbidity in the 21st CenturyMortality & Morbidity in the 21st Century
Mortality & Morbidity in the 21st CenturyPaul Coelho, MD
 
Tuberculosis Control in Cuba and Haiti
Tuberculosis Control in Cuba and HaitiTuberculosis Control in Cuba and Haiti
Tuberculosis Control in Cuba and HaitiKathryn Cicerchi
 
Nutrition for Women health
Nutrition for Women healthNutrition for Women health
Nutrition for Women healthEkta Belwal
 
Oct2010_zinc_saves_kids_london_panel_debate
Oct2010_zinc_saves_kids_london_panel_debateOct2010_zinc_saves_kids_london_panel_debate
Oct2010_zinc_saves_kids_london_panel_debateZinc Saves Kids
 
Mortality measurement
Mortality measurementMortality measurement
Mortality measurementAbino David
 
Morbidity and mortality slides
Morbidity and mortality slidesMorbidity and mortality slides
Morbidity and mortality slidesjesus4u
 
Health outcomes of Aboriginal individuals with early onset diabetes
Health outcomes of Aboriginal individuals with early onset diabetesHealth outcomes of Aboriginal individuals with early onset diabetes
Health outcomes of Aboriginal individuals with early onset diabetesKelli Buckreus
 
Hispanic Heritage Month Shining a Light on Hispanic Health Statistics
Hispanic Heritage Month Shining a Light on Hispanic Health StatisticsHispanic Heritage Month Shining a Light on Hispanic Health Statistics
Hispanic Heritage Month Shining a Light on Hispanic Health StatisticsMedical Business Systems
 

What's hot (20)

Robyn Toomath on obesity in New Zealand
Robyn Toomath on obesity in New ZealandRobyn Toomath on obesity in New Zealand
Robyn Toomath on obesity in New Zealand
 
Hue Ump English Club Dec 09 Health Overview
Hue Ump English Club Dec 09 Health OverviewHue Ump English Club Dec 09 Health Overview
Hue Ump English Club Dec 09 Health Overview
 
Diabetes in the Arabs world .
Diabetes in the Arabs world .Diabetes in the Arabs world .
Diabetes in the Arabs world .
 
NON-COMMUNICABLE DISEASES WITH REFERENCE TO OBESITY AND CA CERVIX
NON-COMMUNICABLE DISEASES WITH REFERENCE TO OBESITY AND CA CERVIXNON-COMMUNICABLE DISEASES WITH REFERENCE TO OBESITY AND CA CERVIX
NON-COMMUNICABLE DISEASES WITH REFERENCE TO OBESITY AND CA CERVIX
 
Every Step Counts
Every  Step  CountsEvery  Step  Counts
Every Step Counts
 
Métodos de investigación en epidemiología ambiental
Métodos de investigación en epidemiología ambientalMétodos de investigación en epidemiología ambiental
Métodos de investigación en epidemiología ambiental
 
Obesity epid624
Obesity epid624Obesity epid624
Obesity epid624
 
Causes of death
Causes of deathCauses of death
Causes of death
 
Mortality & Morbidity in the 21st Century
Mortality & Morbidity in the 21st CenturyMortality & Morbidity in the 21st Century
Mortality & Morbidity in the 21st Century
 
Health Indicators.. Dr.Padmesh
Health Indicators.. Dr.PadmeshHealth Indicators.. Dr.Padmesh
Health Indicators.. Dr.Padmesh
 
Tuberculosis Control in Cuba and Haiti
Tuberculosis Control in Cuba and HaitiTuberculosis Control in Cuba and Haiti
Tuberculosis Control in Cuba and Haiti
 
Mortality
MortalityMortality
Mortality
 
Nutrition for Women health
Nutrition for Women healthNutrition for Women health
Nutrition for Women health
 
Oct2010_zinc_saves_kids_london_panel_debate
Oct2010_zinc_saves_kids_london_panel_debateOct2010_zinc_saves_kids_london_panel_debate
Oct2010_zinc_saves_kids_london_panel_debate
 
Mortality measurement
Mortality measurementMortality measurement
Mortality measurement
 
Morbidity and mortality slides
Morbidity and mortality slidesMorbidity and mortality slides
Morbidity and mortality slides
 
Diabetes mellitus, plague of the century
Diabetes mellitus, plague of the centuryDiabetes mellitus, plague of the century
Diabetes mellitus, plague of the century
 
Health outcomes of Aboriginal individuals with early onset diabetes
Health outcomes of Aboriginal individuals with early onset diabetesHealth outcomes of Aboriginal individuals with early onset diabetes
Health outcomes of Aboriginal individuals with early onset diabetes
 
Hispanic Heritage Month Shining a Light on Hispanic Health Statistics
Hispanic Heritage Month Shining a Light on Hispanic Health StatisticsHispanic Heritage Month Shining a Light on Hispanic Health Statistics
Hispanic Heritage Month Shining a Light on Hispanic Health Statistics
 
Malnutrition and economic development
Malnutrition and economic developmentMalnutrition and economic development
Malnutrition and economic development
 

Similar to David Burney - How New York is getting active

WELLVIS! - The Connection Between WELLness and serVICE!
WELLVIS! - The Connection Between WELLness and serVICE!WELLVIS! - The Connection Between WELLness and serVICE!
WELLVIS! - The Connection Between WELLness and serVICE!Joey Traywick
 
Obesity trends 2010
Obesity trends 2010Obesity trends 2010
Obesity trends 2010kellybolton
 
Tackling Childhood Obesity The Role Of Good Communications
Tackling Childhood Obesity   The Role Of Good CommunicationsTackling Childhood Obesity   The Role Of Good Communications
Tackling Childhood Obesity The Role Of Good Communicationsbevpostma
 
Obesity trends 2010
Obesity trends 2010Obesity trends 2010
Obesity trends 2010misteraugie
 
Obesity Trends 2007
Obesity Trends 2007Obesity Trends 2007
Obesity Trends 2007hende
 
Aetna Presentation Obesity
Aetna Presentation ObesityAetna Presentation Obesity
Aetna Presentation ObesityDanny Santibanez
 
Obesity Trends in U.S. from 1985 through 2010
Obesity Trends in U.S. from 1985 through 2010Obesity Trends in U.S. from 1985 through 2010
Obesity Trends in U.S. from 1985 through 2010Art Rothafel
 
Obesity trends 1985-2010
Obesity trends 1985-2010Obesity trends 1985-2010
Obesity trends 1985-2010Jerry Sanchez
 
Childhoodobesity ppt2-090624103709-phpapp02
Childhoodobesity ppt2-090624103709-phpapp02Childhoodobesity ppt2-090624103709-phpapp02
Childhoodobesity ppt2-090624103709-phpapp02Vandana Verma
 
Childhood Obesity.Ppt 2
Childhood Obesity.Ppt 2Childhood Obesity.Ppt 2
Childhood Obesity.Ppt 2emkoehn
 
Obesity trends 2010
Obesity trends 2010Obesity trends 2010
Obesity trends 2010mbluestone94
 
Obesity trends 2010
Obesity trends 2010Obesity trends 2010
Obesity trends 2010efranck047
 
Obesity trends 2010
Obesity trends 2010Obesity trends 2010
Obesity trends 2010mbluestone94
 
Social and cultural health factorsUsing Data in Public and Com.docx
Social and cultural health factorsUsing Data in Public and Com.docxSocial and cultural health factorsUsing Data in Public and Com.docx
Social and cultural health factorsUsing Data in Public and Com.docxwhitneyleman54422
 
Obesity trends 2010
Obesity trends 2010Obesity trends 2010
Obesity trends 2010kevshp
 
obesity_trends_2009
obesity_trends_2009obesity_trends_2009
obesity_trends_2009ravikolli
 
Obesity trends 2009
Obesity trends 2009Obesity trends 2009
Obesity trends 2009Dane Conrad
 

Similar to David Burney - How New York is getting active (20)

WELLVIS! - The Connection Between WELLness and serVICE!
WELLVIS! - The Connection Between WELLness and serVICE!WELLVIS! - The Connection Between WELLness and serVICE!
WELLVIS! - The Connection Between WELLness and serVICE!
 
Obesity trends 2010
Obesity trends 2010Obesity trends 2010
Obesity trends 2010
 
Tackling Childhood Obesity The Role Of Good Communications
Tackling Childhood Obesity   The Role Of Good CommunicationsTackling Childhood Obesity   The Role Of Good Communications
Tackling Childhood Obesity The Role Of Good Communications
 
Obesity trends 2010
Obesity trends 2010Obesity trends 2010
Obesity trends 2010
 
Obesity Trends 2007
Obesity Trends 2007Obesity Trends 2007
Obesity Trends 2007
 
Aetna Presentation Obesity
Aetna Presentation ObesityAetna Presentation Obesity
Aetna Presentation Obesity
 
Obesity Trends in U.S. from 1985 through 2010
Obesity Trends in U.S. from 1985 through 2010Obesity Trends in U.S. from 1985 through 2010
Obesity Trends in U.S. from 1985 through 2010
 
CDC U.S. Obesity Trends Maps,1999-2009
CDC U.S. Obesity Trends  Maps,1999-2009CDC U.S. Obesity Trends  Maps,1999-2009
CDC U.S. Obesity Trends Maps,1999-2009
 
Obesity trends 1985-2010
Obesity trends 1985-2010Obesity trends 1985-2010
Obesity trends 1985-2010
 
Childhoodobesity ppt2-090624103709-phpapp02
Childhoodobesity ppt2-090624103709-phpapp02Childhoodobesity ppt2-090624103709-phpapp02
Childhoodobesity ppt2-090624103709-phpapp02
 
Childhood Obesity.Ppt 2
Childhood Obesity.Ppt 2Childhood Obesity.Ppt 2
Childhood Obesity.Ppt 2
 
Obesity trends 2010
Obesity trends 2010Obesity trends 2010
Obesity trends 2010
 
Obesity trends 2010
Obesity trends 2010Obesity trends 2010
Obesity trends 2010
 
Obesity trends 2010
Obesity trends 2010Obesity trends 2010
Obesity trends 2010
 
Overvekt i USA: 1985 - 2010
Overvekt i USA: 1985 - 2010Overvekt i USA: 1985 - 2010
Overvekt i USA: 1985 - 2010
 
Social and cultural health factorsUsing Data in Public and Com.docx
Social and cultural health factorsUsing Data in Public and Com.docxSocial and cultural health factorsUsing Data in Public and Com.docx
Social and cultural health factorsUsing Data in Public and Com.docx
 
Obesity trends 2010
Obesity trends 2010Obesity trends 2010
Obesity trends 2010
 
Obesity trends 2009
Obesity trends 2009Obesity trends 2009
Obesity trends 2009
 
obesity_trends_2009
obesity_trends_2009obesity_trends_2009
obesity_trends_2009
 
Obesity trends 2009
Obesity trends 2009Obesity trends 2009
Obesity trends 2009
 

More from Design Council

Fashion Revolution: Systemic Design
Fashion Revolution: Systemic Design Fashion Revolution: Systemic Design
Fashion Revolution: Systemic Design Design Council
 
Design council x The Point People: Systemic Design
Design council x The Point People: Systemic DesignDesign council x The Point People: Systemic Design
Design council x The Point People: Systemic DesignDesign Council
 
Tom Lloyd Presentation - Active by Design
Tom Lloyd Presentation - Active by DesignTom Lloyd Presentation - Active by Design
Tom Lloyd Presentation - Active by DesignDesign Council
 
Sam Hill Presentation - Active by Design
Sam Hill Presentation - Active by DesignSam Hill Presentation - Active by Design
Sam Hill Presentation - Active by DesignDesign Council
 
Camden Active Spaces Presentation - Active by Design
Camden Active Spaces Presentation - Active by DesignCamden Active Spaces Presentation - Active by Design
Camden Active Spaces Presentation - Active by DesignDesign Council
 
Harry Rutter Presentation - Active by Design
Harry Rutter Presentation - Active by DesignHarry Rutter Presentation - Active by Design
Harry Rutter Presentation - Active by DesignDesign Council
 
Mandy Ayres - Active by Design
Mandy Ayres - Active by DesignMandy Ayres - Active by Design
Mandy Ayres - Active by DesignDesign Council
 
Tom Doust - Active by Design
Tom Doust - Active by DesignTom Doust - Active by Design
Tom Doust - Active by DesignDesign Council
 
Phillippa Banister Prseentation - Active by Design
Phillippa Banister Prseentation - Active by DesignPhillippa Banister Prseentation - Active by Design
Phillippa Banister Prseentation - Active by DesignDesign Council
 
Sam Young Presentation - Active by Design
Sam Young Presentation - Active by DesignSam Young Presentation - Active by Design
Sam Young Presentation - Active by DesignDesign Council
 
Eloise Dey Presentation - Active by Design
Eloise Dey Presentation - Active by DesignEloise Dey Presentation - Active by Design
Eloise Dey Presentation - Active by DesignDesign Council
 
Sue Foster Presentation - Active by Design
Sue Foster Presentation - Active by DesignSue Foster Presentation - Active by Design
Sue Foster Presentation - Active by DesignDesign Council
 
Claire McDonald Presentation - Active by Design
Claire McDonald Presentation - Active by DesignClaire McDonald Presentation - Active by Design
Claire McDonald Presentation - Active by DesignDesign Council
 
Mike Loosemore Presentation - Active by Design
Mike Loosemore Presentation - Active by DesignMike Loosemore Presentation - Active by Design
Mike Loosemore Presentation - Active by DesignDesign Council
 
Lucy Saunders Presentation - Active by Design
Lucy Saunders Presentation - Active by DesignLucy Saunders Presentation - Active by Design
Lucy Saunders Presentation - Active by DesignDesign Council
 
Riccardo Marini Presentation - Active by Design
Riccardo Marini Presentation - Active by DesignRiccardo Marini Presentation - Active by Design
Riccardo Marini Presentation - Active by DesignDesign Council
 
Simon Allford Presentation - Active by Design
Simon Allford Presentation - Active by DesignSimon Allford Presentation - Active by Design
Simon Allford Presentation - Active by DesignDesign Council
 
Cabe Design Council - Estate of the Nation by Alison Brooks
 Cabe Design Council -  Estate of the Nation by Alison Brooks Cabe Design Council -  Estate of the Nation by Alison Brooks
Cabe Design Council - Estate of the Nation by Alison BrooksDesign Council
 
Leading Business by Design
Leading Business by DesignLeading Business by Design
Leading Business by DesignDesign Council
 
Bee Lab presentation by Daniel Charny
Bee Lab presentation by Daniel CharnyBee Lab presentation by Daniel Charny
Bee Lab presentation by Daniel CharnyDesign Council
 

More from Design Council (20)

Fashion Revolution: Systemic Design
Fashion Revolution: Systemic Design Fashion Revolution: Systemic Design
Fashion Revolution: Systemic Design
 
Design council x The Point People: Systemic Design
Design council x The Point People: Systemic DesignDesign council x The Point People: Systemic Design
Design council x The Point People: Systemic Design
 
Tom Lloyd Presentation - Active by Design
Tom Lloyd Presentation - Active by DesignTom Lloyd Presentation - Active by Design
Tom Lloyd Presentation - Active by Design
 
Sam Hill Presentation - Active by Design
Sam Hill Presentation - Active by DesignSam Hill Presentation - Active by Design
Sam Hill Presentation - Active by Design
 
Camden Active Spaces Presentation - Active by Design
Camden Active Spaces Presentation - Active by DesignCamden Active Spaces Presentation - Active by Design
Camden Active Spaces Presentation - Active by Design
 
Harry Rutter Presentation - Active by Design
Harry Rutter Presentation - Active by DesignHarry Rutter Presentation - Active by Design
Harry Rutter Presentation - Active by Design
 
Mandy Ayres - Active by Design
Mandy Ayres - Active by DesignMandy Ayres - Active by Design
Mandy Ayres - Active by Design
 
Tom Doust - Active by Design
Tom Doust - Active by DesignTom Doust - Active by Design
Tom Doust - Active by Design
 
Phillippa Banister Prseentation - Active by Design
Phillippa Banister Prseentation - Active by DesignPhillippa Banister Prseentation - Active by Design
Phillippa Banister Prseentation - Active by Design
 
Sam Young Presentation - Active by Design
Sam Young Presentation - Active by DesignSam Young Presentation - Active by Design
Sam Young Presentation - Active by Design
 
Eloise Dey Presentation - Active by Design
Eloise Dey Presentation - Active by DesignEloise Dey Presentation - Active by Design
Eloise Dey Presentation - Active by Design
 
Sue Foster Presentation - Active by Design
Sue Foster Presentation - Active by DesignSue Foster Presentation - Active by Design
Sue Foster Presentation - Active by Design
 
Claire McDonald Presentation - Active by Design
Claire McDonald Presentation - Active by DesignClaire McDonald Presentation - Active by Design
Claire McDonald Presentation - Active by Design
 
Mike Loosemore Presentation - Active by Design
Mike Loosemore Presentation - Active by DesignMike Loosemore Presentation - Active by Design
Mike Loosemore Presentation - Active by Design
 
Lucy Saunders Presentation - Active by Design
Lucy Saunders Presentation - Active by DesignLucy Saunders Presentation - Active by Design
Lucy Saunders Presentation - Active by Design
 
Riccardo Marini Presentation - Active by Design
Riccardo Marini Presentation - Active by DesignRiccardo Marini Presentation - Active by Design
Riccardo Marini Presentation - Active by Design
 
Simon Allford Presentation - Active by Design
Simon Allford Presentation - Active by DesignSimon Allford Presentation - Active by Design
Simon Allford Presentation - Active by Design
 
Cabe Design Council - Estate of the Nation by Alison Brooks
 Cabe Design Council -  Estate of the Nation by Alison Brooks Cabe Design Council -  Estate of the Nation by Alison Brooks
Cabe Design Council - Estate of the Nation by Alison Brooks
 
Leading Business by Design
Leading Business by DesignLeading Business by Design
Leading Business by Design
 
Bee Lab presentation by Daniel Charny
Bee Lab presentation by Daniel CharnyBee Lab presentation by Daniel Charny
Bee Lab presentation by Daniel Charny
 

David Burney - How New York is getting active

  • 1. Active Design – Creating Opportunities for Active Living within Communities David Burney, Commissioner, New York City Department of Design and Construction
  • 2. THE 19th CENTURY: THE 21st CENTURY: Infectious Diseases Chronic Diseases, many of which are “Diseases of Energy” The emerging design solutions for health 19th Century codes, planning and infrastructure parallel sustainable design solutions as weapons in the battle against contagious
  • 3. 100+ years ago, urban conditions were a breeding ground for infectious disease epidemics Over-crowding in Lower Manhattan Major epidemics: 1910 density: 114,000 people/ sq. mi. Air/droplet-borne diseases: TB + 2011 density: 67,000 people/ sq. mi. Water-borne diseases: Inadequate systems for Cholera garbage, water, and sewer, leading to pervasive filth Vector-borne diseases: and polluted water supplies Yellow-fever
  • 4. The response was through built environment interventions 1842 New York’s water system established – an aqueduct brings fresh water from Westchester. 1857 NYC creates Central Park, hailed as “ventilation for the working man’s lungs”, continuing construction through the height of the Civil War 1881 Dept. of Street-sweeping created, which eventually becomes the Department of Sanitation 1901 New York State Tenement House Act banned the
  • 5. The Results: Infectious disease rates BEFORE the wide use of antibiotics! 57.1% 45.8% AFTER the wide use of antibiotics! 11.3% 2.3% 9% 1880 1940 2011
  • 6. The epidemics of today are: CHRONIC DISEASES (obesity, diabetes, heart disease & strokes, cancers) Top 5 Causes of Death in U.S.: 1.Tobacco, 2. Obesity, 3. High Blood Pressure, 4. High Blood Sugar, 5. Physical Inactivity Energy in: Energy out: Food Exercise
  • 7. Obesity Trends* Among U.S. Adults BRFSS, 1985 (*BMI ≥30, or ~ 30 lbs overweight for 5’ 4” woman) No Data <10% 10%–14% Source: U.S. Centers for Disease Control and Prevention (CDC)
  • 8. Obesity Trends* Among U.S. Adults BRFSS, 1986 (*BMI ≥30, or ~ 30 lbs overweight for 5’ 4” woman) No Data <10% 10%–14% Source: U.S. Centers for Disease Control and Prevention (CDC)
  • 9. Obesity Trends* Among U.S. Adults BRFSS, 1987 (*BMI ≥30, or ~ 30 lbs overweight for 5’ 4” woman) No Data <10% 10%–14% Source: U.S. Centers for Disease Control and Prevention (CDC)
  • 10. Obesity Trends* Among U.S. Adults BRFSS, 1988 (*BMI ≥30, or ~ 30 lbs overweight for 5’ 4” woman) No Data <10% 10%–14% Source: U.S. Centers for Disease Control and Prevention (CDC)
  • 11. Obesity Trends* Among U.S. Adults BRFSS, 1989 (*BMI ≥30, or ~ 30 lbs overweight for 5’ 4” woman) No Data <10% 10%–14% Source: U.S. Centers for Disease Control and Prevention (CDC)
  • 12. Obesity Trends* Among U.S. Adults BRFSS, 1990 (*BMI ≥30, or ~ 30 lbs overweight for 5’ 4” woman) No Data <10% 10%–14% Source: U.S. Centers for Disease Control and Prevention (CDC)
  • 13. Obesity Trends* Among U.S. Adults BRFSS, 1991 (*BMI ≥30, or ~ 30 lbs overweight for 5’ 4” woman) No Data <10% 10%–14% 15%-19% Source: U.S. Centers for Disease Control and Prevention (CDC)
  • 14. Obesity Trends* Among U.S. Adults BRFSS, 1992 (*BMI ≥30, or ~ 30 lbs overweight for 5’ 4” woman) No Data <10% 10%–14% 15%-19% Source: U.S. Centers for Disease Control and Prevention (CDC)
  • 15. Obesity Trends* Among U.S. Adults BRFSS, 1993 (*BMI ≥30, or ~ 30 lbs overweight for 5’ 4” woman) No Data <10% 10%–14% 15%-19% Source: U.S. Centers for Disease Control and Prevention (CDC)
  • 16. Obesity Trends* Among U.S. Adults BRFSS, 1994 (*BMI ≥30, or ~ 30 lbs overweight for 5’ 4” woman) No Data <10% 10%–14% 15%-19% Source: U.S. Centers for Disease Control and Prevention (CDC)
  • 17. Obesity Trends* Among U.S. Adults BRFSS, 1995 (*BMI ≥30, or ~ 30 lbs overweight for 5’ 4” woman) No Data <10% 10%–14% 15%-19% Source: U.S. Centers for Disease Control and Prevention (CDC)
  • 18. Obesity Trends* Among U.S. Adults BRFSS, 1996 (*BMI ≥30, or ~ 30 lbs overweight for 5’ 4” woman) No Data <10% 10%–14% 15%-19% Source: U.S. Centers for Disease Control and Prevention (CDC)
  • 19. Obesity Trends* Among U.S. Adults BRFSS, 1997 (*BMI ≥30, or ~ 30 lbs overweight for 5’ 4” woman) No Data <10% 10%–14% 15%-19% 20% Source: U.S. Centers for Disease Control and Prevention (CDC)
  • 20. Obesity Trends* Among U.S. Adults BRFSS, 1998 (*BMI ≥30, or ~ 30 lbs overweight for 5’ 4” woman) No Data <10% 10%–14% 15%-19% 20% Source: U.S. Centers for Disease Control and Prevention (CDC)
  • 21. Obesity Trends* Among U.S. Adults BRFSS, 1999 (*BMI ≥30, or ~ 30 lbs overweight for 5’ 4” woman) No Data <10% 10%–14% 15%-19% 20% Source: U.S. Centers for Disease Control and Prevention (CDC)
  • 22. Obesity Trends* Among U.S. Adults BRFSS, 2000 (*BMI ≥30, or ~ 30 lbs overweight for 5’ 4” woman) No Data <10% 10%–14% 15%-19% 20% Source: U.S. Centers for Disease Control and Prevention (CDC)
  • 23. Obesity Trends* Among U.S. Adults BRFSS, 2001 (*BMI ≥30, or ~ 30 lbs overweight for 5’ 4” woman) No Data <10% 10%–14% 15%-19% 20%-24% 25% Source: U.S. Centers for Disease Control and Prevention (CDC)
  • 24. Obesity Trends* Among U.S. Adults BRFSS, 2002 (*BMI ≥30, or ~ 30 lbs overweight for 5’ 4” woman) No Data <10% 10%–14% 15%-19% 20%-24% 25% Source: U.S. Centers for Disease Control and Prevention (CDC)
  • 25. Obesity Trends* Among U.S. Adults BRFSS, 2003 (*BMI ≥30, or ~ 30 lbs overweight for 5’ 4” woman) No Data <10% 10%–14% 15%-19% 20%-24% 25% Source: U.S. Centers for Disease Control and Prevention (CDC)
  • 26. Obesity Trends* Among U.S. Adults BRFSS, 2004 (*BMI ≥30, or ~ 30 lbs overweight for 5’ 4” woman) No Data <10% 10%–14% 15%-19% 20%-24% 25% Source: U.S. Centers for Disease Control and Prevention (CDC)
  • 27. Obesity Trends* Among U.S. Adults BRFSS, 2005 (*BMI ≥30, or ~ 30 lbs overweight for 5’ 4” woman) No Data <10% 10%–14% 15%-19% 20%-24% 25%-29% 30% Source: U.S. Centers for Disease Control and Prevention (CDC)
  • 28. Obesity Trends* Among U.S. Adults BRFSS, 2006 (*BMI ≥30, or ~ 30 lbs overweight for 5’ 4” woman) No Data <10% 10%–14% 15%-19% 20%-24% 25%-29% 30% Source: U.S. Centers for Disease Control and Prevention (CDC)
  • 29. Obesity Trends* Among U.S. Adults BRFSS, 2007 (*BMI ≥30, or ~ 30 lbs overweight for 5’ 4” woman) No Data <10% 10%–14% 15%-19% 20%-24% 25%-29% 30% Source: U.S. Centers for Disease Control and Prevention (CDC)
  • 30. Obesity Trends* Among U.S. Adults BRFSS, 2008 (*BMI ≥30, or ~ 30 lbs overweight for 5’ 4” woman) No Data <10% 10%–14% 15%-19% 20%-24% 25%-29% 30% Source: U.S. Centers for Disease Control and Prevention (CDC)
  • 31. Obesity Trends* Among U.S. Adults BRFSS, 2009 (*BMI ≥30, or ~ 30 lbs overweight for 5’ 4” woman) No Data <10% 10%–14% 15%-19% 20%-24% 25%-29% 30% Source: U.S. Centers for Disease Control and Prevention (CDC)
  • 32. Diabetes trends among U.S. adults 1994 2000 2009 No Data <4.5% 4.5-5.9% 6.0-7.4% 7.5-8.9% >9.0% Source: CDC’s Division of Diabetes Translation. National Diabetes Surveillance System available at http://www.cdc.gov/diabetes/statistics
  • 33. Only half of NYC elementary school children are at a healthy weight Underweight 4% Obese 24% Normal Weight 53% Overweight 19% Source: NYC Department of Health and Mental Hygiene, NYC Vital Signs, 2003.
  • 34. World Obesity rates among adults - 2011
  • 35. Obesity and Diabetes have increased rapidly. Our genetics have not changed in one generation, but our built environment has!
  • 36. Growing EvidenceResearch Improving Health through Building, Street Evidence-based Base for shows that we can Increase Physical and Neighborhood Design Street and Neighborhood Design Activity through Building, OOD SCALES Designing to Point-of-Decision stair prompts increase stair Signs placed at elevators & escalators encouraging stair use, w/ info on use benefits of stair use Median 50% increase in stair use Design and aesthetic interventions Music & art in stairwells Design stairs to be more convenient and visible Skip-stop elevators 3300% increase in stair use Designing to increase active Enhancing access to places for physical activity, such as creating recreation walking trails or having onsite or nearby parks, playgrounds and exercise facilities (homes & worksites) increases leisure-time activity and weight loss Walking, Bicycling and Transit-oriented development Designing to Designs to improve street safety and aesthetics (less crime and traffic / increase active more greening), having sidewalks and bike paths connected to transportation destinations, mixed land use, high population density Median increase in physical activity 35% to 161%
  • 37. WE CAN ADDRESS THESE ISSUES AT THE BUILDING, Growing Evidence Base for Improving Health through Building, Street STREET AND NEIGHBORHOOD SCALES and Neighborhood Design Increased access to healthy foods and beverages within food Increasing environmentsaccess to healthy foods and beverages within food Increased Access to environments Healthy Food Increased access to premises that provide healthy foods and and Beverages Increased access to premises that provide healthy foods and beverages – e.g. supermarkets, farmers markets, drinking water beverages – e.g. supermarkets, farmers markets, drinking water facilities facilities Decreasing Decreased exposure to unhealthy foods such as trans fats and Exposure to sugary drinks Unhealthy Food and Decreased exposure to unhealthy food premises Beverages Point-of- Information at points of selection and purchase of food Decision Information
  • 38. Translating Health Evidence into Non-Health Policies Affecting Health KEY LESSONS LEARNED: • The Need for Partnerships – Core and Extensive • Finding Synergies and Co-Benefits • Complementary Roles of Core Partners – Health: Presenting the available research-based evidence and the epidemiology of disease; organized early meetings/conferences to do so – Design and Construction, Transportation and City Planning: Ideas of what’s feasible in the current local context; identifying opportunities and mechanisms, including and especially synergistic efforts – Health: Playing a supporting role for implementing ideas – presenting the health evidence; assisting with strategy and planning, undertaking studies to inform implementation planning and evaluation; providing resources for coordination of intersectoral meetings, initiatives and follow-up – Design and Construction, Transportation and City Planning: Leadership and participation in the efforts – Researchers: evidence reviews and synthesis, evaluation research • Garnering Review, Feedback and Inputs from an Extensive Group of Partners • Using Evidence-Based and Best-Practice Strategies • Using Annual Conferences as Strategic Milestones to Highlight Successes and Craft Strategic Next Steps with Extensive Group of Partners • Key Roles for Peer-to-Peer Partnerships and Mentoring among Cities
  • 39. Fit City Conferences Fit-City: Promoting Physical Activity Through Design Fit-City 3: Promoting Physical Activity Through Design
  • 40. The Active Design Guidelines Published in 2010, the Guidelines brought together a number of best practices for design professionals. Chapters 1) Environmental Design and Health: Past and Present 2) Urban Design: Creating an Active City 1) Building Design: Creating Opportunities for Daily Physical Activity 1) Synergies with Sustainable and Universal Design The Guidelines can be downloaded at: www.centerforactivedesign.org
  • 41. Creation of the Guidelines Active Design Guidelines Team New York City Staff* Department of City Planning Editor Alexandros Washburn, AIA Irene Chang, March, MPhil Department of Design and Chief Urban Designer Cheng+Snyder Construction David Burney, FAIA Skye Duncan, MSAUD, BArch Community, Academic and Commissioner Associate Urban Designer Private Sector Michael Bloomberg Mayor’s Office of Management and Ernest Hutton, Hutton Associates, Margo Woolley, AIA MAYOR Budget INC. Assistant Commissioner, Joyce Lee, AIA, LEED AP Ellen Martin, 1100 Architects Architecture and Engineering David Burney Chief Architect Linda Polack Marpillero Pollak, Division COMMISSIONER Architects Department of Design and Vitoria Milne, MID Academic Partners John Pucher, Bloustein School of Construction Director, Office of Creative Services Planning and Public Policy, Craig Zimring PhD. Rutgers University Department of Health and Mental Professor, Georgia Institute of Jessica Spiegel, 1100 Architects Thomas Farley Technology Hygiene William Stein, Dattner Architects COMMISSIONER College of Architecture Shin-Pei Tsay, Transportation Department of Health and Mental Karen Lee, MD, MHSc, FRCPC Alternatives Hygiene Director, Built Environment Gayle Nicoll, M.Arch, PhD, OAA Associate Professor and Chair, Thanks to all the design Janette Sadik-Khan Sarah Wolf, MPH, RD University of Texas at San Antonio Built Environment Coordinator practitioners and organizations COMMISSIONER Department of Architecture who participated in the 2009 Department of Transportation Department of Transportation Design Charrette to help test the Julie Brand Zook, M.Arch Wendy Feuer, MA Researcher, Georgia Institute of Guidelines prior to its publication. Amanda Burden Assistant Commissioner of Urban Technology COMMISSIONER Design and Art, Division of Planning College of Architecture Department of City Planning and Sustainability *We also thank the many city Reid Ewing, PhD agencies that gave input including Hanna Gustafsson Professor, University of Utah, the Depts of Parks and Former Urban Fellow, Division of Department of Recreation, Buildings, Housing Planning and Sustainability City and Metropolitan Planning Preservation and Development, School Construction Authority, American Institute of Architects Aging, and Mayor’s Offices of New York Chapter Long-Term Planning and Fredric Bell, FAIA Sustainability, and of People with Executive Director Disabilities. Sherida Paulsen, FAIA 2009 President
  • 42. IMPLEMENTATION: Inter-Sectoral City Policy Initiatives on Built Environment Synergies: • Health • Safety • Environmental Sustainability • Universal Accessibility • Economic Benefits www.nyc.gov/adg
  • 43. Co-benefits of Active Design: Improve the Environment Fuel / Electricity Use Air Quality Obesity/Diabetes/ Heart Disease Biking or walking rather √ √ √ than automotive transport Stairs rather than √ √ √ elevators and escalators Active recreation rather √ √ √ than television Safe tap water rather √ √ √ than bottled and canned beverages Fresh local produce √ √ √ rather than unhealthy processed foods
  • 44. Co-benefits: Create more accessible places • Creating safer places to walk, take transit, & for the elderly and people with disabilities. • Making elevators more available for those who need them.
  • 45. Co-benefits: Save money, particularly for low-income people People in walkable, transit-rich neighborhoods spend only 9 percent of their monthly income on transportation costs; those in auto-dependent neighborhoods spend 25 percent. Source: Center for Transit-Oriented Development
  • 46. Building Design Strategies Site + Building Design Stairs: promoting easy access Stairs: accessibility, visibility, convenience Stair of Prominence Skip Stop Elevators to Enclosed stairs that use and Visual Interest increase stair use Fire Rated Glass to Increase Visibility
  • 47. Building Design Strategies Stairs: aesthetics Stairs to receive plenty Art in stairs to increase Stairs designed to of natural daylight visual interest invite users
  • 48. Building Strategies Stairs: signage and prompts Motivational Signage placed at points of decision Promoting stair use at work – Stair Week
  • 49. City Policy + Implementation Use of LEED Green Building Credits that Promote PA Development density Public transportation and community access Bicycle storage and connectivity changing rooms LEED Physical Activity
  • 50. Building Design Strategies Recreational programming Provide fun and affordable recreational opportunities
  • 51. City Policy + Implementation NYC Green Codes Increasing drinking water access through better tap water facilities – passed in Plumbing Code
  • 52. City Policy + Implementation NYC Green Codes How do we incentivize good stair design and remove barriers to stair use through Zoning and Building Codes?
  • 54. NYC: Complete Neighborhoods JOBS LOCAL RETAIL OPEN SPACE
  • 55. City Policy + Implementation City Policy + Implementation Zoning for Bicycle Parking Zoning for Bicycle Parking: Increasing active transport by providing safe and secure parking for bike commuters
  • 56. Site + Building Design Bicycle parking + storage Secure Bike Storage with Easy Access
  • 57. City Policy + Implementation NYC World Class Streets Remaking NYC’s public realm: • Street Design Manual • Plaza Program • World Class Boulevards • Complete Streets Projects and Design Standards, incl. bike lanes • Public Art Program • New Streetscape Materials • Coordinated Street Furniture Program • Weekend Pedestrian and Cycling Streets
  • 58. Urban Design Pedestrian Environment / Streetscape Provide places of rest Enliven the sidewalk Attractive plazas have to complement with street cafes mix of trees, lighting, & active walking movable/ fixed seating and jogging Integrate public art into the streetscape
  • 59. Playstreets On request of DOT, Playstreets Coordinator hired by Health Evaluation by Health: Ages of children attending Playstreets (from surveys): Ages 1-13 Visited Playstreets at least once before: >80% Average length of time children stayed at the Playstreet (from surveys): ~1.5hours Most likely activity if children had not come to the Playstreet: TV or other inside activity: 52% Outdoor activity: 38% Indoor or outdoor activity equally likely: 10%
  • 61. Transit: Infrastructure Provide attractive and sheltered seating areas to encourage use of transit routes Bus Rapid Transit systems for more convenient and faster travel
  • 62. ty Policy + Implementation Streetscape Components Steinway Street Master Plan
  • 63. City Policy + Implementation City Policy + Implementation Creation of Additional Active Spaces: Summer Streets • DOT closes Park Avenue to traffic from Brooklyn Bridge to Central Park and the Upper East Side on Saturdays in August • Evaluation: – Average amount of physical activity from distances walked, ran, biked on route: >40 minutes of vigorous physical activity, or >70 minutes of moderate physical activity – 24% of people were those who didn’t meet PA Recs – 87% of participants got to event by active modes – High Needs Neighborhoods and Neighborhoods Outside Manhattan underrepresented
  • 64. City Policy + Implementation NYC FRESH Program FRESH Food Store Areas FRESH Food Store Program Areas where zoning and financial incentives AdditionalFoodeas owherPreoFRESH efinasancial incentives may be available FRESH ar St re gram Ar apply Additional areas where Additional areas where FRESH financial incentives may be available FRESH financial incentives may be available Zoning and tax incentives for providing fresh food options in the city’s underserved areas with high health needs
  • 65. Impacts • Won 5 National Awards (Health Policy, Environmental Protection, Sustainable Buildings, Architecture) • Distributed >15,000 copies of ADGs nationally & internationally • Trained >3,000 built environment professionals in NYC and U.S. • Mentored 14 other U.S. cities and communities (others now adopting initiatives such as integrating use of ADGs, “Burn Calories, Not Electricity” Stair Prompts, Playstreets, Fit City)
  • 66. Impacts To date, NYC has… •Increased: - Commuter cycling 262% - Bus and subway ridership 10% - Stair use - >40% increase at 9 mos in 10-story low-income housing - Places for children’s play - ~40 new Playstreets permitted • Decreased: - Traffic fatalities 30% - Traffic volumes 25% - Car registrations 5% • Started Reversing Childhood Obesity (also in San Diego!)
  • 67. Established in New York City in 2012, the Center for Active Design works to support prevention and control of obesity and chronic diseases by increasing opportunities for physical activity through the design of buildings, streets, and neighborhoods. The Center for Active Design is a non-profit organization that has grown out of an inter- disciplinary partnership among New York City agencies, the American Institute of Architects New York City Chapter (AIANY), private sector architects and developers, and academic partners. After collaboratively developing the Active Design Guidelines published in 2010, the Center for Active Design was established to foster widespread implementation of Active Design strategies among public and private sector design, planning, policy and real estate professionals. www.centerforactivedesign.org
  • 68. Anticipated Programs at the Center for Active Design  Award and Certification Program: recognizing and providing incentives for individual and project achievements in Active Design,  Training: for all design and real estate professions,  Technical Assistance: ranging from providing resources for implementing strategies for building managers to research and rollout consulting to other municipalities nationally and internationally,  Policy Development:: implementing zoning, code, and other incentives,  Evaluation and Research: linking to researchers, ongoing data collection and support,  Communications: using printed material, website and other material for education and training  Knowledge Translation and Resource Development: using available research for updating practice and policy materials, www.centerforactivedesign.org
  • 69. Fit-City: Promoting Physical Activity Through Design Fit-City 3: Promoting Physical Activity Thro Fit City conferences have helped promote Active Design
  • 70. Implementing the Guidelines Technical assistance and training Testing the guidelines through an interactive and interdisciplinary Design Charrette Participants: Government Agencies/ Developers/ Architects/Landscape Architects/Engineers
  • 71. Mentoring communities in public healthPartnership environment Built Environment & Health and the built Supported by CDC Communities Putting Prevention to Work Mentoring grant  Partnership between NYC DOHMH, AIANY, and 14 communities  All communities are recipients of CPPW grants Boston MA ~ Cherokee Nation OK ~ Chicago IL ~ Cook County IL ~ Douglas County NE ~ Jefferson County AL ~ King County WA ~ Louisville KY ~ Miami-Dade County FL ~ Multnomah County OR ~ Nashville TN ~ Philadelphia PA ~ Pima County AZ ~ San Diego CA
  • 72. Creation of Additional Resources: Active Design Supplements The Center is now creating 5 nationally applicable Active Design Appendix Documents 1. Active Design: Shaping the Sidewalk Experience 2. Active Design: Opportunities in Zoning 3. Active Design: Guidelines for a Suburban Context 4. Active Design: Injury Prevention 5. Active Design: Affordable Design in Affordable Housing

Editor's Notes

  1. Recent history of obesity in this country… In the 1980s the Centers for Disease control began collecting and tracking information about height and weight, and used this ratio to measure obesity in the population. Let’s see how obesity has changed since then. Keep your eye on how the colors change.
  2. We have never had an epidemic like this that we have been able to track so thoroughly and see. As I told you, this is conservative. About 60 million adults, or 30 percent of the adult population, are now obese, which represents a doubling of the rate since 1980.
  3. We have never had an epidemic like this that we have been able to track so thoroughly and see. As I told you, this is conservative. About 60 million adults, or 30 percent of the adult population, are now obese, which represents a doubling of the rate since 1980.
  4. We have never had an epidemic like this that we have been able to track so thoroughly and see. As I told you, this is conservative. About 60 million adults, or 30 percent of the adult population, are now obese, which represents a doubling of the rate since 1980.
  5. We have never had an epidemic like this that we have been able to track so thoroughly and see. As I told you, this is conservative. About 60 million adults, or 30 percent of the adult population, are now obese, which represents a doubling of the rate since 1980.
  6. Only Colorado has a rate below 20% This map is actually an under-representation of the problem! The CDC data is based on self-reporting. Studies show that men tend to over-report their height, women tend to under-report their weight Also it only shows obesity , does not include the % of people who are overweight.
  7. Obesity trends in children are even more alarming. Over 40% of NYC children are overweight and obese. The most troubling aspect – they will face critical health problems related to chronic disease at a much earlier age.
  8. People who live in walkable, transit rich neighborhoods spend less than half of what people in auto dependent neighborhoods spend on transportation. NOTE: I will clean up the text to make it more clear– need to do this on my Mac
  9. Access is the first order of business. Provide one set of stairs for every day use – not just fire egress. Once access is achieved, visibility is necessary to promote stair use. Examples show grand architectural gesture, or fire-rated glass to increase visibility. Consider stairs as an integral part of the vertical circulation system in a building. See elevator plan for new Cooper Union building. 2 of 3 elevators are skip-stop with interconnected stair system. 3 rd elevator stops on every floor for those who need it.
  10. Aesthetic treatments to make stairs more inviting and enjoyable to use.
  11. Studies show that prompts can increase stair use by a median of 50%. Place them at points of decision – elevator banks, stairwells. Source: 1) Soler et al. “Point of decision prompts to increase stair use: a systematic review update.” Am J Prev Med 2010; 38(2S):S292–S300. “ To examine effects relative to baseline stair use, eleven qualifying studies that included 21 study arms for stair use were evaluated in terms of relative (i.e., percentage) change.13–20,25–27 The majority of studies reported a low level of baseline stair use (20%). Overall, in the 11 qualifying studies, the median relative improvement in observed stair use was 50 percentage points (IQI5.4%, 90.6%) from baseline.”
  12. Consider indoor and outdoor recreational opportunities. Ground markings have been found to stimulate children’s active play. A relatively low-cost intervention that can make a big difference. Example on left is a NYCHA development. Tricycle track, climbing mound. On right are ground markings at a school in Queens. Also indoor opportunities – example of 10 West end allows for parallel exercise for children and adults.
  13. A very important part of keeping NYC young and dynamic is architecture. Promoting design excellence and creating high quality spaces is extremely important in terms of making NYC relevant on the international scene but also to support a high quality of life .
  14. Staying on the topic of bikes, secure indoor storage can go a long way to encourage cycling.
  15. How do we make streetscape as engaging as possible? Promote pedestrian safety and visual interest through lighting, public art, and street programming like outdoor cafes.
  16. Transit use promotes physical activity, since all trips begin and end with a walk. Provide conveniences at transit stops – benches, shelters, wide sidewalks that leave plenty of room for pedestrians, signage / maps about route. Providing separated bus lanes makes transit more reliable and convenient. Positions it as a more attractive option.
  17. The liasion to the Design Commission and Landmarks. Work closely with smaller bids in particular on streetscape projects.
  18. Data above reflects no exclusions
  19. Development of ADGs was evidence-based. Drawing from the strong tradition of health research, the Guidelines tap into new concept of evidence based design - that you can measure the impacts of changes to the physical environment. Guidelines are also practice-based – we held an interdisciplinary charrette to test the Guidelines in progress.