1. In mid-October, the price of oil was roughly $45 a
barrel and at this level it is very likely that U.S. supply
will continue to drop. Lower capital expenditures in
the short term will result in lower production in the
future. Wood Mackenzie, a global energy consultancy
group, estimates that about $1.5 trillion in new projects
are not viable at current prices and that $220 billion in
capex has been cut in 2015 and 2016 relative to pre-oil
In theory, valuing a commodity should be a relatively
easy task. Economics 101 taught us that the spot price
of a commodity is derived from the available supply
and demand for that good. However, theory doesn’t
always translate into reality as we’ve seen with the
recent sell-off in oil. Predicting global supply and
demand really isn’t so easy.
In this Market Chatter, we will make you feel like you
are back in school with a primer on the current supply/
demand inputs that will ultimately determine the price
of oil.
The Supply Side
For many decades, OPEC countries have been the
dominant oil producers, accounting for over forty
percent of global production (and over 60% of the
export market). Within OPEC, Saudi Arabia is, by far,
the largest producer, accounting for approximately
one third of OPEC’s production. Historically, when
prices dropped, OPEC (Saudi Arabia) cut production
in order to restore prices.
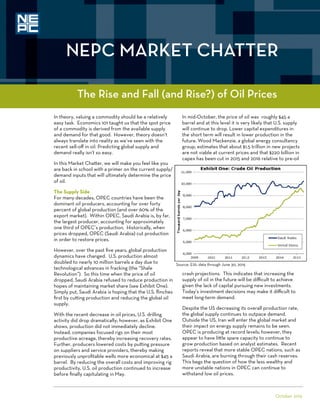
However, over the past five years, global production
dynamics have changed. U.S. production almost
doubled to nearly 10 million barrels a day due to
technological advances in fracking (the “Shale
Revolution”). So this time when the price of oil
dropped, Saudi Arabia refused to reduce production in
hopes of maintaining market share (see Exhibit One).
Simply put, Saudi Arabia is hoping that the U.S. flinches
first by cutting production and reducing the global oil
supply.
With the recent decrease in oil prices, U.S. drilling
activity did drop dramatically; however, as Exhibit One
shows, production did not immediately decline.
Instead, companies focused rigs on their most
productive acreage, thereby increasing recovery rates.
Further, producers lowered costs by putting pressure
on suppliers and service providers, thereby making
previously unprofitable wells more economical at $45 a
barrel. By reducing the overall costs and improving rig
productivity, U.S. oil production continued to increase
before finally capitulating in May.
October 2015
The Rise and Fall (and Rise?) of Oil Prices
NEPC MARKET CHATTER
crash projections. This indicates that increasing the
supply of oil in the future will be difficult to achieve
given the lack of capital pursuing new investments.
Today’s investment decisions may make it difficult to
meet long-term demand.
Despite the US decreasing its overall production rate,
the global supply continues to outpace demand.
Outside the US, Iran will enter the global market and
their impact on energy supply remains to be seen.
OPEC is producing at record levels; however, they
appear to have little spare capacity to continue to
grow production based on analyst estimates. Recent
reports reveal that more stable OPEC nations, such as
Saudi Arabia, are burning through their cash reserves.
This begs the question of how the less wealthy and
more unstable nations in OPEC can continue to
withstand low oil prices.
Source: EIA; data through June 30, 2015
2. YOU DEMAND MORE. So do we. SM
255 STATE STREET, BOSTON, MA 02109 | TEL: 617.374.1300 | FAX: 617.374.1313 | www.nepc.com
BOSTON | ATLANTA | CHARLOTTE | CHICAGO | DETROIT | LAS VEGAS | SAN FRANCISCO
balance sheets tighten from hedges rolling off,
resulting in increased balance sheet exposure to lower
oil prices. This would extend the painful market
correction. But, excess supply would decrease to
meet the global demand as markets ultimately correct
themselves.
We believe that markets will ultimately correct
themselves leading to a price recovery by 2017. There
may continue to be volatility in energy stocks, bonds
and in illiquid investments as the supply and demand
sides battle it out. The search for an equilibrium supply
and demand will lead to opportunities for long-term
investors. We will need to take an advanced
Economics course to tell you where the price of oil will
be in the future!
The Demand Side
Despite what many think, oil demand is still growing
(Exhibit Two). In fact, U.S. demand is growing at the
fastest pace in five years. Market sentiment, however,
has become sharply negative due to concerns around
China and the general health of the global economy.
The International Energy Agency (IEA) is still
forecasting for an overall increase in the world demand
for oil, albeit at a slower pace.
Another potential factor impacting the demand for oil
will be US monetary policy. Historically, there has
been a negative correlation between the strength of
the US Dollar and the price of oil. While there are
many reasons for this relationship to exist, the simplest
reason is that when the US Dollar rises, foreign entities
have less purchasing power therefore decreasing
demand for oil. As the US Federal Reserve
contemplates raising rates, the knock-on effect could
be a strengthening US Dollar ultimately decreasing
foreign purchasing power and the price of oil.
What Does the Future Hold for Oil Prices?
Analysis of both supply and demand does not provide
any indication that oil is headed to $100 a barrel any
time soon. However, our interpretation of the tea
leaves indicates that barring a dramatic decline in
global demand, the oversupply of crude oil is not
sustainable. If the price of oil remains lower through
the year, energy producers will be under stress as
Disclaimers and Disclosures
All investments carry some level of risk. Diversification and other asset allocation techniques do not ensure profit or protect against losses.
The opinions presented herein represent the good faith views of NEPC as of the date of this paper and are subject to change at any time.
All investment programs have unique characteristics and each investor should consider their own situation to determine if the strategies
discussed in this paper are suitable.
This report contains summary information regarding the investment management approaches described herein but is not a complete
description of the investment objectives, portfolio management and research that supports these approaches.
Source: Bloomberg, IEA; data through June 30, 2015