Financialisation of oil markets
•
0 likes•202 views

The document summarizes a study examining the time-varying factors influencing oil prices from 1995 to 2008. A state space regression model is used to model crude oil prices based on explanatory variables like inventory levels, speculative investment, refinery utilization, and futures market structure. The beta coefficients relating these variables to price are modeled as random walk processes. Results show oil prices have become more sensitive to speculative investment relative to fundamentals over time. A VECM analysis also finds speculative inflows have been less driven by fundamentals since 2004, indicating increasing financialization of oil markets.
![2
10
20
30
40
50
60
70
80
90
100
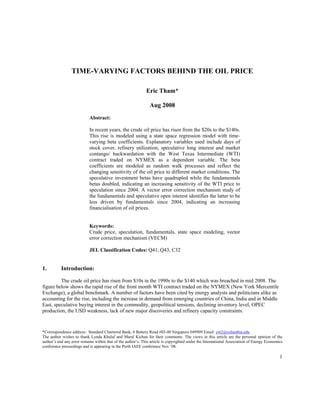
95 96 97 98 99 00 01 02 03 04 05 06 07
WTI front month NYMEX
Figure 1: Time series of WTI front month contract (1995 Jan to 2008 Feb)
The price increase has been especially rapid after 2004. Examining the demand and supply figures from
IEA reveals that in Jan 2004, the non OECD countries demand growth averaged about 1.2 mb/day year on year.
OECD demand growth on the other hand was estimated at 410kb/day for a total daily global consumption of
79.6mb/day. This demand growth has since abated in 2007 due to deteriorating economic conditions in the OECD
countries but daily consumption has still increased to 87.6 mb of crude in 1Q 2008 globally. Much growth is
attributed to China (400kb/day) and the Middle East region (380kb/day). The high economic growth and imposition
of government subsidies on petroleum products in these countries were cited as reasons for the demand growth.
This demand growth has only been partly matched by growth in crude supply. During these years, supply is
estimated to have grown from 82.1mb/day in Jan 2004 to 87.2 mb/day in Feb 2008 from both OPEC and non-OPEC
sources. The larger demand growth has led to a smaller buffer on spare crude production which almost all rests with
the main producer Saudi Arabia. This spare crude capacity is presently estimated at about 2mm barrels presently.
The imbalance in demand and supply growth is made up by inventory growth or decline.
1.1 Literature Review
Earlier papers to explain the oil price has focused on using inventory to explain the oil price for example,
Pyndick [2004]. In this paper, a structural model relates the futures and spot price to inventories through price
volatility. Volatility which is viewed as an exogenous variable increases prices through the marginal value of storage.
This in turn may result in higher inventory. On the other hand, volatility also raises the marginal cost of production
via an ‘option premium’, which may lead to lower production and backwardation in the market.
The inventory model has also been used by Dess et al[2008] albeit as a days of stock cover. The latter paper
examines the refinery utilization rates, OPEC capacity utilization and contango/ backwardation of the futures market.
These factors are found to contribute to the oil price rise between 2004 and 2006. Refinery utilization especially
could have been significant during the hurricane season in 2005, when several refineries were knocked off-line,
leading to a product-led rise in crude prices.
However, since about 2002, inventory and other fundamentals alone have not been adequate to explain
crude prices. In particular the increased trading of commodities has made the market more influenced by the
workings of financial markets. In Antonio [2005], the price premium over the inventory model was explained by the](data:image/gif;base64,R0lGODlhAQABAIAAAAAAAP///yH5BAEAAAAALAAAAAABAAEAAAIBRAA7)
Recommended
Recommended
More Related Content
What's hot
What's hot (20)
Viewers also liked
Viewers also liked (14)
Similar to Financialisation of oil markets
Similar to Financialisation of oil markets (20)
Recently uploaded
Recently uploaded (20)
Financialisation of oil markets
- 1. *Correspondence address: Standard Chartered Bank, 6 Battery Road #03-00 Singapore 049909 Email: yet2@columbia.edu The author wishes to thank Lynda Khalaf and Maral Kichan for their comments. The views in this article are the personal opinion of the author’s and any error remains within that of the author’s. This article is copyrighted under the International Association of Energy Economics conference proceedings and is appearing in the Perth IAEE conference Nov ’08. 1 TIME-VARYING FACTORS BEHIND THE OIL PRICE Eric Tham* Aug 2008 Abstract: In recent years, the crude oil price has risen from the $20s to the $140s. This rise is modeled using a state space regression model with time- varying beta coefficients. Explanatory variables used include days of stock cover, refinery utilization, speculative long interest and market contango/ backwardation with the West Texas Intermediate (WTI) contract traded on NYMEX as a dependent variable. The beta coefficients are modeled as random walk processes and reflect the changing sensitivity of the oil price to different market conditions. The speculative investment betas have quadrupled while the fundamentals betas doubled, indicating an increasing sensitivity of the WTI price to speculation since 2004. A vector error correction mechanism study of the fundamentals and speculative open interest identifies the latter to be less driven by fundamentals since 2004, indicating an increasing financialisation of oil prices. Keywords: Crude price, speculation, fundamentals, state space modeling, vector error correction mechanism (VECM) JEL Classification Codes: Q41, Q43, C32 1. Introduction: The crude oil price has risen from $10s in the 1990s to the $140 which was breached in mid 2008. The figure below shows the rapid rise of the front month WTI contract traded on the NYMEX (New York Mercentile Exchange), a global benchmark. A number of factors have been cited by energy analysts and politicians alike as accounting for the rise, including the increase in demand from emerging countries of China, India and in Middle East, speculative buying interest in the commodity, geopolitical tensions, declining inventory level, OPEC production, the USD weakness, lack of new major discoveries and refinery capacity constraints.
- 2. 2 10 20 30 40 50 60 70 80 90 100 95 96 97 98 99 00 01 02 03 04 05 06 07 WTI front month NYMEX Figure 1: Time series of WTI front month contract (1995 Jan to 2008 Feb) The price increase has been especially rapid after 2004. Examining the demand and supply figures from IEA reveals that in Jan 2004, the non OECD countries demand growth averaged about 1.2 mb/day year on year. OECD demand growth on the other hand was estimated at 410kb/day for a total daily global consumption of 79.6mb/day. This demand growth has since abated in 2007 due to deteriorating economic conditions in the OECD countries but daily consumption has still increased to 87.6 mb of crude in 1Q 2008 globally. Much growth is attributed to China (400kb/day) and the Middle East region (380kb/day). The high economic growth and imposition of government subsidies on petroleum products in these countries were cited as reasons for the demand growth. This demand growth has only been partly matched by growth in crude supply. During these years, supply is estimated to have grown from 82.1mb/day in Jan 2004 to 87.2 mb/day in Feb 2008 from both OPEC and non-OPEC sources. The larger demand growth has led to a smaller buffer on spare crude production which almost all rests with the main producer Saudi Arabia. This spare crude capacity is presently estimated at about 2mm barrels presently. The imbalance in demand and supply growth is made up by inventory growth or decline. 1.1 Literature Review Earlier papers to explain the oil price has focused on using inventory to explain the oil price for example, Pyndick [2004]. In this paper, a structural model relates the futures and spot price to inventories through price volatility. Volatility which is viewed as an exogenous variable increases prices through the marginal value of storage. This in turn may result in higher inventory. On the other hand, volatility also raises the marginal cost of production via an ‘option premium’, which may lead to lower production and backwardation in the market. The inventory model has also been used by Dess et al[2008] albeit as a days of stock cover. The latter paper examines the refinery utilization rates, OPEC capacity utilization and contango/ backwardation of the futures market. These factors are found to contribute to the oil price rise between 2004 and 2006. Refinery utilization especially could have been significant during the hurricane season in 2005, when several refineries were knocked off-line, leading to a product-led rise in crude prices. However, since about 2002, inventory and other fundamentals alone have not been adequate to explain crude prices. In particular the increased trading of commodities has made the market more influenced by the workings of financial markets. In Antonio [2005], the price premium over the inventory model was explained by the
- 3. 3 speculation in the oil markets as measured by non-commercial long positions. Other factors including the US gasoline situation, futures backwardation/ contango and OPEC spare capacity were considered. However, only the futures backwardation/ contango condition was able to partially explain the premium over the inventory model. Even then, speculation was found to be the only exogenous factor amongst these factors. 1.2 Financialisation of Oil Markets The weakness of the USD which has seen its value decreased relative to other currencies has also been cited for the price increase. The interplay effect of USD in general with commodity prices can be observed in the macro-economy through inflation hedges and the US economic growth in Figure 2. In particular, though FX rates are linked by arbitrage to the level of interest rates, their effects on commodity prices especially the crude price are ambiguous. When rates increase, this causes the US economy to slow while directly causing the USD to appreciate. The slowdown of the US economy causes the USD to depreciate later although this effect may not be straightforward with other macro-economy variables at play. The economy slowdown reduces commodities demand and prices, while the depreciation of the USD increases commodity prices. An important factor is the growing role of funds which invests in commodities as a hedge against inflation, causing commodity prices to rise directly. Figure 2: Effects of USD strength on Crude Prices The role of speculation in driving up crude prices has also gained public attention lately. A recent Wall Street Journal article reports the proposed passing of legislation to curb speculation. This has met in some quarter resistance as it may lead to reduced liquidity in the markets and drives players to other more opaque markets like the InterContinental Exchange (ICE). Politicians in some emerging economies have also called for stricter legislation to curb speculation in the energy markets. However, there is no agreement to what caused the phenomenal rise in crude price. In an investment bank study, commodities traded on both exchanges and non-exchanges have been compared. Both types of these commodities trading have experienced similar price growth, even though speculation tends to be less outside of the exchanges. The increase in price of both types of commodities is thus attributed to a common fundamental supply/ demand factor. This paper extends the study by examining both fundamentals and speculative pressure simultaneously for their impact on the crude price. In particular, a state space model (Kalman filter) for time varying parameters is used. This technique has been similarly applied in Pyndick[1999] to study the long run evolution of energy prices over more than a century. In this paper, energy prices are found to depend on a slope line and revert to a mean, which are
- 4. 4 both stochastically varying. Similarly, the increasing volatility of market conditions since 2004 necessitates the use of this technique. The time varying parameter results show that the oil price has become more sensitive to speculative buying pressure than that of fundamentals pressure over the past few years. This has come about even as the supply/ demand fundamentals tighten in the market. The lack of refining capacity built in the developed countries has also been mentioned as contributing to the rise in the oil price. This effect is found to be more muted compared to speculation and fundamentals though. This sensitivity of the oil price to refinery intake tends also to be cyclical as observed from the time series of the beta coefficients. This is possibly reflective of seasonal refinery maintenance rates and disruptions in refinery operations. The oil price sensitivity to another factor - backwardation of the oil futures curve has however been relatively constant and less than that of other factors. This indicates a diminishing importance of the ‘roll over’ technique traditionally employed by several index funds. Further a VECM causality study between fundamentals and speculative inflows shows that the fundamentals impact on speculative buying in the short term has declined since 2004. This implies that speculative funds inflow to the market have been driven by other exogenous factors. The impact of speculative buying on the stock build is also only marginally significant. This could be due to other supply/ demand factors that affect the inventory build up such as OPEC quota and geopolitical tension. The organization of the paper is as follows. The next section describes the data being used for the analysis, and their fundamental effects on the oil price. The third section describes the state space model for the study which results are discussed in the following section. The causality relationships between the fundamentals and speculative proxy driving factors are then studied in a vector error correction model and discussed. A last section concludes. More technical aspects of the paper are placed in the appendix. 2. Fundamentals: In this section the data used for the analysis – oil price and its explanatory variables are described for their fundamental importance. The oil price studied is the front month NYMEX (New York Mercentile Exchange) West Texas Intermediate (WTI) contract. Whilst there are several grades of crude oil in the market presently, the WTI crude is the most widely followed and liquid global benchmark. The contract is physically settled at Cushing, United States which by far is the largest domestic market. The WTI often leads other crude benchmarks in the world, eg Brent on the ICE and Dubai traded in the Asian markets. Though on some occasions, due to local logistical conditions (for example North Sea outages, pipeline disruptions in USA), this relationship is broken. However, regional crude arbitrage and flows tend to set the equilibrium back in place. Oil fundamentals are proxied by the days of cover of crude stocks. This is obtained by dividing the level of crude inventory over the daily products consumption. An advantage of using days of stock cover is it implicitly considers the demand growth of the products. Data for the crude inventory and consumption are released weekly by the Energy Information Administration (EIA) of the US Department of Energy (DOE) every Thursday 1030 EST to reflect inventory conditions on the last Friday. This report is closely followed by the market and is comprehensive including the level of crude and products stocks and production, and refinery utilizations in the major PADD districts in USA. There is also an emergency crude inventory, the Strategic petroleum reserve (SPR). The SPR has however been sold recently in times of distress like the Hurricane Katrina and Rita, when crude production in the Gulf of Mexico was disrupted. On average, only 0.6% of the daily 11 million of crude that is imported to the US are stored in the SPR. In May 2008, the US Congress passed a legislation to suspend SPR imports till end 2008 in a bid to lower prices. The relative small magnitude of the SPR imports means it is not likely to impact prices much and excluded from the data analysis.
- 5. 5 Investor speculation in crude buying has been cited as an important reason in driving up prices. This investor interest is proxied by long non commercial open interest in futures and options reported by the Commodities Futures Trading Commission (CFTC). The CFTC reports on every Friday the existing commodity positions on the last Tuesday in the major US exchanges. These positions are broken up mainly into non commercials and commercials. The commercials refer to the oil exploratory and refining companies or the like which enter the market mainly for hedging purposes. On the other hand, the non commercials refer to the index, pension and hedge funds, and investment banks, which use the WTI contract more as an investment vehicle. Refinery utilization is another factor that has been cited to affect crude prices. In all, the refining capacity in USA is about 17.6mmbbls. There have been no new refineries built, although the expansion of existing refineries has added 1.0 mm bbls refining capacity since 2000. These refineries are complex refineries and able to handle heavy sour crude to maximize yields in the more valuable middle and light distillates. However, the upgrading units in these refineries are frequently utilized to the maximum. This means it is not able to process further crude of the heavy and sour type efficiently, which unfortunately is the only spare crude available in the market. This constraint in the refining capacity may mean more crude availability will not help to bring more products to the market and lower prices. This factor is studied further by using the refining utilization that is reported by the DOE weekly as an explanatory variable. It is also interesting to examine if refinery seasonal maintenance and disruptions have any impact on crude prices. A popular investment strategy that is used by index funds is the ‘roll over’ technique. This strategy hinges on the commodities curve being backwardated most of the time. This backwardation phenomenon was studied extensively in Litzengerger [1995] and was attributed to producers paying a premium in order to be able to sell at a fixed price in the future. The strategy goes like this. Suppose in Jun ’08, the Jul ’08 and Aug ’08 future prices are 100 and 99 respectively. The investor then buys the Aug ’08 future. A month later in Jul ’08, the futures curve retains its structure with the Aug ’08 and Sep ’08 prices at 100 and 99. The index investor closes the Aug ’08 future by selling it back @100 and buys back the Sep ’08 future. The profit for the strategy is thence $1/bbl. This process recurs over again. See figure 3 below. Figure 3: Roll over technique of index investors Index investors thence bear commodity risks offsetting the risks bornt by producers alike. The importance of index investing is thence determined by the level of the contango/ backwardation of the WTI futures curve which determines the returns of the strategy. This contanog/ backwardation is used as an explanatory variable in the model.
- 6. 6 3. Econometric Model: The econometric technique used is the state space model. A brief review of the model is given here, especially pertaining to its relevance to the study. A more detailed explanation of the model can be found in most advanced econometrics texts, for example Hamilton [2004]. More technical aspects of the model are placed in the appendix. In this model, there are two main classes of equations: the observation equation and the transition equations. The observation equation relates the crude price to the changes in the driving factors, with the effects (or the betas) modeled dynamically by the transition equations. These equations are below: 3.1 Measurement Equation: ∑= += n i ttitit xp 1 ,, υβ (1) where the symbols denote: • tp : Weekly average price of WTI • tix , : Driving factors defined by: 1=i - the days of stock cover 2=i - the weekly level of non commercial interests in the WTI contract 3=i - the contango level of the WTI given by the difference of the front month contract and the sixth month contract 4=i - the refinery utilization rate • ti,β : coefficients modeled as dynamic state variables. • ),0(~ 2 υσυ N 3.2 Transition Equation: The transition equations model the coefficients or state variables as dynamic processes. These are either random walk or AR(1) process. In a random walk process, the coefficients are non stationary and modeled as: tititi ,1,, εββ += − (2) While for a AR(1) process, 11 <<− iβ : titiiti ,1,, εβαβ += − (3) In the transition equations, the errors are modeled as independent white noise variables, where the errors are time dependent. • ),0(~ 2 , εσε Nti It is found that in this study that the random walk process fits the data better. This is due to the coefficients being yet non stationary as the oil market searches for an equilibrium.
- 7. 7 3.3 Data Used The data used is weekly data for the period from May 1995 to February 2008 for a total of 660 data points. The source of data is tabulated below in Table 1, and a time series of the data is seen in Figure 4. The data is log transformed to achieve similar order of magnitude and used as regression variables in the Kalman filter. DATA SOURCE AND REMARKS WTI closing prices NYMEX futures daily closing prices. The contango/ backwardation is calculated as the difference between the front month and 6th month to expiry future price. (m1-m6) Non commercials long open interest CFTC reported weekly. Both the futures and option positions from non commercials are included in this study. Number of days of stock cover Energy Information Administration (EIA) data reported weekly. This is defined by dividing the stocks excluding the strategic petroleum reserves (SPR) divided by the daily petroleum products supplied. Refinery utilization Weekly EIA data. Defined as crude oil input into refineries in ‘000 bbl/ day Table 1: Description of Regression data -8 -6 -4 -2 0 2 4 6 8 95 96 97 98 99 00 01 02 03 04 05 06 07 WTI contango/ backwardation 11000 12000 13000 14000 15000 16000 17000 95 96 97 98 99 00 01 02 03 04 05 06 07 Refinery utilisation 12 13 14 15 16 17 18 19 20 21 95 96 97 98 99 00 01 02 03 04 05 06 07 Days fo stock cover 0 40000 80000 120000 160000 200000 240000 280000 320000 95 96 97 98 99 00 01 02 03 04 05 06 07 Non commercial long interest Figure 4: Time series of regression data
- 8. 8 4. Discussion on model findings 4,1 Model Results Regression results for the state space model are shown in the table below. This state space model considers the state space variables to be random walk processes, which has the best statistical fit by the Schwartz criterion and the Akaike Information criterion (AIC). Other models considered use AR(1) processes and cross terms in the transition equations, but were found to have lower criteria. The fit of the WTI prices to model prices is generally very good in a state space model, as the Kalman filter continually updates the coefficients to optimize the model fit. This can be seen in the x-y plot in figure 5a below. The average standard error for the measurement equation from 1995 Apr to 2008 Feb is 1.3, but from 2004 Jan till 2008 Feb is greater @1.6. Beta state variables Final Value (z-stat in brackets) Refinery utilization 3.33 (4.32) Non commercial long interest 2.10 (2.39) Days of stock cover 4.15 (8.44) WTI backwardation/ contango 1.69 (24.9) Table 2: Regression results (terminal values of beta coefficients @ Feb 08) 0 20 40 60 80 100 10 20 30 40 50 60 70 80 90 100 WTI model price WTIF State Space Model Fit -25 -20 -15 -10 -5 0 5 10 95 96 97 98 99 00 01 02 03 04 05 06 07 WTI_ERROR Std Error = 1.3 Figure 5a: X-Y Plot of actual and model prices, 5b: Plot of WTI model error
- 9. 9 Further, the time series of the beta coefficients for each driving factor are shown in each of the figures below. These beta coefficients are filtered estimates. This means they are posterior estimates as in Equation (6) in the appendix, and considers the values of each driving factors at that time period. Posterior estimates are used in order to have greater explanatory power in each time step. -1 0 1 2 3 4 5 97 98 99 00 01 02 03 04 05 06 07 Refinery utilisation Days of cover beta Non commercials interest Backwardation/ Contango TIME VARYING BETAS Figure 6: Time series of time varying betas 4.2 Discussion An examination of figure 4 reveals that the days of stock cover has decreased from 19 days to 15 days over the past decade. This has a direct impact on rising prices. Indeed, the sensitivity of the WTI price to this tightening of fundamentals has doubled from 1.0 since 2003, as can be observed from its beta above. This alone however has not been able to explain the huge increase in the WTI prices since then. Examining the non commercial long open interest in the WTI contract reveals an increase of ~80k in 2001 contracts to 280k in 2008. This is equivalent to 280 mm bbls of oil for all the 60 monthly contracts. On a per day basis, this is much less than 1mm bbl of oil, which is a conservative estimate and assumes all open interest in the front month contract. Compared to the about ~20 mm bbls of oil that the US consumes daily, this amount is not great. Indeed up to 2003/2004, the WTI price was not sensitive to the non commercial long open interest with a near zero beta. Since then, the beta has increased to ~4 reflecting the increasing financialisation and sensitivity of the oil price to funds inflows. The WTI contango/ backwardation on the WTI futures prices have seen a relatively stable beta since 1995. Recent estimates indicate that index funds investing constitute ~15% of the non commercial interests. Historically, the WTI futures curve is backwardated most of the time. Indeed this was the case up to 2004 as observed in figure 4 with positive m1-m6 values. From 2004 to 2007, it was mostly in contango until it flipped back to backwardation at the end of the data period. Data for index funds investment into the oil markets was collected only since 2006, and it was difficult to identify how significant the index funds have played in the oil price rise. However, the relatively stable beta indicates that the WTI price has not changed much in sensitivity to these index funds investments. This premises that these funds generally use the roll-over technique as explained in an earlier section.
- 10. 10 The beta of the refinery utilization has also approximately doubled to 2.0 since 2004. As explained in the fundamentals section, this could be due to the world spare oil capacity being mainly heavy and sour. Since upgrade units are usually run at maximum rates, a smaller proportion of middle and light distillates is produced even though these have higher demand growth. These can lead to a product led increase in oil prices. Notice this is apparent in a spike during the hurricane 3Q 2005 as seen in the zoomed in figure below. 2.40 2.45 2.50 2.55 2.60 2.65 2.70 2.75 05M01 05M04 05M07 05M10 06M01 06M04 Refinery betas Figure 7: Betas of refinery utilization (during 2005 hurricane season) 5. Casuality study among driving factors: In this section, the lead lag relationships between the speculative and fundamental factors are studied in a VECM model to examine for any causality. An advantage of the VECM model is it enables segmentation of the factors into long run and short run impacts. The use of a VECM model warrants a co-integrating relationship between the driving factors, which is tested by the Johansen test. In non technical terms, a co-integrating relationship among variables means they can be weighted in a regression to form stationary residuals. This precludes the existence of any spurious regression that may result. Results of the Johansen test among the days of stock cover, WTI price and the non commercial open interest points to the existence of one co-integrating relationship at the 5% critical level. This is used in formulating the VECM equation below. Denoting the xi for non commercial open interest and days of stock cover, and pt as the crude price, the set of VECM equations are below. Equation (8) refers to a single model equation for xi for i =1,2 and 3 defined below. The long run component forms the co-integrating relationships among these variables and is common in all i’s. ti ShortRun i l j jtiji LongRun i tiititi xxpx , 3 1 2 1 ,, 2 1 ,, )( εθαϕ 44 844 7644 844 76 ∑∑∑ = = = − = +∆+−=∆ (8) • tp : Weekly average price of WTI • tix , : Driving factors defined by:
- 11. 11 1=i - the days of stock cover as reported y EIA 2=i - the weekly level of non commercial open interest in the WTI contract 3=i - the weekly average price of WTI The short run component of the factors ∆xi for days of cover and non commercial open interest is studied for mutual short term causality relationships. For example, the short run impact of xi=2 on xi=1 is examined by observing the short run coefficients θi=2,j for ∆xi=1 as in Equation (9) below. This differs from the usual Granger causality test in which lagged level variables are regressed in an ordinary least squares regression and does not filter out the long run effects both variables have on the WTI price. Results of the short run relationships are tabulated below in Table 3 for i=1,2 and 3 with t-stats in brackets. Two periods of regression are shown with the first period from Sep 1995 to Jan 2004, and the second from Jan 2004 to Feb 2008. The period was chosen because the oil price had undergone a phenomenal rise from early 2004 indicating a structural change. } ti l j jtiji LongRun ti xx ,1 1 ,2,2,1 .... = = −=== +∆+=∆ ∑ εθ (9) Period May 1995 – Jan 2004 Jan 2004 – Feb 2008 Coefficients ∆x1,t ∆x2,t Coefficients ∆x1,t ∆x2,t Co-integrating equation -0.004 [-0.32] 0.28 [ 4.26] Co-integrating equation -0.047 [-2.26] 0.098 [1.54] ∆x1,t-1 -0.466 [-10.0] -0.514 [-1.93] ∆x1,t-1 -0.192 [-2.74] -0.21 -0.97 ∆x1,t-2 -0.257 [-5.58] -0.387 [-1.47] ∆x1,t-2 0.011 [0.15] -0.22 [-1.02] ∆x2,t-1 0.009 [ 1.03] 0.15 [ 3.17] ∆x2,t-1 0.038 [1.68] 0.21 [-3.06] ∆x2,t-2 0.012 [ 1.41] -0.026 [-0.55] ∆x2,t-2 0.016 [0.59] 0.11 [1.38] R square 0.20 0.10 R square 0.10 0.073 F stat 18.7 8.26 F stat 3.80 2.73 Table 3: VECM results on short run factors returns Most of the coefficients are not significant at the 95% level. For the period Jan 2004 to Feb 2008, days of stock cover (x1) impact on the long non commercial open interest (x2) is not statistically significant with coefficient values @0.21 and -0.22 with t-stats of approximately 1.0. This implies there could be other exogenous factors that drives the speculative investment, for example USD strength, geopolitical tension and OPEC quota. The same conclusion can be derived for speculative investment on days of stock cover with coefficients @0.038 and 0.016. For the earlier period Sep 1995 to Jan 2004 though, the coefficients are marginally higher and more significant. The coefficient impacts of days of stock cover on the long non commercial open interests are now -0.51 and -0.39 with t- stats of 2.0. This comparison indicates that the non commercial long interests are more driven by demand/ supply in this prior period than in the years from 2004. It can be that the inclusion of more market investors in crude trading has caused the non commercial interest to be less dependent of oil fundamentals compared to the prior period.
- 12. 12 6. Conclusion The state space model results show that funds inflow, fundamentals and refinery utilization have all explanatory power over the oil price. However, the increasing financialisation of oil markets has brought about increasing importance of speculative funds that affects the oil price. This is apparent by their beta values which have increased some 4 times since 2004 even as the betas for the fundamentals have doubled in value. Refinery utilization has also grown more important as the demand growth for light and middle products is higher than for the heavy products, even as the world spare crude capacity is in heavy and sour crude. On the contrary, index funds impact on WTI price has remained relatively muted. This financialisation of the oil markets has also meant that the speculative funds flows are now less driven by fundamentals, as compared to the prior period before 2004. There could be other factors that drive funds inflows. As described in the introductory section, funds inflow could have increased with USD weaknesses and to hedge against inflation. Another factor that could drive funds inflow and speculation is geopolitical risks. Over the period of study, numerous geopolitical risks have surfaced including the Iranian nuclear standoff and attacks on the Nigerian delta, the Israeli-Palestinian war and isolated incidents like the failed attack on Saudi oil facilities and the London train bombing. Some of the incidents like terror attacks and attacks in the Nigerian delta are one-off incidents which affected the front contracts temporally. The Iran standoff effect has been protracted which possibly caused the market to be in contango in 2005/2006. A fitting endnote is since the test was done with data up till Feb 2008, the oil price has increased by almost 50% to $145 in July ’08. The WTI price experienced intra-day swings of up to $5-$10 on certain days, even though there is no apparent change in fundamentals. This further validates the increasing importance of funds inflows in determining oil prices. 7. References i. Robert Pindyck, 2004. Volatility and commodity price dynamics.. Journal of futures markets, vol 24, No 11, pp 1029-1047 (2004) ii. Antonio Merino and Alvarao Ortiz, 2005. Explaining the so-called “price premium” in oil markets. OPEC Energy Review. June 2005. iii. Robert Pindyck, 1999. The long run evolution of energy prices. Energy Journal 1999, 20 1-27 iv. Stephane Dees, Audrey Gasteuil, Robert Kaufman and Michael Mann, 2008. Assessing the factors behind oil price changes. European Central Bank Working paper series No 855. January 2008 v. Robert H. Litzenberger and Nir Rabinowitz, 1995. Backwardation in oil futures markets: theory and empirical evidence. The Journal of Finance, vol 50, No 5. (Dec 1995) pp 1517-1545. vi. James Hamilton, 1994. Time series analysis. Princeton University Press. 1994 vii. Goldman Sachs commodities report Jun 2008. Speculators, index investors and commodity prices. David Greely and Jeffrey Currie.
- 13. 13 Appendix: I. Estimation of State Space Model Parameters It is necessary in the model to estimate the beta and its parameters. The model parameters are estimated by recursive Bayesian optimization. Recursive estimates of the state variables (betas) and their variance are made by the transition equations. Starting from initial beta estimates, the transition equations update the prior values of the betas and their variance from the last observations values. Continuing from equation (2) in section 3.2, the state variables xi,t are updated in each time step. Another time update equation updates the prior variance of the state variables. For the case of the random walk, the A is a unit matrix. 2 1,, εσ+= − − T titi AAVV (4) At each time step with new measurements, the measurement update equations update the state variables and its variance, by an optimal Kalman gain: )( ,,, ,, , υσ+ = −− − tititi titi ti VxV xV K (5) The numerator is the state variable variance while the denominator is the signal error variance. This Kalman gain is used to obtain ‘filtered’ estimates of the state variables ti, ^ β ∑= −− −+= n i titittititi xpK 1 ,,,,, ^ )( βββ (6) When the state variable is uncertain with a high variance, the Kalman gain is small, so that the posterior beta estimate doesn’t change much. Vice versa this is true as well. When the signal variance is small, the Kalman gain is large so that more emphasis is placed on the observed measurements, xi,t. At the posterior stage, the state variance is updated from the prior variance. − −= titititi VxKIV ,,,, )( (7) These steps recur at each observation, so that the impact of the explanatory factors on the crude is captured dynamically via the state variables/ betas. Intuitively the methodology relates the volatility of the oil prices to volatilities of the independent factors (speculation, days of stock cover, refinery utilization and backwardation/ contango) at each time step. The parameters and state variables are approximated via the maximum likelihood method which is ubiquitous in econometrics.