This report discusses the recent decline in oil prices and the battle between OPEC and the United States for control of the oil market. Oil prices fell from over $110 per barrel in 2014 to under $50 per barrel in early 2015 due to increased production from the U.S. and other non-OPEC countries. While lower prices benefited consumers and some economies, they hurt oil-producing countries. The U.S. has significantly increased oil production in recent years through fracking and other methods. As a result, OPEC is losing its dominance over the oil market and control over prices. The oversupply of oil from both OPEC and non-OPEC producers means prices are expected to remain low
The latest annual energy risk report issued by the U.S. Chamber of Commerce. The report shows the U.S. has jumped up the list by two spots in the world's top 25 largest energy users. The jump up the list means the U.S. continues to improve its energy security.
EY Price Point: global oil and gas market outlook (Q4, October 2020)EY
Oil and gas prices have recovered steadily from their lows and are relatively stable, but that stability is supported by the combination of purposeful withholding of production by oil-producing countries and economic stress on upstream independents. Oil prices closed the quarter roughly where they started it, while refining spreads were down slightly. LNG spreads were substantially higher at the end of Q3 than they were at the beginning of the quarter but are still roughly half of what is generally thought of as sustainable.
Going forward, the market will be looking closely at how the economy and demand respond to new developments with respect to a potential COVID-19 vaccine and the US election.
EY Price Point: global oil and gas market outlookEY
As the last quarter of the second pandemic year draws to a close, we continue to see heightened contrast
between the medical and economic points of view. While COVID-19 cases are close to their all-time highs, so
are equity prices, and a leading investment bank declared (on 2 December, 2021 after the Omicron outbreak in South Africa) that it was “optimistic about the possibility of a vibrant 2022.” When news of the variant hit in
late November, the markets were rocked by the prospect of yet another round of local mobility restrictions and
an interrupted return to normal international travel patterns, on top of the Biden Administration’s announced
release of 50 million barrels of crude from the US Strategic Petroleum Reserve. So far though, with OPEC
standing by its planned gradual return to normal production, oil prices have stabilized, albeit below where they
were in mid-November. Henry Hub prices, always at the mercy of the weather, responded predictably to a
warmer-than-normal early winter in the US, falling from US$6.60/MMBtu in early October to below
US$4.00/MMBtu by mid-December. In Europe and Asia, following a short reprieve at the start of the quarter,
piped natural gas prices have spiked again on concerns triggered by Russian troop buildups on the Ukraine
border and uncertainties surrounding the Nordstream 2 pipeline. Looking forward, OPEC and the U.S. Energy
Information Administration (EIA) in their last forecasts of the year both projected that 2022 oil demand would
be above what we saw in 2019. Although time will tell if those forecasts are realized and other events could
intervene, the response to new virus outbreaks is well-practiced and the trade-off between public health and
economic reality has tipped toward a cautiously optimistic view.
EY Price Point: global oil and gas market outlook, Q2 April 2021EY
The theme for this quarter is governed. Apparent market balance at prices that could be sustainable is the product of calculated choices by market leaders and the cooperation of those who follow them. Economics played their customary role as well, with capital scarcity in North America taking about 2 million barrels per day out of the market, about half of the remaining gap in demand. While inventories are close to their pre-COVID-19 levels, there is still uncertainty. The resolution of the pandemic is in sight, but timing is unclear. Vaccine distribution in the US is having an impact but Europe is struggling to contain a third wave of infections. The taps have opened on economic stimulus, but it remains to be seen if policymakers have done enough or if they have overshot the mark.
The shape of the crude oil forward curve has fundamentally changed since the end of the last quarter. In late December of last year, the Brent forward curve was gradually increasing while today, the curve is backwardated. This is a clear sign that the market sees a short-term dynamic that is disconnected from the medium-to-long-term fundamentals. The lasting impact of the COVID-19 pandemic remains to be seen. While many have opined that COVID-19 marks a turning point in energy transition, the IEA recently released a five-year forecast of oil demand that shows steady growth, albeit at rates that are below historical expectations.
Gas markets are a paradox. At the Henry Hub and at LNG destinations, demand grows, investment lags and prices will occasionally attract attention. Traders, so far though, are unconvinced and futures prices don’t indicate imminent scarcity at any link in the value chain.
Oil is the major
source of energy from most of the developed as well as developing countries around the world.
Therefore a change in the supply of oil will significantly affect operations in most parts of the
world. There are a number of factors that affect the demand and supply of oil in the world.
- See more at: http://www.customwritingservice.org/blog/factors-affecting-demand-and-supply-of-oil
EY Price Point: global oil and gas market outlookEY
We enter 2021 on a note of cautious optimism for global health, the world economy, and the oil and gas markets. The first weeks of December brought approval in the US and the UK of the first of several COVID-19 vaccines. The speed with which vaccine development occurred is unprecedented, but certainly welcome. In the weeks following the early November announcement of 90+% effectiveness by the manufacturer of the first approved vaccine, the price of WTI crude oil increased by US$10/bbl to US$48/bbl, the highest level since early March. Sustainability hasn’t returned yet, and whatever time it takes to get the world to normal, it will take even longer for normalization within the oil and gas markets. Inventories remain at historically high levels and, optimistically, it will take until April before inventory returns to levels observed in the preceding five years. That’s an estimate, and there has obviously been some difficulty properly calibrating the expectations of how balance will return and how long it will take. In late November, OPEC met to adjust its output plans because of the anemic rebound in demand. In mid-December, the IEA lowered its demand forecast for 2021 due mostly to continued sluggishness in aviation fuel demand.
A mild winter has interrupted a recovery in North American natural gas prices after a run-up motivated by curtailed capital expenditures, upstream activity and production. After an initial meltdown, with cargo cancellations and dramatic price reversal, LNG markets have made a remarkable comeback, and the spread between Asia and Henry Hub has reached a level we haven’t seen in almost three years. It may be the case that interruption in FIDs has brought us to the cusp of a balance that can support reliable returns.
EY Price Point: global oil and gas market outlookEY
As we close the second quarter of 2020, in most of Europe and Asia, the first (and hopefully last) wave of the COVID-19 crisis appears to be abating. In the parts of the US where the virus hit early, the profile has largely matched Europe’s, while in other parts, the urge to reopen businesses has trumped the desire to contain the virus and uncertainty looms. In the developing world, the crisis has just begun, but without the economic headroom and resources necessary to contain it. As the crisis unfolded, the effect on oil and gas demand has been predictable but difficult to gauge precisely and therefore difficult to manage.
Oil prices have crept up steadily as production has been curtailed through coordinated action (OPEC+) and because of economic reality (unconventional oil in North America). That trend has been subject to momentary spasms when bad news hit the market. It would be understandable if traders were nervous, and it seems that they are. Although nowhere near where it was at the peak of the crisis, option implied volatility is still at historically high levels. Gas markets, without the benefit of coordination on the supply side, continue to deal with the market implications of storage at or near capacity. Interfuel competition in power generation has always provided something of a floor, but those lows have been, and will continue to be, tested.
Crude oil price in 2011
When analyzing the prospects of crude oil price in 2011, there are several aspects worth considering. The expected increase in world demand for Oil in 2011 - IEA (International Energy Agency) expects petroleum demand worldwide in 2011 to be 88.8 million barrels per day, which is roughly a 1.6% increase in demand for oil in 2011 compares to 2010; in 2010 the daily consumption was estimated at 87.4 MB/d. OPEC, which is responsible for about 40 percent of the world crude oil supply, announced, in a recent OPEC meeting, it will sustain its current quota of 24.845 million which was set back in 2008.
declining crude oil pricing:causes and global impactSatyam Mishra
this presentation gives some insight into the causes of declining crude oil pricing and how that is going to affect various oil producing and non oil producing countries across the globe.
Opec - Organization of Petroleum Exporting Countries. Vikas C
The Organization of the Petroleum Exporting Countries (OPEC) is a permanent, intergovernmental Organization, was established in Baghdad.
OPEC comprised 12 members: Algeria, Angola, Ecuador, Iran, Iraq Kuwait, Libya, Nigeria, Qatar, Saudi Arabia, United Arab Emirates Venezuela.
Petrodollar is a United State dollar earned by the country through the sale of petroleum.
Shale oil is an unconventional oil produced from oil shale rock fragments by pyrolysis, hydrogenation, or thermal dissolution. These processes convert the organic matter within the rock into synthetic oil & gas.
OPEC Share of World Crude Oil Reserves - According to current estimates, more than 81% of the world's proven oil reserves are located in OPEC Member Countries, with the bulk of OPEC oil reserves in the Middle East, amounting to 66% of the OPEC total.
80% of the world's oil reserves are located in just 13 countries which make up OPEC (the Organization of the Petroleum Exporting Countries). Algeria, Venezuela, Saudi Arabia, Iran, Iraq, Kuwait, Angola, Indonesia, Ecuador, Libya, Nigeria, Qatar, and the United Arab Emirates.
The Saturday Economist Oil Market Update 2015John Ashcroft
What is pushing oil prices lower? What’s the difference between Brent Crude or West Texas Intermediate? Will prices stay low and what are the prospects for oil demand growth? Who are the winners and losers? What is the impact of lower oil prices on the economy? Are lower oil prices good for growth? What does the falling price mean for the consumer? US Oils rigs go up as the oil prices rise, so is the real challenge, Sheiks versus Shale or a Western squeeze on Russian resources?
Check out our oil market update to understand just what is happening in the oil Market
Oil majors and traders role of opec,ocimf & intertankoKapilLamba6
Information and analysis of oil majors traders importance of them oil as commodity trading its importance and various agencies relate with smooth world wide operation of oil and petroleum products and regulation
EY Price Point: global oil and gas market outlookEY
The theme for this quarter is reprieve. Crude prices rose steadily throughout 1Q19 as OPEC+ reigned in production to counteract the impact of North American production growth. What lies ahead is uncertain, but downward pressures loom over the marketplace.
The Saudi Riyal, is my assignment for ECO209: Intermediate Macroeconomics II. It talks about the currency exchange rate.
Course Instructor: Dr. Farzana Munshi
Oil Prices have been extremely volatile during the last decade due to extensive speculative pressures on the commodity. in this episode of Energy Risk Management Series we show one of the methods of countering the same.
CRUDE OIL PRICES:WHY ARE THEY FALLING AND ITS IMPACT ON WORLD ECONOMY AND INDIA
Oil Prices in Today’s Economy
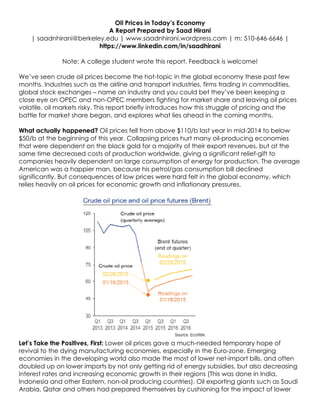
1. Oil Prices in Today’s Economy
A Report Prepared by Saad Hirani
| saadnhirani@berkeley.edu | www.saadnhirani.wordpress.com | m: 510-646-6646 |
https://www.linkedin.com/in/saadhirani
Note: A college student wrote this report. Feedback is welcome!
We’ve seen crude oil prices become the hot-topic in the global economy these past few
months. Industries such as the airline and transport industries, firms trading in commodities,
global stock exchanges – name an industry and you could bet they’ve been keeping a
close eye on OPEC and non-OPEC members fighting for market share and leaving oil prices
volatile, oil markets risky. This report briefly introduces how this struggle of pricing and the
battle for market share began, and explores what lies ahead in the coming months.
What actually happened? Oil prices fell from above $110/b last year in mid-2014 to below
$50/b at the beginning of this year. Collapsing prices hurt many oil-producing economies
that were dependent on the black gold for a majority of their export revenues, but at the
same time decreased costs of production worldwide, giving a significant relief-gift to
companies heavily dependent on large consumption of energy for production. The average
American was a happier man, because his petrol/gas consumption bill declined
significantly. But consequences of low prices were hard felt in the global economy, which
relies heavily on oil prices for economic growth and inflationary pressures.
Let’s Take the Positives, First: Lower oil prices gave a much-needed temporary hope of
revival to the dying manufacturing economies, especially in the Euro-zone. Emerging
economies in the developing world also made the most of lower net-import bills, and often
doubled up on lower imports by not only getting rid of energy subsidies, but also decreasing
interest rates and increasing economic growth in their regions (This was done in India,
Indonesia and other Eastern, non-oil producing countries). Oil exporting giants such as Saudi
Arabia, Qatar and others had prepared themselves by cushioning for the impact of lower
2. prices by accumulating other foreign assets. The average household’s purchasing power
suddenly rose, and global economic spending forecasts smiled at the IMF and leading
economies for the first time in a few years.
It’s Not a Fairytale Though: Many oil producing economies such as Russia, including some
members of the OPEC (Venezuela, Libya) took a significant hit and dived towards recessions.
Heavily reliant on oil revenue with their policies invested in black gold, these economies
possessed large costs of producing barrels and remained unable to trade competitively at
lowering prices. Public budgets in such countries have been cut heavily; with governments
risking social and political turmoil for the sake of makes their budgets meet. Second order
effects also began creeping in, with large oil corporations such as Chevron, cancelling major
development projects with $10bn. Goldman Sachs estimated that low oil prices put $1tn of
investments at risk. Construction companies, energy sector related companies; all were
pulling back on work projects, as ends could no longer meet.
That’s not it folks- we’ve forgotten about the whole matter of cleanliness and green energy
in this discussion; with minds completely focused on lowering oil prices, energy investments in
solar and other, more expensive forms of energy decreased heavily, putting the dream of a
clean economy at hold. The economic viability of cleaner energy sources was heavily reliant
on decreasing oil supply and high barrel prices; the class micro economic concept of the
substitution effect has knocked out wind and solar energy firms from the global energy
equation for now.
Why did Oil Prices fall so much? Everything usually tends to fall when America enters the
equation- everything from governments to oil prices. America finally found its golden
method of producing oil, and has increased production in recent years by 60% since 2009!
Though most crude oil exports are still banned, one of the world’s largest economies has
managed to reduce its oil imports to next-to-nothing. The decrease in American imports
caused a glut in global demand for oil. Shale production, horizontal drilling and hydraulic
fracturing methods have allowed the USA to decrease its cost of production of oil, to well
below the world price and hence the USA’s independence in it’s largest need has left global
producers lacking customers of its best product. The USA is slowly establishing itself as a
leader in the world economy for oil production, and its half-decade long surge may finally
have neared to breaking OPEC.
Breaking OPEC... You’re Joking Right? I found this hard to digest too, but I’m not. It’s time to
accept that the OPEC is not as strong as it once used to be, and that it’s slowly beginning to
3. lose its leverage over prices in the Oil Market. The cartel has not been able to cut back
supply and increase oil prices to reach the $100/b mark that many members of OPEC need
in order to break even on their investments and balance their budget. OPEC’s market share
in the global oil market has declined since a strong 50% hold in 1979 to about 1/3rd of the
global oil market. Whereas it’s large market share let it increase prices at will by restricting
supply, today, the threat exists that if OPEC increases its price, the USA’s additional pumping
ability will allow it to cut deeper into OPEC’s market share and only deepen wounds more.
As a result, OPEC itself is favoring such low prices. OPEC’s long term position and its strategies
are geared towards increasing production of crude oil and focusing on stimulating demand
for crude oil so that it can recapture its market share in the global oil economy. This policy
has been widely accepted as the best means going forward by many countries in OPEC
such as Saudi Arabia, but has led to a lot of anger among countries like Libya and
Venezuela whose break-even prices of crude oil are much higher than market prices at the
moment.
To sum it up, there finally is an element of ‘free market’ in the oil economy. There are more
than 4000 oil producers in the USA, and coordinating price controls with OPEC is impossible
to manage. Hence, the only way forward for OPEC is to pump more oil, in a last ditch
attempt to regain its market share and work to establish future credibility in order to dream of
manipulating prices once again in the future.
What Happens NOW? Well, OPEC’s been pumping record oil levels, having produced close
to 31m barrels a day for the first time since 2012. The USA isn’t backing down either, trying to
assert its dominance and prevent OPEC from regaining its share. The supply of oil in the world
market is far exceeding demand; by up to 2m barrels a day – hence, an inventory of
4. untraded oil is beginning to stock up. With neither OPEC nor USA willing to decrease
production in a race for leadership in the world’s most important commodity.
For OPEC, things don’t look too good. According to the IEA, demand for OPEC produced oil
is flat or declining; customers are either producing their own oil or are turning to non-OPEC
members putting OPEC countries at a severe disadvantage. The USA on the other hand, has
enjoyed more than $20bn of investments in oil startups in private equity, and Wall Street has
been kind to public oil companies, keeping the USA energy boom running well. In Q1’15, US
listed oil corporations reported a recorded $16.7bn in funding in convertible bonds.
With OPEC ministers declaring in their latest meeting in Vienna that they are optimistic of the
global growing economy and that they are confident in their ability to regain their market
share, and the USA energy market not even close to peeking, one thing is for sure – no one
currently leads the oil market, which is for the first time enjoying free market forces; the oil
market war is only just beginning.
Sources Used:
• http://www.economist.com/blogs/economist-explains/2015/03/economist-explains-14
• http://www.wsj.com/articles/oil-prices-fall-amid-opec-chatter-1433321240
• http://www.wsj.com/articles/opecs-pricing-leverage-is-weakening-
1433117819?KEYWORDS=OPEC
• http://blogs.wsj.com/moneybeat/2015/06/02/is-opec-about-to-step-up-
production/?KEYWORDS=OPEC