The oil price rebounded 31% over the last three weeks after falling 57% between June 2014 and January 2015. The document analyzes whether further recovery is likely, concluding that technical factors in financial markets explained the recent rebound but are temporary. Fundamental supply adjustments from reduced investment and drilling will impact prices starting in 2016-2017 by gradually clearing the supply glut. The analysis forecasts oil to average $56/barrel in 2015 before rising to $64/barrel in 2016 and $69/barrel in 2017.
EY Price Point: global oil and gas market outlook, Q319EY
The theme for this quarter is consistency: in the significant trends impacting prices, at least. The forces that impacted oil prices in the second quarter were the same as those that have impacted prices quarter after quarter for the past several years. Surging North American production counterbalanced by OPEC+ production cuts has kept prices in a fairly narrow range. The market has become remarkably resilient. For some time now, long-dated oil futures have traded at a price very close to the market’s view of the break-even price of unconventional oil in North America.
EY Price Point: global oil and gas market outlookEY
As the last quarter of the second pandemic year draws to a close, we continue to see heightened contrast
between the medical and economic points of view. While COVID-19 cases are close to their all-time highs, so
are equity prices, and a leading investment bank declared (on 2 December, 2021 after the Omicron outbreak in South Africa) that it was “optimistic about the possibility of a vibrant 2022.” When news of the variant hit in
late November, the markets were rocked by the prospect of yet another round of local mobility restrictions and
an interrupted return to normal international travel patterns, on top of the Biden Administration’s announced
release of 50 million barrels of crude from the US Strategic Petroleum Reserve. So far though, with OPEC
standing by its planned gradual return to normal production, oil prices have stabilized, albeit below where they
were in mid-November. Henry Hub prices, always at the mercy of the weather, responded predictably to a
warmer-than-normal early winter in the US, falling from US$6.60/MMBtu in early October to below
US$4.00/MMBtu by mid-December. In Europe and Asia, following a short reprieve at the start of the quarter,
piped natural gas prices have spiked again on concerns triggered by Russian troop buildups on the Ukraine
border and uncertainties surrounding the Nordstream 2 pipeline. Looking forward, OPEC and the U.S. Energy
Information Administration (EIA) in their last forecasts of the year both projected that 2022 oil demand would
be above what we saw in 2019. Although time will tell if those forecasts are realized and other events could
intervene, the response to new virus outbreaks is well-practiced and the trade-off between public health and
economic reality has tipped toward a cautiously optimistic view.
EY Price Point: global oil and gas market outlook, Q2, April 2020EY
The first quarter of this year has seen some extraordinary events. As if chronic oversupply, prices stuck below sustainable levels, the looming energy transition, and investor pressure to decarbonize weren’t enough, our industry now faces a dramatic, but hopefully temporary, downturn in demand as a result of the ongoing COVID-19 outbreak.
EY Price Point: global oil and gas market outlook (Q4, October 2020)EY
Oil and gas prices have recovered steadily from their lows and are relatively stable, but that stability is supported by the combination of purposeful withholding of production by oil-producing countries and economic stress on upstream independents. Oil prices closed the quarter roughly where they started it, while refining spreads were down slightly. LNG spreads were substantially higher at the end of Q3 than they were at the beginning of the quarter but are still roughly half of what is generally thought of as sustainable.
Going forward, the market will be looking closely at how the economy and demand respond to new developments with respect to a potential COVID-19 vaccine and the US election.
EY Price Point: global oil and gas market outlook, Q2 | April 2022EY
The theme for this quarter is rearrangement. The loss, or potential loss, of Russian oil and gas supplies is forcing producers, refiners and traders to rethink the flow of crude oil and refined products from the wellhead to the gas pump in light of sanctions, potential sanctions and the risk of reputational damage. Countries, companies and consumers will all be searching for ways to adapt, and the outcome of the race to bring alternatives to market could alter the global energy landscape for years to come.
It is likely crude oil and LNG prices will remain elevated for some time. The process of diverting Russian oil through countries unwilling to sanction it will take time and there is little indication OPEC members are willing (or able) to increase production to make up for the loss of Russian crude. Spare capacity sat at 3.7 mbpd at the end of 2021, just above where it was in January 2020. Currently, sanctioned Venezuelan and Iranian production (about 3 mbpd below their peak) could fill the gap, but political and commercial obstacles remain. At today’s prices, US shale production is attractive, but the fastest the industry has been able to grow is between 1mbpd and 2mbpd per year. The LNG infrastructure was already stretched before the war in Ukraine and there is little prosect of finding new supplies soon.
As the largest buyer of Russian energy, Europe will be the epicenter. There is a deeply embedded bias there in favor for renewable energy, and the current crisis is certain to result in an all-out effort to accelerate the build-out of wind and solar power. The capacity to add new green energy is limited though by the project pipeline and supply chains for solar panels and wind turbines, and it is likely that much of the shortfall will be made up with the new LNG infrastructure.
EY Price Point: global oil and gas market outlookEY
We enter 2021 on a note of cautious optimism for global health, the world economy, and the oil and gas markets. The first weeks of December brought approval in the US and the UK of the first of several COVID-19 vaccines. The speed with which vaccine development occurred is unprecedented, but certainly welcome. In the weeks following the early November announcement of 90+% effectiveness by the manufacturer of the first approved vaccine, the price of WTI crude oil increased by US$10/bbl to US$48/bbl, the highest level since early March. Sustainability hasn’t returned yet, and whatever time it takes to get the world to normal, it will take even longer for normalization within the oil and gas markets. Inventories remain at historically high levels and, optimistically, it will take until April before inventory returns to levels observed in the preceding five years. That’s an estimate, and there has obviously been some difficulty properly calibrating the expectations of how balance will return and how long it will take. In late November, OPEC met to adjust its output plans because of the anemic rebound in demand. In mid-December, the IEA lowered its demand forecast for 2021 due mostly to continued sluggishness in aviation fuel demand.
A mild winter has interrupted a recovery in North American natural gas prices after a run-up motivated by curtailed capital expenditures, upstream activity and production. After an initial meltdown, with cargo cancellations and dramatic price reversal, LNG markets have made a remarkable comeback, and the spread between Asia and Henry Hub has reached a level we haven’t seen in almost three years. It may be the case that interruption in FIDs has brought us to the cusp of a balance that can support reliable returns.
EY Price Point: global oil and gas market outlook, Q2 April 2021EY
The theme for this quarter is governed. Apparent market balance at prices that could be sustainable is the product of calculated choices by market leaders and the cooperation of those who follow them. Economics played their customary role as well, with capital scarcity in North America taking about 2 million barrels per day out of the market, about half of the remaining gap in demand. While inventories are close to their pre-COVID-19 levels, there is still uncertainty. The resolution of the pandemic is in sight, but timing is unclear. Vaccine distribution in the US is having an impact but Europe is struggling to contain a third wave of infections. The taps have opened on economic stimulus, but it remains to be seen if policymakers have done enough or if they have overshot the mark.
The shape of the crude oil forward curve has fundamentally changed since the end of the last quarter. In late December of last year, the Brent forward curve was gradually increasing while today, the curve is backwardated. This is a clear sign that the market sees a short-term dynamic that is disconnected from the medium-to-long-term fundamentals. The lasting impact of the COVID-19 pandemic remains to be seen. While many have opined that COVID-19 marks a turning point in energy transition, the IEA recently released a five-year forecast of oil demand that shows steady growth, albeit at rates that are below historical expectations.
Gas markets are a paradox. At the Henry Hub and at LNG destinations, demand grows, investment lags and prices will occasionally attract attention. Traders, so far though, are unconvinced and futures prices don’t indicate imminent scarcity at any link in the value chain.
Please find attached our complimentary copy of our Oil Buyer's Guide 2013 Review. This is just a sample of incredible content our subscribers receive each day. Visit bloombergbriefs.com for more information.
Mercer Capital's Value Focus: Energy Industry | 3Q 2015 | Segment: Explorati...Mercer Capital
Mercer Capital's Energy Industry newsletter provides perspective on valuation issues. Each newsletter also typically includes a macroeconomic trends, industry trends, and guideline public company metrics.
EY Price Point: global oil and gas market outlookEY
The theme for this quarter is resilience. A 6% supply outage in September was unable to push Brent prices above US$70/bbl. Demand concerns, driven by slowing world economic growth and the need to decarbonize, quickly retook the stage despite output from Venezuela and Iran being hindered by political turmoil and international sanctions.
Technology enhancements are a significant contributor to the market’s sanguine attitude towards supply disruption. Operators are able to produce greater volumes, quicker, and at a lower cost. That trend can only continue.
LNG markets continue to mature as traders play an increasing role in directing cargoes and setting prices. The pipeline for LNG projects remains healthy as market participants aim to establish a position in a market that is seen as the best opportunity for growth in oil and gas.
Quarterly analyst themes of oil and gas earningsEY
As it almost always is, oil and gas profitability was driven by crude oil, refined product and natural gas market conditions in Q2 2019. Oil prices seesawed, rising steadily during the first half of the quarter, falling during most of the second half of the quarter, before rising again at the end.
EY Price Point: global oil and gas market outlookEY
As we close the second quarter of 2020, in most of Europe and Asia, the first (and hopefully last) wave of the COVID-19 crisis appears to be abating. In the parts of the US where the virus hit early, the profile has largely matched Europe’s, while in other parts, the urge to reopen businesses has trumped the desire to contain the virus and uncertainty looms. In the developing world, the crisis has just begun, but without the economic headroom and resources necessary to contain it. As the crisis unfolded, the effect on oil and gas demand has been predictable but difficult to gauge precisely and therefore difficult to manage.
Oil prices have crept up steadily as production has been curtailed through coordinated action (OPEC+) and because of economic reality (unconventional oil in North America). That trend has been subject to momentary spasms when bad news hit the market. It would be understandable if traders were nervous, and it seems that they are. Although nowhere near where it was at the peak of the crisis, option implied volatility is still at historically high levels. Gas markets, without the benefit of coordination on the supply side, continue to deal with the market implications of storage at or near capacity. Interfuel competition in power generation has always provided something of a floor, but those lows have been, and will continue to be, tested.
The theme for this quarter is inorganic. Although prices climbed in the fourth quarter as the balance of supply and demand tilted in favour of demand, OPEC + restraint was fundamental.
The market is conscious of downside pressures that loom. OPEC + has announced production cuts through to the end of the first quarter. Beyond the first quarter, there is a risk that OPEC + grows weary of supporting the market and reverts to a strategy of growing production, protecting market share and placing pressure on the economics of unconventional producers. Production growth in Brazil and Norway has the potential to consume a significant portion of demand growth expected in 2020. Whether, or the extent to which, US shale output growth continues despite escalating financial strain across the E&P sector will be key in determining whether OPEC + cuts will be sufficient to balance the market in 2020.
In the longer-term, focus remains on the energy mix of the future and its impact on the demand for petroleum products. A number of significant uncertainties remain, including electric vehicle (EV) penetration. EY’s ‘Fueling the Future’ analyzes the outlook under four distinct scenarios. The analysis shows that an inflection point in EV penetration is required by 2022 if the terms of the Paris Accord are to be met.
The Saturday Economist Oil Market Update 2015John Ashcroft
What is pushing oil prices lower? What’s the difference between Brent Crude or West Texas Intermediate? Will prices stay low and what are the prospects for oil demand growth? Who are the winners and losers? What is the impact of lower oil prices on the economy? Are lower oil prices good for growth? What does the falling price mean for the consumer? US Oils rigs go up as the oil prices rise, so is the real challenge, Sheiks versus Shale or a Western squeeze on Russian resources?
Check out our oil market update to understand just what is happening in the oil Market
GROWTH FACTORS AND CHALLENGES FOR OIL MARKET; Demographic Factors; Oil Demand; Motorization in Asian Countries; Upstream Costs Increase; US Shale Oil Production; Deepwater Production; Iraqi production growth prospects; GTL – challenge for the oil market after 2020
CAL Investments latest think piece “Global & Local Economic Insights” entails a broad analysis on the global economic overview and a more comprehensive analysis on the local fiscal outlook.
EY Price Point: global oil and gas market outlookEY
The theme for this quarter is reprieve. Crude prices rose steadily throughout 1Q19 as OPEC+ reigned in production to counteract the impact of North American production growth. What lies ahead is uncertain, but downward pressures loom over the marketplace.
Financial Algorithms presents the energy trading scenario for the year 2016. In this presentation, after examining various fundamental factors in energy sector, FA forecasts the crude oil price, gasoline & natural gas price levels for the year 2016; in case of mean volatility levels and high volatility levels, both. FA also focuses on how to model price levels and volatility surfaces in low volatility and high volatility scenarios under forward & forward-forward models using various energy contracts and spreads i.e. crack spread. Various greek sensitivities including second order & third order greeks, which can be helpful in projecting the price & volatility levels, are also described. At the end, correlation factors, fundamental & technical both, are discussed. These correlation factors are exogenous in price forecasting, and new emerging trends which can affect the energy trading in a long run also been discussed.
New base energy news issue 915 dated 25 august 2016Khaled Al Awadi
Greetings,
Attached FYI (NewBase 25 August 2016 ) , from Hawk Energy Services Dubai . Daily energy news covering the MENA area and related worldwide energy news. In today’s issue you will find news about:-
• LNG IN THE NEW OIL PRICE ERA, By Morten Frisch
• Saudi Arabia Holds China Market Share Lead on Record Oil Output
• China Oil Giants Unmoved by Bull Rally After Worst-Ever Earnings
• Norway's Oil Investments To Fall Again In 2017
• Kenya: Work Begins on 2D Seismic Survey in Wajir Kenya
• Kenya: First Kenyan Oil Due by March 2017; Exports to Follow
• Oil prices fall as market focus returns to global supply overhang
• As Japan and South Korea import less LNG, other Asian countries begin to import more
we would appreciate your actions to send to all interested parties that you may wish. Also note that if you or your organization wish to include your own article or advert in our circulations, please send it to :-
khdmohd@hotmail.com or khdmohd@hawkenergy.net
Best Regards.
Khaled Al Awadi
Energy Consultant & NewBase Chairman - Senior Chief Editor
MS & BS Mechanical Engineering (HON), USA
Emarat member since 1990
ASME meme since 1995
Hawk Energy since 2010
Mercer Capital's Value Focus: Energy Industry | Q3 2021 | Segment: BakkenMercer Capital
Mercer Capital's Energy Industry newsletter provides perspective on valuation issues. Each newsletter also typically includes a macroeconomic trends, industry trends, and guideline public company metrics.
QNBFS Daily Market Report December 24, 2023QNB Group
The QE Index rose 0.8% to close at 10,285.3. Gains were led by the Transportation and Banks & Financial Services indices, gaining 1.4% and 1.2%, respectively.
QNBFS Daily Market Report October 04, 2023QNB Group
The QE Index rose 0.2% to close at 10,273.3. Gains were led by the Transportation and Consumer Goods & Services indices, gaining 1.7% and 0.1%, respectively.
QNBFS Daily Technical Trader Qatar - October 04, 2023 التحليل الفني اليومي لب...QNB Group
The General Index failed to sustain its breakout above the double-bottom formation’s neckline and continued with its decline into the formation’s territory.
QNBFS Daily Technical Trader Qatar - September 28, 2023 التحليل الفني اليومي ...QNB Group
The General Index failed to sustain its breakout above the double-bottom formation’s neckline and continued with its decline into the formation’s territory.
QNBFS Daily Market Report September 24, 2023QNB Group
The QE Index rose 0.3% to close at 10,323.0. Gains were led by the Transportation and Industrials indices, gaining 0.8% each. Top gainers were Qatar Navigation and Al Khaleej Takaful Insurance Co., rising 3.3% and 2.0%, respectively.
QNBFS Daily Technical Trader Qatar - September 24, 2023 التحليل الفني اليومي ...QNB Group
The General Index failed to sustain its breakout above the double-bottom formation’s neckline and continued with its decline into the formation’s territory.
QNBFS Daily Technical Trader Qatar - September 19, 2023 التحليل الفني اليومي ...QNB Group
The General Index failed to sustain its breakout above the double-bottom formation’s neckline and continued with its decline into the formation’s territory.
QNBFS Daily Market Report September 17, 2023QNB Group
The QE Index declined 0.5% to close at 10,319.3. Losses were led by the Industrials and Consumer Goods & Services indices, falling 1.4% and 1.1%, respectively.
QNBFS Daily Technical Trader Qatar - September 07, 2023 التحليل الفني اليومي ...QNB Group
The General Index failed to
sustain its breakout above the
double-bottom formation’s
neckline and continued with
its decline into the
formation’s territory.
QNBFS Daily Technical Trader Qatar - September 07, 2023 التحليل الفني اليومي ...
Are Oil Prices Poised For a Rebound?
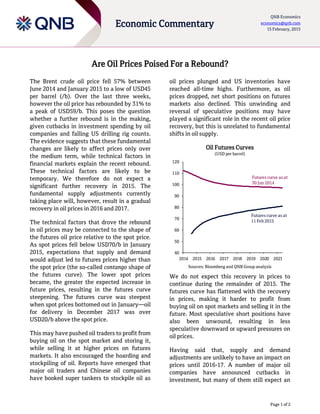
1. Page 1 of 2
Economic Commentary
QNB Economics
economics@qnb.com
15 February, 2015
Are Oil Prices Poised For a Rebound?
The Brent crude oil price fell 57% between
June 2014 and January 2015 to a low of USD45
per barrel (/b). Over the last three weeks,
however the oil price has rebounded by 31% to
a peak of USD59/b. This poses the question
whether a further rebound is in the making,
given cutbacks in investment spending by oil
companies and falling US drilling rig counts.
The evidence suggests that these fundamental
changes are likely to affect prices only over
the medium term, while technical factors in
financial markets explain the recent rebound.
These technical factors are likely to be
temporary. We therefore do not expect a
significant further recovery in 2015. The
fundamental supply adjustments currently
taking place will, however, result in a gradual
recovery in oil prices in 2016 and 2017.
The technical factors that drove the rebound
in oil prices may be connected to the shape of
the futures oil price relative to the spot price.
As spot prices fell below USD70/b in January
2015, expectations that supply and demand
would adjust led to futures prices higher than
the spot price (the so-called contango shape of
the futures curve). The lower spot prices
became, the greater the expected increase in
future prices, resulting in the futures curve
steepening. The futures curve was steepest
when spot prices bottomed out in January—oil
for delivery in December 2017 was over
USD20/b above the spot price.
This may have pushed oil traders to profit from
buying oil on the spot market and storing it,
while selling it at higher prices on futures
markets. It also encouraged the hoarding and
stockpiling of oil. Reports have emerged that
major oil traders and Chinese oil companies
have booked super tankers to stockpile oil as
oil prices plunged and US inventories have
reached all-time highs. Furthermore, as oil
prices dropped, net short positions on futures
markets also declined. This unwinding and
reversal of speculative positions may have
played a significant role in the recent oil price
recovery, but this is unrelated to fundamental
shifts in oil supply.
Oil Futures Curves
(USD per barrel)
Sources: Bloomberg and QNB Group analysis
We do not expect this recovery in prices to
continue during the remainder of 2015. The
futures curve has flattened with the recovery
in prices, making it harder to profit from
buying oil on spot markets and selling it in the
future. Most speculative short positions have
also been unwound, resulting in less
speculative downward or upward pressures on
oil prices.
Having said that, supply and demand
adjustments are unlikely to have an impact on
prices until 2016-17. A number of major oil
companies have announced cutbacks in
investment, but many of them still expect an
40
50
60
70
80
90
100
110
120
2014 2015 2016 2017 2018 2019 2020 2021
Futures curve as at
30 Jun 2014
Futures curve as at
11 Feb 2015
2. Page 2 of 2
Economic Commentary
QNB Economics
economics@qnb.com
15 February, 2015
increase in production in 2015, particularly US
shale oil producers. For example, Continental
Resources cut investment spending by 41% to
USD2.7bn, but still expects production to
increase by 20% this year. The International
Energy Agency stated in a report last week
that it expects the pullback in shale oil
production to be “limited in scope”.
Investment cutbacks are leading to lower
numbers of operational drilling rigs in the US,
but this is likely to impact production only in
2016-17. The number of operational US drilling
rigs has fallen by 21% to 1,456 so far in 2015.
However, historical data on US rig counts
appear to have minimal relationship with US
crude oil production. A falling rig count during
2012 had no visible impact on US oil
production, which continued rising steadily.
Once a well is drilled, it can take some time for
it to be developed and become operational. Oil
companies tend to have a stock of oil wells
that are drilled but are waiting to come into
full operation. Furthermore, the average
productivity of oil wells has been rising in
recent years and is expected to continue
increasing. As a result, the decline in
operational drilling rigs is only likely to impact
oil prices from 2016-17.
Oil Production and Drilling Rigs (2010-15)
Sources: Bloomberg and QNB Group analysis
In summary, we do not expect oil prices to
recover much further in 2015, averaging
around USD56/b for the full year. Falling
investment spending by oil companies should
begin to have an impact on production by
2016-17, adding some upward pressure on
prices as the supply glut is cleared. We
therefore expect prices to recover to USD64/b
in 2016 and USD69/b in 2017. These forecasts
are broadly in line with the oil futures market.
However, it is predicated on a recovery of the
world economy and oil demand, something
that remains a risk going forward.
Contacts
Joannes Mongardini
Head of Economics
+974- 4453-4412
Rory Fyfe
Senior Economist
+974-4453-4643
Ehsan Khoman
Economist
+974-4453-4423
Hamda Al-Thani
Economist
+974-4453-4646
Ziad Daoud
Economist
+974-4453-4642
Disclaimer and Copyright Notice: QNB Group accepts no liability whatsoever for any direct or indirect losses arising from use of this report.
Where an opinion is expressed, unless otherwise provided, it is that of the analyst or author only. Any investment decision should depend
on the individual circumstances of the investor and be based on specifically engaged investment advice. The report is distributed on a
complimentary basis. It may not be reproduced in whole or in part without permission from QNB Group.
0
1
2
3
4
5
6
7
8
9
10
1000
1200
1400
1600
1800
2000
2200
2010 2011 2012 2013 2014 2015
USDrilling Rig Count (left axis)
UScrudeoil production (mbarrels, right axis)