This document discusses trends in global commodity and financial markets in the first half of 2015. It notes that while commodity prices continued declining in early 2015, some saw slight rebounds in the second quarter. Oil prices rose from January lows as supply increased from Iran, Russia, and the US, while demand grew in Europe and China. However, excess supply remained high globally. The document predicts that competition for market share between OPEC and shale producers could further widen excess supply in the second half of 2015, putting downward pressure on prices. It also summarizes trends in other commodity markets like agriculture and metals.
EY Price Point: global oil and gas market outlook, Q319EY
The theme for this quarter is consistency: in the significant trends impacting prices, at least. The forces that impacted oil prices in the second quarter were the same as those that have impacted prices quarter after quarter for the past several years. Surging North American production counterbalanced by OPEC+ production cuts has kept prices in a fairly narrow range. The market has become remarkably resilient. For some time now, long-dated oil futures have traded at a price very close to the market’s view of the break-even price of unconventional oil in North America.
EY Price Point: global oil and gas market outlookEY
As the last quarter of the second pandemic year draws to a close, we continue to see heightened contrast
between the medical and economic points of view. While COVID-19 cases are close to their all-time highs, so
are equity prices, and a leading investment bank declared (on 2 December, 2021 after the Omicron outbreak in South Africa) that it was “optimistic about the possibility of a vibrant 2022.” When news of the variant hit in
late November, the markets were rocked by the prospect of yet another round of local mobility restrictions and
an interrupted return to normal international travel patterns, on top of the Biden Administration’s announced
release of 50 million barrels of crude from the US Strategic Petroleum Reserve. So far though, with OPEC
standing by its planned gradual return to normal production, oil prices have stabilized, albeit below where they
were in mid-November. Henry Hub prices, always at the mercy of the weather, responded predictably to a
warmer-than-normal early winter in the US, falling from US$6.60/MMBtu in early October to below
US$4.00/MMBtu by mid-December. In Europe and Asia, following a short reprieve at the start of the quarter,
piped natural gas prices have spiked again on concerns triggered by Russian troop buildups on the Ukraine
border and uncertainties surrounding the Nordstream 2 pipeline. Looking forward, OPEC and the U.S. Energy
Information Administration (EIA) in their last forecasts of the year both projected that 2022 oil demand would
be above what we saw in 2019. Although time will tell if those forecasts are realized and other events could
intervene, the response to new virus outbreaks is well-practiced and the trade-off between public health and
economic reality has tipped toward a cautiously optimistic view.
EY Price Point: global oil and gas market outlookEY
We enter 2021 on a note of cautious optimism for global health, the world economy, and the oil and gas markets. The first weeks of December brought approval in the US and the UK of the first of several COVID-19 vaccines. The speed with which vaccine development occurred is unprecedented, but certainly welcome. In the weeks following the early November announcement of 90+% effectiveness by the manufacturer of the first approved vaccine, the price of WTI crude oil increased by US$10/bbl to US$48/bbl, the highest level since early March. Sustainability hasn’t returned yet, and whatever time it takes to get the world to normal, it will take even longer for normalization within the oil and gas markets. Inventories remain at historically high levels and, optimistically, it will take until April before inventory returns to levels observed in the preceding five years. That’s an estimate, and there has obviously been some difficulty properly calibrating the expectations of how balance will return and how long it will take. In late November, OPEC met to adjust its output plans because of the anemic rebound in demand. In mid-December, the IEA lowered its demand forecast for 2021 due mostly to continued sluggishness in aviation fuel demand.
A mild winter has interrupted a recovery in North American natural gas prices after a run-up motivated by curtailed capital expenditures, upstream activity and production. After an initial meltdown, with cargo cancellations and dramatic price reversal, LNG markets have made a remarkable comeback, and the spread between Asia and Henry Hub has reached a level we haven’t seen in almost three years. It may be the case that interruption in FIDs has brought us to the cusp of a balance that can support reliable returns.
EY Price Point: global oil and gas market outlook, Q2, April 2020EY
The first quarter of this year has seen some extraordinary events. As if chronic oversupply, prices stuck below sustainable levels, the looming energy transition, and investor pressure to decarbonize weren’t enough, our industry now faces a dramatic, but hopefully temporary, downturn in demand as a result of the ongoing COVID-19 outbreak.
EY Price Point: global oil and gas market outlook, Q2 | April 2022EY
The theme for this quarter is rearrangement. The loss, or potential loss, of Russian oil and gas supplies is forcing producers, refiners and traders to rethink the flow of crude oil and refined products from the wellhead to the gas pump in light of sanctions, potential sanctions and the risk of reputational damage. Countries, companies and consumers will all be searching for ways to adapt, and the outcome of the race to bring alternatives to market could alter the global energy landscape for years to come.
It is likely crude oil and LNG prices will remain elevated for some time. The process of diverting Russian oil through countries unwilling to sanction it will take time and there is little indication OPEC members are willing (or able) to increase production to make up for the loss of Russian crude. Spare capacity sat at 3.7 mbpd at the end of 2021, just above where it was in January 2020. Currently, sanctioned Venezuelan and Iranian production (about 3 mbpd below their peak) could fill the gap, but political and commercial obstacles remain. At today’s prices, US shale production is attractive, but the fastest the industry has been able to grow is between 1mbpd and 2mbpd per year. The LNG infrastructure was already stretched before the war in Ukraine and there is little prosect of finding new supplies soon.
As the largest buyer of Russian energy, Europe will be the epicenter. There is a deeply embedded bias there in favor for renewable energy, and the current crisis is certain to result in an all-out effort to accelerate the build-out of wind and solar power. The capacity to add new green energy is limited though by the project pipeline and supply chains for solar panels and wind turbines, and it is likely that much of the shortfall will be made up with the new LNG infrastructure.
EY Price Point: global oil and gas market outlook, Q2 April 2021EY
The theme for this quarter is governed. Apparent market balance at prices that could be sustainable is the product of calculated choices by market leaders and the cooperation of those who follow them. Economics played their customary role as well, with capital scarcity in North America taking about 2 million barrels per day out of the market, about half of the remaining gap in demand. While inventories are close to their pre-COVID-19 levels, there is still uncertainty. The resolution of the pandemic is in sight, but timing is unclear. Vaccine distribution in the US is having an impact but Europe is struggling to contain a third wave of infections. The taps have opened on economic stimulus, but it remains to be seen if policymakers have done enough or if they have overshot the mark.
The shape of the crude oil forward curve has fundamentally changed since the end of the last quarter. In late December of last year, the Brent forward curve was gradually increasing while today, the curve is backwardated. This is a clear sign that the market sees a short-term dynamic that is disconnected from the medium-to-long-term fundamentals. The lasting impact of the COVID-19 pandemic remains to be seen. While many have opined that COVID-19 marks a turning point in energy transition, the IEA recently released a five-year forecast of oil demand that shows steady growth, albeit at rates that are below historical expectations.
Gas markets are a paradox. At the Henry Hub and at LNG destinations, demand grows, investment lags and prices will occasionally attract attention. Traders, so far though, are unconvinced and futures prices don’t indicate imminent scarcity at any link in the value chain.
EY Price Point: global oil and gas market outlookEY
As we close the second quarter of 2020, in most of Europe and Asia, the first (and hopefully last) wave of the COVID-19 crisis appears to be abating. In the parts of the US where the virus hit early, the profile has largely matched Europe’s, while in other parts, the urge to reopen businesses has trumped the desire to contain the virus and uncertainty looms. In the developing world, the crisis has just begun, but without the economic headroom and resources necessary to contain it. As the crisis unfolded, the effect on oil and gas demand has been predictable but difficult to gauge precisely and therefore difficult to manage.
Oil prices have crept up steadily as production has been curtailed through coordinated action (OPEC+) and because of economic reality (unconventional oil in North America). That trend has been subject to momentary spasms when bad news hit the market. It would be understandable if traders were nervous, and it seems that they are. Although nowhere near where it was at the peak of the crisis, option implied volatility is still at historically high levels. Gas markets, without the benefit of coordination on the supply side, continue to deal with the market implications of storage at or near capacity. Interfuel competition in power generation has always provided something of a floor, but those lows have been, and will continue to be, tested.
EY Price Point: global oil and gas market outlook (Q4, October 2020)EY
Oil and gas prices have recovered steadily from their lows and are relatively stable, but that stability is supported by the combination of purposeful withholding of production by oil-producing countries and economic stress on upstream independents. Oil prices closed the quarter roughly where they started it, while refining spreads were down slightly. LNG spreads were substantially higher at the end of Q3 than they were at the beginning of the quarter but are still roughly half of what is generally thought of as sustainable.
Going forward, the market will be looking closely at how the economy and demand respond to new developments with respect to a potential COVID-19 vaccine and the US election.
The theme for this quarter is inorganic. Although prices climbed in the fourth quarter as the balance of supply and demand tilted in favour of demand, OPEC + restraint was fundamental.
The market is conscious of downside pressures that loom. OPEC + has announced production cuts through to the end of the first quarter. Beyond the first quarter, there is a risk that OPEC + grows weary of supporting the market and reverts to a strategy of growing production, protecting market share and placing pressure on the economics of unconventional producers. Production growth in Brazil and Norway has the potential to consume a significant portion of demand growth expected in 2020. Whether, or the extent to which, US shale output growth continues despite escalating financial strain across the E&P sector will be key in determining whether OPEC + cuts will be sufficient to balance the market in 2020.
In the longer-term, focus remains on the energy mix of the future and its impact on the demand for petroleum products. A number of significant uncertainties remain, including electric vehicle (EV) penetration. EY’s ‘Fueling the Future’ analyzes the outlook under four distinct scenarios. The analysis shows that an inflection point in EV penetration is required by 2022 if the terms of the Paris Accord are to be met.
EY Price Point: Global Oil and Gas Market Outlook - Q3EY
The oil and gas sector is constantly changing. Increasingly uncertain energy policies, geopolitical complexities, cost management and climate change all present significant challenges. EY’s Global Oil & Gas Sector supports a global network of more than 10,000 oil and gas professionals with extensive experience in providing assurance, tax, transaction and advisory services across the upstream, midstream, downstream and oil field sub-sectors.
EY Price Point: global oil and gas market outlookEY
The theme for this quarter is resilience. A 6% supply outage in September was unable to push Brent prices above US$70/bbl. Demand concerns, driven by slowing world economic growth and the need to decarbonize, quickly retook the stage despite output from Venezuela and Iran being hindered by political turmoil and international sanctions.
Technology enhancements are a significant contributor to the market’s sanguine attitude towards supply disruption. Operators are able to produce greater volumes, quicker, and at a lower cost. That trend can only continue.
LNG markets continue to mature as traders play an increasing role in directing cargoes and setting prices. The pipeline for LNG projects remains healthy as market participants aim to establish a position in a market that is seen as the best opportunity for growth in oil and gas.
EY Price Point: global oil and gas market outlookEY
The theme for this quarter is reprieve. Crude prices rose steadily throughout 1Q19 as OPEC+ reigned in production to counteract the impact of North American production growth. What lies ahead is uncertain, but downward pressures loom over the marketplace.
Quarterly analyst themes of oil and gas earningsEY
As it almost always is, oil and gas profitability was driven by crude oil, refined product and natural gas market conditions in Q2 2019. Oil prices seesawed, rising steadily during the first half of the quarter, falling during most of the second half of the quarter, before rising again at the end.
EY Price Point: Global oil and gas market outlook Q4 2018EY
A range of upside forces have shifted market sentiment and some parties are talking of $90, or even $100/bbl oil in the short to medium term. Our insights on the outlook for the global oil price in Q4 2018.
Q2 – Analyst Themes of Quarterly Oil & Gas EarningsEY
Most companies reported strong earnings growth in the second quarter, but investors were disappointed. Expectations had risen in line with oil prices and profits, but cash flow generation of some companies fell short of consensus estimates.
Special Report - Is the OPEC Agreement a Game Changer?Amir Khan
Contrary to expectations, OPEC managed to reach an agreement at the sidelines of the Global Energy Forum held in Algiers. But it's too early to say this will be turning for the oil market.
EY Price Point: global oil and gas market outlookEY
As we close the second quarter of 2020, in most of Europe and Asia, the first (and hopefully last) wave of the COVID-19 crisis appears to be abating. In the parts of the US where the virus hit early, the profile has largely matched Europe’s, while in other parts, the urge to reopen businesses has trumped the desire to contain the virus and uncertainty looms. In the developing world, the crisis has just begun, but without the economic headroom and resources necessary to contain it. As the crisis unfolded, the effect on oil and gas demand has been predictable but difficult to gauge precisely and therefore difficult to manage.
Oil prices have crept up steadily as production has been curtailed through coordinated action (OPEC+) and because of economic reality (unconventional oil in North America). That trend has been subject to momentary spasms when bad news hit the market. It would be understandable if traders were nervous, and it seems that they are. Although nowhere near where it was at the peak of the crisis, option implied volatility is still at historically high levels. Gas markets, without the benefit of coordination on the supply side, continue to deal with the market implications of storage at or near capacity. Interfuel competition in power generation has always provided something of a floor, but those lows have been, and will continue to be, tested.
EY Price Point: global oil and gas market outlook (Q4, October 2020)EY
Oil and gas prices have recovered steadily from their lows and are relatively stable, but that stability is supported by the combination of purposeful withholding of production by oil-producing countries and economic stress on upstream independents. Oil prices closed the quarter roughly where they started it, while refining spreads were down slightly. LNG spreads were substantially higher at the end of Q3 than they were at the beginning of the quarter but are still roughly half of what is generally thought of as sustainable.
Going forward, the market will be looking closely at how the economy and demand respond to new developments with respect to a potential COVID-19 vaccine and the US election.
The theme for this quarter is inorganic. Although prices climbed in the fourth quarter as the balance of supply and demand tilted in favour of demand, OPEC + restraint was fundamental.
The market is conscious of downside pressures that loom. OPEC + has announced production cuts through to the end of the first quarter. Beyond the first quarter, there is a risk that OPEC + grows weary of supporting the market and reverts to a strategy of growing production, protecting market share and placing pressure on the economics of unconventional producers. Production growth in Brazil and Norway has the potential to consume a significant portion of demand growth expected in 2020. Whether, or the extent to which, US shale output growth continues despite escalating financial strain across the E&P sector will be key in determining whether OPEC + cuts will be sufficient to balance the market in 2020.
In the longer-term, focus remains on the energy mix of the future and its impact on the demand for petroleum products. A number of significant uncertainties remain, including electric vehicle (EV) penetration. EY’s ‘Fueling the Future’ analyzes the outlook under four distinct scenarios. The analysis shows that an inflection point in EV penetration is required by 2022 if the terms of the Paris Accord are to be met.
EY Price Point: Global Oil and Gas Market Outlook - Q3EY
The oil and gas sector is constantly changing. Increasingly uncertain energy policies, geopolitical complexities, cost management and climate change all present significant challenges. EY’s Global Oil & Gas Sector supports a global network of more than 10,000 oil and gas professionals with extensive experience in providing assurance, tax, transaction and advisory services across the upstream, midstream, downstream and oil field sub-sectors.
EY Price Point: global oil and gas market outlookEY
The theme for this quarter is resilience. A 6% supply outage in September was unable to push Brent prices above US$70/bbl. Demand concerns, driven by slowing world economic growth and the need to decarbonize, quickly retook the stage despite output from Venezuela and Iran being hindered by political turmoil and international sanctions.
Technology enhancements are a significant contributor to the market’s sanguine attitude towards supply disruption. Operators are able to produce greater volumes, quicker, and at a lower cost. That trend can only continue.
LNG markets continue to mature as traders play an increasing role in directing cargoes and setting prices. The pipeline for LNG projects remains healthy as market participants aim to establish a position in a market that is seen as the best opportunity for growth in oil and gas.
EY Price Point: global oil and gas market outlookEY
The theme for this quarter is reprieve. Crude prices rose steadily throughout 1Q19 as OPEC+ reigned in production to counteract the impact of North American production growth. What lies ahead is uncertain, but downward pressures loom over the marketplace.
Quarterly analyst themes of oil and gas earningsEY
As it almost always is, oil and gas profitability was driven by crude oil, refined product and natural gas market conditions in Q2 2019. Oil prices seesawed, rising steadily during the first half of the quarter, falling during most of the second half of the quarter, before rising again at the end.
EY Price Point: Global oil and gas market outlook Q4 2018EY
A range of upside forces have shifted market sentiment and some parties are talking of $90, or even $100/bbl oil in the short to medium term. Our insights on the outlook for the global oil price in Q4 2018.
Q2 – Analyst Themes of Quarterly Oil & Gas EarningsEY
Most companies reported strong earnings growth in the second quarter, but investors were disappointed. Expectations had risen in line with oil prices and profits, but cash flow generation of some companies fell short of consensus estimates.
Special Report - Is the OPEC Agreement a Game Changer?Amir Khan
Contrary to expectations, OPEC managed to reach an agreement at the sidelines of the Global Energy Forum held in Algiers. But it's too early to say this will be turning for the oil market.
The theme for this quarter is apprehension. In September, the US Federal Reserve announced a third 75 basis point increase in the federal funds rate. In the aftermath, the two-year treasury rate reached the highest level since before the 2008 financial crisis and the spread between two and ten-year rates went below negative 50basis points for the first time since the early eighties. Equity markets have begun to price in the likelihood of a recession and, if history is any indication, the impact on oil markets could be profound.
Mercer Capital's Value Focus: Energy Industry | Q1 2020 | Region Focus: Eagle...Mercer Capital
Mercer Capital's Energy Industry newsletter provides perspective on valuation issues. Each newsletter also typically includes macroeconomic trends, industry trends, and guideline public company metrics.
EY Price Point: Global oil and gas market outlook - 1Q19EY
The theme for this quarter is reversal. Following a period of sustained growth throughout the first 10 months of 2018, the oil price recovery began to reverse in the fourth quarter.
New base energy news issue 915 dated 25 august 2016Khaled Al Awadi
Greetings,
Attached FYI (NewBase 25 August 2016 ) , from Hawk Energy Services Dubai . Daily energy news covering the MENA area and related worldwide energy news. In today’s issue you will find news about:-
• LNG IN THE NEW OIL PRICE ERA, By Morten Frisch
• Saudi Arabia Holds China Market Share Lead on Record Oil Output
• China Oil Giants Unmoved by Bull Rally After Worst-Ever Earnings
• Norway's Oil Investments To Fall Again In 2017
• Kenya: Work Begins on 2D Seismic Survey in Wajir Kenya
• Kenya: First Kenyan Oil Due by March 2017; Exports to Follow
• Oil prices fall as market focus returns to global supply overhang
• As Japan and South Korea import less LNG, other Asian countries begin to import more
we would appreciate your actions to send to all interested parties that you may wish. Also note that if you or your organization wish to include your own article or advert in our circulations, please send it to :-
khdmohd@hotmail.com or khdmohd@hawkenergy.net
Best Regards.
Khaled Al Awadi
Energy Consultant & NewBase Chairman - Senior Chief Editor
MS & BS Mechanical Engineering (HON), USA
Emarat member since 1990
ASME meme since 1995
Hawk Energy since 2010
Mercer Capital's Value Focus: Energy Industry | Q2 2019 | Region: Permian BasinMercer Capital
Mercer Capital's Energy Industry newsletter provides perspective on valuation issues. Each newsletter also typically includes macroeconomic trends, industry trends, and guideline public company metrics.
1. July 2015
19
bond-buying. In addition to a US interest rate hike,
possible Greece default of its ECB loan would raise
global risk aversion to EM countries especially those
within Europe, further compounding portfolio outflows
from the region. The reduced risk tolerance should
also impact portfolio flows to countries with high current
account deficit as investors will more likely favour higher
quality investment. Nonetheless, nations with strong
economic outlook, favourable external positions and
credible reform programs should attract strong inflows.
Capital flows to EM Asia is at particular risk of a sharper-
than-expected slowdown in Chinese growth, while capital
flows to Malaysia and Indonesia will likely be impacted
by an interest rate hike in the US as both countries have
large foreign holdings of domestic bonds. Meanwhile,
India’s economic policies should continue to attract
FPI flows to the country. As for the European region,
the debt negotiations in Greece and Ukraine-Russia
crisis should continue to determine direction of capital
flows. Nonetheless, dissipation of political uncertainty
that trailed June parliamentary election in Turkey should
lead to increased inflow to the country. Elsewhere,
Saudi-Arabia’s opening of its equity market to foreigners
should continue to underpin FPI flows to the middle–east
region. In contrast, FPI inflows to Sub-Saharan Africa
will likely remain subdued following slowing economic
growth, political uncertainty, rising current account deficit
and depreciating currencies. However, plans by Ghana,
Tanzania and Kenya to each raise $1 billion Eurobond
could deliver some support. In summary, FPI flows will
remain wary of EM countries with domestic vulnerabilities
such as credit growth and debt burdens, implying portfolio
flows will remain volatile over the rest of 2015.
COMMODITY STABILITY:
INEVITABLE REPRIEVE OR
AWAITING THE NEXT WAVE?
Considering the depths plumbed by commodity prices
in H2 14, it only appears logical that the markets
pause for breath sometime after. Whilst the recurrent
theme of early signs of recovery suggests a floor
is being found, demand supply dynamics remain
broadly bearish for prices and indicate downside risks
may not be fully washed away.
DEAD-CAT BOUNCE
IN OIL MARKET?
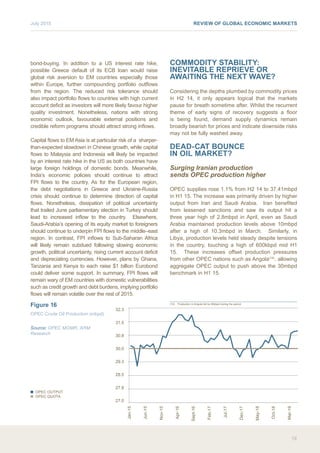
Surging Iranian production
sends OPEC production higher
OPEC supplies rose 1.1% from H2 14 to 37.41mbpd
in H1 15. The increase was primarily driven by higher
output from Iran and Saudi Arabia. Iran benefited
from lessened sanctions and saw its output hit a
three year high of 2.8mbpd in April, even as Saudi
Arabia maintained production levels above 10mbpd
after a high of 10.3mbpd in March. Similarly, in
Libya, production levels held steady despite tensions
in the country, touching a high of 600kbpd mid H1
15. These increases offset production pressures
from other OPEC nations such as Angola(14)
, allowing
aggregate OPEC output to push above the 30mbpd
benchmark in H1 15.
(14) Production in Angola fell by 60kbpd during the period
Figure 16
OPEC Crude Oil Production (mbpd)
Source: OPEC MOMR, ARM
Research
■ OPEC OUTPUT
■ OPEC QUOTA
27.0
27.8
28.5
29.3
30.0
30.8
31.5
32.3
Jan-15
Jun-15
Nov-15
Apr-16
Sept-16
Feb-17
Jul-17
Dec-17
May-18
Oct-18
Mar-19
REVIEW OF GLOBAL ECONOMIC MARKETS
2. July 2015
20
As non-OPEC output shrugs off declines
in parts of North America
Non-OPEC production rose 0.35% to 57.9mbpd in
H1 15 (H2 14: 57.7mbpd) as higher output in the
US, Russia and China—more than offset declines
elsewhere. Interestingly, despite increased idling of
oil rigs in response to depressed oil prices, US
output—still driven by light tight oil—hit a 40 year high
of 9.6mbpd in H1 15 as producers focused on the
cheapest (and highest) yielding shale formations. In
addition, with a large share of shale output hedged
at elevated oil prices, producers were better able
to weather the low oil prices, even as industry
breakevens trended lower. In Russia, output broke
previous threshold levels to reach 11mbpd and China
continued to increase production following the oil spill at
its Penglai field in 2011. Meanwhile, high breakevens
on tar sands played a part in moderating production
in Canada while an explosion at the Pemex’s Abkatun
Permanente platform in the Gulf of Mexico on April 1
weighed on Mexican output. Overall, total crude oil
supply remained relatively flat (+0.6%) at 95.31mbpd
relative to H2 14 and increased 2.93% YoY.
Demand slows relative to H2 14
but improves YoY
Global demand in H1 15 shrank 0.64% from H2 14
to 92.85mbpd, but increased 1.33% YoY, with lower
oil prices positively impacting car sales in Europe
and US. With lower transportation costs, Europe’s
oil demand growth hit a twenty year peak of 3.9%
YoY in Q1 15 and in the US, auto sales hit a 13 year
high at 17.79 million with pickup trucks and SUVs
making up a majority of the gains. Asian regions
mainly followed the path led by Europe and US, with
India’s demand for crude oil peaking at 4.2mbpd,
benefiting from a combination of strong economic
growth and lower oil prices. Meanwhile, China’s
demand rose as the government increased offshore
and onshore reserves and was further bolstered by
increase in diesel oil for infrastructure projects. In
contrast, demand in Japan decreased as the country
moved away from dependency on fuel and crude oil to
alternatives such as natural gas, whereas in Mexico,
oil demand fell due to the decreased use of fuel oil
in the power sector. Nonetheless, the increase in
demand on a global front was not enough to narrow
the excess supply which increased 97% from H2 14 to
2.46mbpd (H1 14: 095mbpd).
Figure 17
Supply – Demand gap (mbpd)
Source: US IEA, ARM ; **2015-Q2
includes April and May.
■ BALANCE (RHS)
■ SUPPLY
■ DEMAND
-3.00
-2.00
-1.00
0.00
1.00
2.00
3.00
4.00
80.00
82.00
84.00
86.00
88.00
90.00
92.00
94.00
96.00
98.00
2010-Q2
2010-Q3
2010-Q4
2011-Q1
2011-Q2
2011-Q3
2011-Q4
2012-Q1
2012-Q2
2012-Q3
2012-Q4
2013-Q1
2013-Q2
2013-Q3
2013-Q4
2014-Q1
2014-Q2
2014-Q3
2014-Q4
2015-Q1
2015-Q2
REVIEW OF GLOBAL AND ECONOMIC MARKETS
3. July 2015
21
Despite the persisting oversupply, oil prices inched
higher in H1 15 after bottoming at $53.52/bbl in
January, for Brent Crude. In many ways, the recovery
reflected a bet that oil would rebound from the sharp
fall in H2 14 with money managers, in particular,
maintaining their bullish outlook on rising oil prices
by increasing their net long positions by 39% from
H2 14 to 222,357 lots as at May 2015. The steady
spread between Brent Crude and WTI Crude over H1
15, at an average of $6.37/bbl, suggests the positive
sentiment was broad-based and non-sensitive to the
supply vagaries in diverse regions. In contrast, the
premium typically enjoyed by Nigerian Bonny light
over Brent crude collapsed to become a $0.06/bbl
discount in H1 15 (H2 14: +$0.46) with implications
for domestic revenues.
Figure 18
Crude Oil Prices (US$)
Source: Bloomberg
■ BRENT CRUDE
■ WTI CRUDE
40
50
60
70
80
2-Dec-14
23-Dec-14
15-Jan-15
6-Feb-15
28-Feb-15
21-Mar-15
14-Apr-15
5-May-15
27-May-15
17-Jun-15
Figure 19
Nigeria Bonny Light – Brent Crude
discount (US $)
Source: CBN, Bloomberg,
ARM Research
■ NIGERIA BONNY LIGHT - BRENT
CRUDE DISCOUNT
-6.00
-4.00
-2.00
0.00
2.00
4.00
6.00
8.00
Jan-2009
Jul-2009
Jan-2010
Jul-2010
Jan-2011
Jul-2011
Jan-2012
Jul-2012
Jan-2013
Jul-2013
Jan-2014
Jul-2014
Jan-2015
REVIEW OF GLOBAL ECONOMIC MARKETS
4. July 2015
22
Iran and new shale dynamics could
boost supply further
Going into H2 15, OPEC is likely to boost crude
oil production in a bid to maintain its market
share even as the date set to resolve the issue
on Iranian sanctions approaches(15)
. As Iran waits
on the decision, it currently has 30mb of crude
on tankers(16)
, waiting to be shipped should the
(15) The initial deadline was June 30th and was extended to July 10th. At that meeting, a deal has been
reached which would allow Iran to slowly release its crude oil into the market.
(16) IEA Report
sanction be lifted. Evidently, the recent 3-year
high could easily be surpassed and we expect
production to increase by 1mbpd over the next 8 to
12 months. Similar expectations are attached to US
crude oil production, given the prolonged cutback in
rig counts did not appear to interfere with further
production rises. However, this partly reflected the
usual lag (~23 weeks) between when rig counts fall
and the impact on crude oil production materializes,
similar to the pattern in 2008 when production
levels initially rose slightly before tempering.
Nonetheless, as oil rig counts broke their 29 week
decline in July, factors other than the lag suggest
recent production gains might not be so fleeting.
First and foremost, while the widely accepted ~$80/
bbl breakeven for shale oil had been central to
expectations that shale production will wilt after
the crash, more recent indications are that shale
production is sustainable at as low as $60/bbl. The
lower breakeven prices stemmed from technological
advancements by shale producers as they moved
away from less efficient to more efficient oil wells
and rigs, implying more is being done with less. In
addition, producers reduced labor costs, allowing
some key players to slowly return to the market.
This is not to say that the impact of oil price
crash has not materialized at all; however in-the-
money hedges supported cash flows and provided
operations lifelines(17)
. Nonetheless, with high debt
levels, little chance of recreating similarly profitable
hedges and likely financing challenges for smaller
fields imply that the reprieve might be temporary,
as five shale companies declared bankruptcy in this
same period of overall improvement in production.
Hence, the key takeaway is that aggregate prognosis
for shale producers appear better than initially
feared with a couple of other factors boosting the
central support from lower breakevens. In all, whilst
lagged rig count impact means production will likely
fall by Q4 15 in the US, it will likely regain traction
in H2 16 as shale producers adapt to the low priced
(17) SandRidge Energy Inc. for example earned 64% of its revenue from payments from this insurance
hedge which guaranteed minimum prices of $90/bbl
Figure 20
US oil rig counts against US Crude
Oil production (kbpd)
Source: US EIA, Baker Hughes.
■ CRUDE OIL PRODUCTION (TBPD)
■ OIL RIG COUNTS - RHS
100
300
500
700
900
1,100
1,300
1,500
1,700
0
2000
4000
6000
8000
10000
12000
10-Oct-08
10-Apr-09
10-Oct-09
10-Apr-10
10-Oct-10
10-Apr-11
10-Oct-11
10-Apr-12
10-Oct-12
10-Apr-13
10-Oct-13
10-Apr-14
10-Oct-14
10-Apr-15
REVIEW OF GLOBAL AND ECONOMIC MARKETS
5. July 2015
23
oil environment, with breakevens expected to fall
further as a result of technological improvements.
Whilst OPEC and, in particular, Saudi Arabia’s
strategy might impair the least efficient producers,
in conjunction with likely on-streaming of Iranian
output we envisage aggregate supply will remain
elevated going forward.
Even as demand hotspots cool off
Despite revisions to its projected growth, China
overtook the US as the world’s largest oil importer
in May 2015 as it continued to build reserves during
H1 15. Whilst we expect demand to increase in
China, we believe the rate of increase will slow, due
to the difficulties the country faces as it changes the
structure of its economy to be more consumption
driven vs. investment driven. Similarly in Europe,
the tensions in Greece following its default on its
IMF loan could result in a ripple effect across the
continent’s economy, thereby weighing negatively
on demand. However, like China we only expect
the rate of increase in demand to slow the extension
of low oil prices and the peak driving season in
the summer months providing support. In India,
which recently passed Japan as the third largest oil
importer in the world(18)
even as it also surpassed
China as the world’s fastest growing economy, the
uptrend in economic growth is expected to continue
into H2 15. This positive growth would support
demand as the country continues investments in
infrastructure and refineries.
Competition for market share will
extend excess supply into H2 15
The competition for market share in H2 15 could
widen the excess supply gap as OPEC pushes
crude production levels higher and shale producers
become more efficient in extracting their product.
Whilst the potential boost to supply from shale
could be short-lived, based on reports that indicate
conventional oil fields depreciates by 2%-5% (life
can average 100 years) following the first year
of production, compared with shale fields could
depreciate up to 70% YoY (life can average 3-30
years). The development of new fracking methods
which essentially extend the well life means this
is another layer of the fabric expected to smother
shale output fraying away. At the very least, shale
(18) In June 2015
supply boost should continue into H1 17 and
possibly beyond if mergers & acquisitions come
back on the table. Earlier M&A expectations largely
failed to pan out because most companies were
valued using oil prices above $90/bbl based on
the higher oil prices. With the expected regime of
prolonged depression in oil prices, it is logical to
expect valuations to compress in tandem, allowing
M&A plans to resume possibly as early as H1 16.
This should in turn fuel the competition for market
share, drive the exploitation of scale and ultimately
keep oil supply flowing. The weather forecast adds
to the gloom. In H1 15, in addition to higher car
sales, increased demand was aided by the longer
and colder-than-expected winter season. Given the
shorter winter season in H2 15 relative to H1 15,
demand could be even weaker and further weigh
negatively on prices. Accordingly, we expect oil
prices to resume declines in H2 15 possibly back to
the January lows of $40-$45/bbl.
SOFT COMMODITIES POST
FLEDGLING RESISTANCE ON
NARROWER GLUTS
The decline in commodity prices that began four
years ago continued into Q1 2015, however,
prices rallied through the second quarter with
both the Jefferies CRB and S&P GCSI indices
slightly up at 1.7% and 2.8% respectively in the
first half of 2015(-27.2% and -34.3% YoY). Upon
closer examination, the uptick appears driven by
recovering soft commodity and energy prices, with
the SPGCSI Agriculture and Energy sub-indices
up 1.3% and 11.7% respectively, in the first half
of 2015. Generally speaking, prices remained at
relative lows, driven by a persistent supply glut
cutting across most commodities, and exacerbated
by relatively weaker global demand. On the whole
grain prices have been the most affected by the
supply overhang. Wheat output has exceeded
consumption again in H1 15, further weakening its
price, while falling Barley output has helped it find
some support. Sugar and Crude Palm Oil (CPO)
prices have also shown resilience in the first half of
the year and look promising for the remainder of it.
REVIEW OF GLOBAL ECONOMIC MARKETS