SlideShare a Scribd company logo
1 of 11
Download to read offline
21 July 2017
MARKET ANALYTICS AND
SCENARIO FORECASTING UNIT
JOHN LOOS:
HOUSEHOLD AND PROPERTY
SECTOR STRATEGIST
087-328 0151
john.loos@fnb.co.za
LIZE ERASMUS
STATISTICIAN
087-335 6664
lize.erasmus@@fnb.co.za
The information in this publication is
derived from sources which are regarded
as accurate and reliable, is of a general
nature only, does not constitute advice
and may not be applicable to all
circumstances. Detailed advice should be
obtained in individual cases. No
responsibility for any error, omission or
loss sustained by any person acting or
refraining from acting as a result of this
publication is accepted by Firstrand Group
Limited and / or the authors of the
material.
First National Bank – a division of FirstRand Bank
Limited. An Authorised Financial Services
provider. Reg No. 1929/001225/06
PROPERTY BAROMETER
FNB Gauteng Sub-Region House Price Indices
Major Gauteng residential regions still showing general
affordability improvements as real prices decline. Clear
patterns when comparing sub-regional performances are
difficult to identify at present.
Our 2nd
quarter 2017 Gauteng Sub-Regional House Price Indices continue to
show rates of growth below general economy-wide consumer inflation,
pointing to ongoing price decline in real terms (when adjusted for
consumer price inflation), and likely improvement in housing affordability
when considering house price inflation relative to income inflation.
THE BROAD GAUTENG METRO PICTURE
Using Deeds Office Data, we construct a set of house price indices for key
sub-regions within the province of Gauteng, the aim being to evaluate this
regional housing market’s performance in more detail.
We have then rolled up this set of sub-regions into overall house price
indices for each major metropolitan council region as well as for each district
municipal region in those areas outside of Gauteng’s 3 metros.
All 3 of Gauteng’s major metros continue to show low single-digit house
price growth.
In the 2nd
quarter of 2017, the City of Tshwane’s estimated average house
price growth rate was 4.48% year-on-year, by a small margin stronger than
Ekurhuleni’s 3.71% and City of Joburg’s 3.31%.
REAL HOUSE PRICE PERFORMANCES
With Gauteng Consumer Price Index (CPI)
Inflation at 5.2% year-on-year for the 2nd
quarter of 2017, these low nominal house price
growth rates translate into house price declines
in real terms (when adjusted for CPI), Tshwane
to the tune of -1.8% year-on-year, Ekurhuleni
-1.4% and Joburg -1.8%.
The 3 Gauteng Metros have been undergoing a
gradual real house price correction for much of
the time since the beginning of 2008.
Since the 1st
quarter of 2008, Tshwane’s
cumulative real house price decline has been
-22.7%, Joburg -23.6% and Ekurhuleni 25.9%.
AFFORDABILITY IMPROVEMENTS CONTINUE TO BE WITNESSED IN A GOOD MARKET BALANCE AND STRONG
RATES OF NEW ENTRY TO GAUTENG MARKETS BEING ACHIEVED
Ongoing real house price “correction” in the Gauteng Metros is contributing positively to a heathy balance
between demand and supply of housing, and relative ease of entry for 1st
time buyers compared to certain other
major regions.
Both the Tshwane and Joburg regions
(“Joburg” in the FNB Estate Agent Survey
referring to City of Joburg as well as
Ekurhuleni) continued to show estimated
levels of 1st
time home buying to be above the
national average. For the 1st
2 quarters of
2017, 1st
time buyers were estimated at
28,58% of total home buying in Greater
Joburg, and 21.8% in Tshwane, the National
Average being slightly lower at 21%.
1st
time home buyers are on average more
financially constrained than the more
established repeat home buyers, and thus very
sensitive to home affordability levels.
For the 1st
2 quarters of 2017, Joburg and
Tshwane also had the highest percentages of
1st
time home buyers of the major metros.
The recent years of real house price
decline/improving affordability in the Gauteng
Metros appears to have been a key positive for
these 1st
time buyers.
In the 2nd
quarter of 2017, Gauteng’s Estate
Agent Survey sample estimated average time
of homes on the market prior to sale to be
around 12 weeks, having remained near to
that level through most of 2016/17.
This is a good level compared to the average
time on the market for the 3 coastal metros,
Ethekwini, Nelson Mandela Bay and Cape
Town, whose average has risen noticeably to
20 weeks and 3 days.
Greater Joburg at 12.86 weeks and Tshwane at
9.57 weeks had the 2 lowest average times on
the market of the major South African metro
regions, Cape Town with a significantly longer
16.21 weeks, Mandela Bay on 16.29 weeks
and Ethekwini on 20.93 weeks.
WE ZOOM IN ON THE CITY OF JOBURG’S MAIN REGIONS….IS THE ECONOMY BEGINNING TO BITE LOW INCOME
REGIONS TOO? NEITHER HIGHEST NOR LOWEST PRICED ENDS APPEAR TO “OUTPERFORM”
An interesting aspect observed in certain of the Gauteng data is that the lowest income regions may no longer be
the best performing. Over the past 5 years, the region within Joburg with the highest cumulative house price
growth has been the Diepkloof-Soweto-Meadowlands-Pimville Region, with 35.67% growth from the 2nd
quarter
of 2012 to the 2nd
quarter of 2017. This is historically one of the country’s major Apartheid era “Black Township”
regions, and is on average the cheapest of our City of Joburg sub-regions.
But more recently, this region appears to have become an underperformer, showing slight average house price
deflation to the tune of -1.16% year-on-year in the 2nd
quarter of 2017. Also noteworthy is that the highest priced
“Sandton and Surrounds”, the highest average value sub-region, is also in the doldrums, inflating by a mere
0.54%.
TSHWANE – NEITHER THE HIGHEST NOR THE LOWEST PRICED REGIONS ARE THE STRONGEST HERE EITHER
In Tshwane, we see something similar to City of Joburg in that over the past 5 years it has been the lowest
income/priced Winterveldt-Mabopane-Soshanguve-Ga-Rankuwa-Hammanskraal region, a mix of former
Apartheid Era “Black Townships” and Bophutatswana Homeland areas, that has shown the highest price inflation
in Tshwane region to the tune of 41.07%. Admittedly, in such regions there may be some price inflation
distortions with subsidized housing not always registered in deeds offices at market price.
But, as in the case of the Soweto region in Johannesburg, this region had the weakest estimated house price
growth in the 2nd
quarter of 2017, to the tune of a negative -0.76%. Like Joburg, too, the highest priced Pretoria
East and Centurion sub-regions were also not superior performers, recording 4.42% and 4.68% year-on-year price
growth respectively in the 2nd
quarter of 2017. Pretoria North East with 12.32% and Pretoria West regions had the
fastest house price growth in the quarter.
EKURHULENI SUB-REGION PERFORMANCE
Patterns are a little more difficult to identify in Ekurhuleni, but once again it is neither the highest or the lowest
priced sub-regions that were the top performers recently.
Here too we do find that the lowest priced sub-regions are some of the weakest in terms of house price growth.
The major Tokoza-Vosloorus-Katlehong “Former Township” region showed low (and below the metro average)
year-on-year price growth of 1% in the 2nd
quarter of 2017, while Nigel, the region with the 2nd
lowest average
price showed deflation of -0.78%.
On the high priced end within Ekurhuleni, we had Alberton, the highest priced sub-region, showing 3.82% year-
on-year house price growth, Kempton Park, the 2nd
most expensive region, showing 4.05%, and Edenvale, the 3rd
most expensive region, recording a small 0.37% positive growth rate.
Best performers were certain of those priced somewhere in the middle, namely Brakpan with +12.98% year-on-
year growth and Germiston with +7.25%, some of the more affordable regions but not the cheapest in Ekurhuleni.
BUT THE MOST DEPRESSED MARKET APPEARS TO BE DOWN ON THE VAAL IN THE HEAVILY MANUFACTURING-
DEPENDENT REGION OF EMFULENI DISTRICT MUNICIPALITY
The Emfuleni District, which includes major towns of Van der Bijl Park and Vereeniging, is heavily Manufacturing
dependent, and the Manufacturing Sector in South Africa has been “below par” for some years. Van der Bijl Park
sees 32.3% of its GDP (Gross Domestic Product) coming from Manufacturing according to IHS Markit estimates,
the highest percentage of any major town in Gauteng.
Perhaps not surprisingly, therefore, Emfuleni Municipal Area has seen its 5-year cumulative house price growth
underperform the 3 Gauteng Metros, recording only 18.75% growth in total since the 2nd
quarter of 2012.
And as at the 2nd
quarter of 2017, the region’s year-on-year percentage change was a negative -2.76%, with the
Manufacturing-heavy Van der Bijl Park seeing house price deflation of -4.08%, and the Low Income Evaton-
Sebokeng “former townships” deflating by -3.67%.
Vereeniging, less Manufacturing-heavy than Van der Bijl (Manufacturing in Vereeniging a lesser 18.8% of its GDP),
still saw moderate price growth of +3.56%.
MAIN CONCLUSION
Although the trends and patterns emanating from Gauteng sub-regions are not strong ones at present, we believe
that the message emanating from the 3 Gauteng Metros Sub-Region House Price Indices is that the most recent
sweetspot is neither at the highest or the lowest-priced end, but somewhere in the “relatively affordable” middle
where new middle class entrants probably like to buy.
For the low income groups, South Africa’s almost zero growth economy may be starting to bite in terms of a lack
of new job creation and income growth, which may mean that the lowest priced regions, many which would be
former “Townships”, have weakened more noticeably in terms of average price growth.
At the high priced end in each metro, on the other hand, confidence in the country’s economic future can be a
reason for buyer caution amongst higher income groups, while it is also arguably about the high running and
transaction costs related to higher value homes that comes with municipal rates and tariffs rising at rates well-
above general inflation in recent years, and higher transfer duty brackets at the high end.
Down in the Vaal Regions, the Manufacturing-dependent Emfuleni District appears to be the weakest housing
region in Gauteng of late.
HOUSE PRICE GROWTH SUMMARY TABLES
Q3-2016 Q4-2016 Q1-2017 Q2-2017
Cumulative 15-
year growth
Cumulative 5-
year growth
CITY OF JOHANNESBURG TOTAL 4.25% 3.73% 3.43% 3.31% 266.96% 22.86%
Johannesburg 4.62% 4.48% 4.23% 3.70% 304.38% 21.19%
Johannesburg South 4.99% 4.41% 3.49% 2.59% 283.71% 20.02%
Diepkloof_Soweto_Meadowlands_Pimville 5.28% 3.80% 1.53% -1.16% 799.48% 35.67%
Midrand_Diepsloot 5.07% 4.69% 4.28% 3.77% 265.53% 27.19%
Randburg 4.23% 3.83% 3.66% 3.83% 211.35% 20.72%
Roodepoort 2.74% 2.11% 2.20% 2.92% 213.19% 19.29%
Sandton and Surrounds 3.10% 2.31% 1.45% 0.54% 182.30% 18.98%
Lenasia - Orange Farm - Ennerdale - Lawley 5.52% 5.08% 6.53% 8.43% 407.32% 23.55%
Quarterly year-on-year percentage change
Q3-2016 Q4-2016 Q1-2017 Q2-2017
Cumulative 15-
year growth
Cumulative 5-
year growth
CITY OF TSHWANE ROLL UP 4.35% 4.35% 4.40% 4.48% 244.23% 28.93%
Akasia 1.74% 1.37% 1.17% 1.30% 260.13% 19.60%
Bronkhorstspruit-Cullinan-
Rayton-Ekangala-Refilwe
2.59% 3.94% 5.92% 8.82% 322.26% 24.04%
Centurion 5.43% 5.05% 4.85% 4.68% 210.70% 30.47%
Pretoria-Roodeplaat 3.69% 4.25% 5.02% 5.80% 226.39% 27.73%
Winterveldt-Mabopane-
Soshanguve-GaRankuwa-
Hammanskraal-Kudube-
Themba
12.92% 9.38% 4.03% -0.76% 504.03% 41.07%
Pretoria Central 1.00% 2.86% 5.21% 7.24% 375.11% 23.35%
Pretoria East 5.80% 5.34% 4.82% 4.42% 191.43% 28.83%
Pretoria North 2.41% 3.23% 4.20% 5.00% 224.49% 23.51%
Pretoria North East 4.27% 5.61% 8.50% 12.32% 326.88% 34.64%
Pretoria South East -2.13% -0.87% 0.53% 0.84% 222.56% 26.23%
Pretoria West 4.72% 5.56% 8.12% 10.86% 439.11% 40.42%
PRETORIA ROLL UP 3.69% 4.32% 5.29% 6.30% 254.44% 29.77%
Quarterly year-on-year percentage change
CITY OF TSHWANE SUB-REGIONAL HOUSE PRICE INDICES – AVERAGE GROWTH RATES
Q3-2016 Q4-2016 Q1-2017 Q2-2017
Cumulative 15-
year growth
Cumulative 5-
year growth
EKURHULENI ROLL UP 4.22% 4.03% 3.81% 3.71% 301.10% 24.07%
Alberton 1.33% 2.15% 3.14% 3.82% 252.14% 18.13%
Benoni 3.54% 2.79% 1.82% 1.50% 221.14% 14.99%
Boksburg 3.59% 3.37% 2.72% 2.35% 238.12% 18.45%
Brakpan 5.11% 7.23% 9.97% 12.98% 361.15% 38.56%
Edenvale 1.77% 1.12% 0.77% 0.37% 229.82% 18.15%
Germiston 3.30% 4.51% 5.94% 7.25% 285.27% 24.07%
Kempton Park 4.03% 4.35% 4.45% 4.05% 278.68% 21.68%
Nigel 8.56% 6.38% 2.59% -0.78% 368.21% 16.64%
Olifantsfontein 11.91% 5.55% 2.21% -0.84% 1113.06% 49.36%
Springs 3.52% 3.05% 3.13% 3.47% 337.32% 28.89%
Tokoza_Voloorus_Katlehong 2.50% 2.23% 1.71% 1.00% 718.78% 32.81%
Quarterly year-on-year percentage change
CITY OF EKURHULENI SUB-REGIONAL HOUSE PRICE INDICES – AVERAGE GROWTH RATES
Q3-2016 Q4-2016 Q1-2017 Q2-2017
Cumulative 15-
year growth
Cumulative 5-
year growth
EMFULENI 5.03% 3.84% 1.07% -2.76% 352.36% 18.75%
Evaton - Sebokeng 13.23% 12.00% 6.20% -3.67% 551.45% 44.47%
Vaal - Vanderbijlpark 2.67% 1.78% -0.67% -4.08% 337.22% 12.40%
Vereeniging 2.67% 3.35% 3.80% 3.56% 325.69% 22.33%
Quarterly year-on-year percentage change
Q3-2016 Q4-2016 Q1-2017 Q2-2017
Cumulative 15-
year growth
Cumulative 5-
year growth
MOGALE CITY 2.39% 2.37% 3.24% 4.56% 271.34% 24.98%
Krugersdorp_Magaliesburg_Mogale 3.36% 3.69% 4.40% 5.19% 248.08% 26.12%
Randfontein -1.06% -0.15% 2.14% 4.64% 276.15% 18.32%
Quarterly year-on-year percentage change
Q3-2016 Q4-2016 Q1-2017 Q2-2017
Cumulative 15-
year growth
Cumulative 5-
year growth
LESEDI 4.29% 0.95% -1.86% -4.10% 266.30% 9.71%
MERAFONG 8.99% 6.32% 4.91% 6.30% 334.45% 15.51%
MIDVAAL 1.29% 2.42% 5.25% 8.44% 354.76% 33.21%
WESTONARIA 6.85% 11.46% 14.36% 14.31% 517.72% 36.01%
Quarterly year-on-year percentage change

More Related Content

What's hot

Annie WilliamsMarket Trends Apr-May 2014
Annie WilliamsMarket Trends Apr-May 2014Annie WilliamsMarket Trends Apr-May 2014
Annie WilliamsMarket Trends Apr-May 2014Jon Weaver
 
September market seminar
September market seminarSeptember market seminar
September market seminarWeichert Realtors
 
U.S. House Prices Rose 1.9 Percent in First Quarter 2013
U.S. House Prices Rose 1.9 Percent in First Quarter 2013U.S. House Prices Rose 1.9 Percent in First Quarter 2013
U.S. House Prices Rose 1.9 Percent in First Quarter 2013Wealth Partners
 
FNB_House Price Index_January 2018
FNB_House Price Index_January 2018FNB_House Price Index_January 2018
FNB_House Price Index_January 2018Berty Van Staaden
 
Recovery Continues - The Real Estate Report April/May
Recovery Continues - The Real Estate Report April/MayRecovery Continues - The Real Estate Report April/May
Recovery Continues - The Real Estate Report April/MayAMSI, San Francisco
 
Risks to China Outlook Intensify
Risks to China Outlook IntensifyRisks to China Outlook Intensify
Risks to China Outlook IntensifyHayden Briscoe
 
Complex Multiplier Pakistan
Complex Multiplier PakistanComplex Multiplier Pakistan
Complex Multiplier PakistanFJeconomist
 
Big Island Real Esate Report-january-31-2013 Statistics, Trends, Sales, Kona
Big Island Real Esate Report-january-31-2013 Statistics, Trends, Sales, KonaBig Island Real Esate Report-january-31-2013 Statistics, Trends, Sales, Kona
Big Island Real Esate Report-january-31-2013 Statistics, Trends, Sales, KonaEric West
 
SRA Market Update - April 2020
SRA Market Update - April 2020SRA Market Update - April 2020
SRA Market Update - April 2020NoelGeremia
 

What's hot (11)

Annie WilliamsMarket Trends Apr-May 2014
Annie WilliamsMarket Trends Apr-May 2014Annie WilliamsMarket Trends Apr-May 2014
Annie WilliamsMarket Trends Apr-May 2014
 
September market seminar
September market seminarSeptember market seminar
September market seminar
 
Q1 2017 Houston Retail Research & Forecast Report
Q1 2017 Houston Retail Research & Forecast ReportQ1 2017 Houston Retail Research & Forecast Report
Q1 2017 Houston Retail Research & Forecast Report
 
U.S. House Prices Rose 1.9 Percent in First Quarter 2013
U.S. House Prices Rose 1.9 Percent in First Quarter 2013U.S. House Prices Rose 1.9 Percent in First Quarter 2013
U.S. House Prices Rose 1.9 Percent in First Quarter 2013
 
FNB_House Price Index_January 2018
FNB_House Price Index_January 2018FNB_House Price Index_January 2018
FNB_House Price Index_January 2018
 
Recovery Continues - The Real Estate Report April/May
Recovery Continues - The Real Estate Report April/MayRecovery Continues - The Real Estate Report April/May
Recovery Continues - The Real Estate Report April/May
 
Risks to China Outlook Intensify
Risks to China Outlook IntensifyRisks to China Outlook Intensify
Risks to China Outlook Intensify
 
December 2018 Realtor Report
December 2018 Realtor ReportDecember 2018 Realtor Report
December 2018 Realtor Report
 
Complex Multiplier Pakistan
Complex Multiplier PakistanComplex Multiplier Pakistan
Complex Multiplier Pakistan
 
Big Island Real Esate Report-january-31-2013 Statistics, Trends, Sales, Kona
Big Island Real Esate Report-january-31-2013 Statistics, Trends, Sales, KonaBig Island Real Esate Report-january-31-2013 Statistics, Trends, Sales, Kona
Big Island Real Esate Report-january-31-2013 Statistics, Trends, Sales, Kona
 
SRA Market Update - April 2020
SRA Market Update - April 2020SRA Market Update - April 2020
SRA Market Update - April 2020
 

Similar to FNB_Gauteng HPI_Jul 2017

FNB_Gauteng Sub-Region House Price Indices
FNB_Gauteng Sub-Region House Price IndicesFNB_Gauteng Sub-Region House Price Indices
FNB_Gauteng Sub-Region House Price IndicesBerty Van Staaden
 
FNB 2017 House Price Index Performance
FNB 2017 House Price Index PerformanceFNB 2017 House Price Index Performance
FNB 2017 House Price Index PerformanceBerty Van Staaden
 
FNB_AREA VALUE BAND HOUSE PRICE INDEX
FNB_AREA VALUE BAND HOUSE PRICE INDEXFNB_AREA VALUE BAND HOUSE PRICE INDEX
FNB_AREA VALUE BAND HOUSE PRICE INDEXBerty Van Staaden
 
FNB_Provincial and Major Metro House Price Indices
FNB_Provincial and Major Metro House Price IndicesFNB_Provincial and Major Metro House Price Indices
FNB_Provincial and Major Metro House Price IndicesBerty Van Staaden
 
FNB House Price Index_Sept 2017
FNB House Price Index_Sept 2017FNB House Price Index_Sept 2017
FNB House Price Index_Sept 2017Berty Van Staaden
 
FNB_Residential Demand Conditions_1st Time Home Buying
FNB_Residential Demand Conditions_1st Time Home BuyingFNB_Residential Demand Conditions_1st Time Home Buying
FNB_Residential Demand Conditions_1st Time Home BuyingBerty Van Staaden
 
FNB_House Price Index_Nov 2017
FNB_House Price Index_Nov 2017FNB_House Price Index_Nov 2017
FNB_House Price Index_Nov 2017Berty Van Staaden
 
FNB_Residential Maintenance and Upgrades
FNB_Residential Maintenance and UpgradesFNB_Residential Maintenance and Upgrades
FNB_Residential Maintenance and UpgradesBerty Van Staaden
 
FNB_Estate Agent Survey
FNB_Estate Agent SurveyFNB_Estate Agent Survey
FNB_Estate Agent SurveyBerty Van Staaden
 
FNB Residential Building Stats_Q2 2019
FNB Residential Building Stats_Q2 2019FNB Residential Building Stats_Q2 2019
FNB Residential Building Stats_Q2 2019Berty Van Staaden
 
FNB_Property Insights_Retail Property's Consumer Challenges
FNB_Property Insights_Retail Property's Consumer ChallengesFNB_Property Insights_Retail Property's Consumer Challenges
FNB_Property Insights_Retail Property's Consumer ChallengesBerty Van Staaden
 
FNB_Property Barometer - September
FNB_Property Barometer - SeptemberFNB_Property Barometer - September
FNB_Property Barometer - SeptemberBerty Van Staaden
 
Lightstone Residential Property Indices_December 2017
Lightstone Residential Property Indices_December 2017Lightstone Residential Property Indices_December 2017
Lightstone Residential Property Indices_December 2017Berty Van Staaden
 
FNB Residential Property Monthly March
FNB Residential Property Monthly MarchFNB Residential Property Monthly March
FNB Residential Property Monthly MarchBerty Van Staaden
 
FNB Residential Property Monthly_March
FNB Residential Property Monthly_MarchFNB Residential Property Monthly_March
FNB Residential Property Monthly_MarchBerty Van Staaden
 
FNB_House Price Indices by Segment
FNB_House Price Indices by SegmentFNB_House Price Indices by Segment
FNB_House Price Indices by SegmentBerty Van Staaden
 
Market report q3 2021 fin
Market report q3 2021 finMarket report q3 2021 fin
Market report q3 2021 finTMS_Consultancy
 
New Homes Residential View - Autumn/Winter 2016
New Homes Residential View - Autumn/Winter 2016New Homes Residential View - Autumn/Winter 2016
New Homes Residential View - Autumn/Winter 2016Lee Layton
 

Similar to FNB_Gauteng HPI_Jul 2017 (20)

FNB_Gauteng Sub-Region House Price Indices
FNB_Gauteng Sub-Region House Price IndicesFNB_Gauteng Sub-Region House Price Indices
FNB_Gauteng Sub-Region House Price Indices
 
FNB 2017 House Price Index Performance
FNB 2017 House Price Index PerformanceFNB 2017 House Price Index Performance
FNB 2017 House Price Index Performance
 
FNB_AREA VALUE BAND HOUSE PRICE INDEX
FNB_AREA VALUE BAND HOUSE PRICE INDEXFNB_AREA VALUE BAND HOUSE PRICE INDEX
FNB_AREA VALUE BAND HOUSE PRICE INDEX
 
FNB_Provincial and Major Metro House Price Indices
FNB_Provincial and Major Metro House Price IndicesFNB_Provincial and Major Metro House Price Indices
FNB_Provincial and Major Metro House Price Indices
 
FNB House Price Index_Sept 2017
FNB House Price Index_Sept 2017FNB House Price Index_Sept 2017
FNB House Price Index_Sept 2017
 
FNB_House Price Index
FNB_House Price IndexFNB_House Price Index
FNB_House Price Index
 
FNB_Residential Demand Conditions_1st Time Home Buying
FNB_Residential Demand Conditions_1st Time Home BuyingFNB_Residential Demand Conditions_1st Time Home Buying
FNB_Residential Demand Conditions_1st Time Home Buying
 
FNB_House Price Index_Nov 2017
FNB_House Price Index_Nov 2017FNB_House Price Index_Nov 2017
FNB_House Price Index_Nov 2017
 
FNB HPI March 2017
FNB HPI March 2017FNB HPI March 2017
FNB HPI March 2017
 
FNB_Residential Maintenance and Upgrades
FNB_Residential Maintenance and UpgradesFNB_Residential Maintenance and Upgrades
FNB_Residential Maintenance and Upgrades
 
FNB_Estate Agent Survey
FNB_Estate Agent SurveyFNB_Estate Agent Survey
FNB_Estate Agent Survey
 
FNB Residential Building Stats_Q2 2019
FNB Residential Building Stats_Q2 2019FNB Residential Building Stats_Q2 2019
FNB Residential Building Stats_Q2 2019
 
FNB_Property Insights_Retail Property's Consumer Challenges
FNB_Property Insights_Retail Property's Consumer ChallengesFNB_Property Insights_Retail Property's Consumer Challenges
FNB_Property Insights_Retail Property's Consumer Challenges
 
FNB_Property Barometer - September
FNB_Property Barometer - SeptemberFNB_Property Barometer - September
FNB_Property Barometer - September
 
Lightstone Residential Property Indices_December 2017
Lightstone Residential Property Indices_December 2017Lightstone Residential Property Indices_December 2017
Lightstone Residential Property Indices_December 2017
 
FNB Residential Property Monthly March
FNB Residential Property Monthly MarchFNB Residential Property Monthly March
FNB Residential Property Monthly March
 
FNB Residential Property Monthly_March
FNB Residential Property Monthly_MarchFNB Residential Property Monthly_March
FNB Residential Property Monthly_March
 
FNB_House Price Indices by Segment
FNB_House Price Indices by SegmentFNB_House Price Indices by Segment
FNB_House Price Indices by Segment
 
Market report q3 2021 fin
Market report q3 2021 finMarket report q3 2021 fin
Market report q3 2021 fin
 
New Homes Residential View - Autumn/Winter 2016
New Homes Residential View - Autumn/Winter 2016New Homes Residential View - Autumn/Winter 2016
New Homes Residential View - Autumn/Winter 2016
 

More from Berty Van Staaden

Lightstone House Price Index_August 2019
Lightstone House Price Index_August 2019Lightstone House Price Index_August 2019
Lightstone House Price Index_August 2019Berty Van Staaden
 
FNB Property Insights SARB Leading Indicator_August 2019
FNB Property Insights SARB Leading Indicator_August 2019FNB Property Insights SARB Leading Indicator_August 2019
FNB Property Insights SARB Leading Indicator_August 2019Berty Van Staaden
 
PayProp Rental Index Q2 2019
PayProp Rental Index Q2 2019PayProp Rental Index Q2 2019
PayProp Rental Index Q2 2019Berty Van Staaden
 
FNB Property Insights August 2019
FNB Property Insights August 2019FNB Property Insights August 2019
FNB Property Insights August 2019Berty Van Staaden
 
FNB Property Barometer (CPTt)_Aug 2019
FNB Property Barometer (CPTt)_Aug 2019FNB Property Barometer (CPTt)_Aug 2019
FNB Property Barometer (CPTt)_Aug 2019Berty Van Staaden
 
Lightstone_Residential Property Indices_July 2019
Lightstone_Residential Property Indices_July 2019Lightstone_Residential Property Indices_July 2019
Lightstone_Residential Property Indices_July 2019Berty Van Staaden
 
FNB Market Activity Ratings_July 2019
FNB Market Activity Ratings_July 2019FNB Market Activity Ratings_July 2019
FNB Market Activity Ratings_July 2019Berty Van Staaden
 
FNB May Building Statistics (Jul 2019)
FNB May Building Statistics (Jul 2019)FNB May Building Statistics (Jul 2019)
FNB May Building Statistics (Jul 2019)Berty Van Staaden
 
FNB Estate Agents Survey_Buy-to-Let
FNB Estate Agents Survey_Buy-to-LetFNB Estate Agents Survey_Buy-to-Let
FNB Estate Agents Survey_Buy-to-LetBerty Van Staaden
 
FNB Estate Agents Survey_Net Foreign Effect
FNB Estate Agents Survey_Net Foreign EffectFNB Estate Agents Survey_Net Foreign Effect
FNB Estate Agents Survey_Net Foreign EffectBerty Van Staaden
 
Lightstone_Residential Property Indices May 2019
Lightstone_Residential Property Indices May 2019Lightstone_Residential Property Indices May 2019
Lightstone_Residential Property Indices May 2019Berty Van Staaden
 
PayProp Rental Index Q 1 2019
PayProp Rental Index Q 1 2019PayProp Rental Index Q 1 2019
PayProp Rental Index Q 1 2019Berty Van Staaden
 
FNB Residential Property Barometer_February 2019
FNB Residential Property Barometer_February 2019FNB Residential Property Barometer_February 2019
FNB Residential Property Barometer_February 2019Berty Van Staaden
 
Lightstone Property Forecast for 2019
Lightstone Property Forecast for 2019Lightstone Property Forecast for 2019
Lightstone Property Forecast for 2019Berty Van Staaden
 
Lightstone_Residential Property Indices_January 2019
Lightstone_Residential Property Indices_January 2019Lightstone_Residential Property Indices_January 2019
Lightstone_Residential Property Indices_January 2019Berty Van Staaden
 
TPN_Vacancy Survey_Q3 2018
TPN_Vacancy Survey_Q3 2018TPN_Vacancy Survey_Q3 2018
TPN_Vacancy Survey_Q3 2018Berty Van Staaden
 
FNB_SARB Leading Indicator
FNB_SARB Leading IndicatorFNB_SARB Leading Indicator
FNB_SARB Leading IndicatorBerty Van Staaden
 
Lightstone_Residential Property Indices
Lightstone_Residential Property IndicesLightstone_Residential Property Indices
Lightstone_Residential Property IndicesBerty Van Staaden
 

More from Berty Van Staaden (20)

Lightstone House Price Index_August 2019
Lightstone House Price Index_August 2019Lightstone House Price Index_August 2019
Lightstone House Price Index_August 2019
 
FNB Property Insights SARB Leading Indicator_August 2019
FNB Property Insights SARB Leading Indicator_August 2019FNB Property Insights SARB Leading Indicator_August 2019
FNB Property Insights SARB Leading Indicator_August 2019
 
PayProp Rental Index Q2 2019
PayProp Rental Index Q2 2019PayProp Rental Index Q2 2019
PayProp Rental Index Q2 2019
 
FNB Property Insights August 2019
FNB Property Insights August 2019FNB Property Insights August 2019
FNB Property Insights August 2019
 
FNB Property Barometer (CPTt)_Aug 2019
FNB Property Barometer (CPTt)_Aug 2019FNB Property Barometer (CPTt)_Aug 2019
FNB Property Barometer (CPTt)_Aug 2019
 
Lightstone_Residential Property Indices_July 2019
Lightstone_Residential Property Indices_July 2019Lightstone_Residential Property Indices_July 2019
Lightstone_Residential Property Indices_July 2019
 
FNB_Rental Market
FNB_Rental MarketFNB_Rental Market
FNB_Rental Market
 
FNB Market Activity Ratings_July 2019
FNB Market Activity Ratings_July 2019FNB Market Activity Ratings_July 2019
FNB Market Activity Ratings_July 2019
 
FNB May Building Statistics (Jul 2019)
FNB May Building Statistics (Jul 2019)FNB May Building Statistics (Jul 2019)
FNB May Building Statistics (Jul 2019)
 
FNB Estate Agents Survey_Buy-to-Let
FNB Estate Agents Survey_Buy-to-LetFNB Estate Agents Survey_Buy-to-Let
FNB Estate Agents Survey_Buy-to-Let
 
FNB Estate Agents Survey_Net Foreign Effect
FNB Estate Agents Survey_Net Foreign EffectFNB Estate Agents Survey_Net Foreign Effect
FNB Estate Agents Survey_Net Foreign Effect
 
Lightstone_Residential Property Indices May 2019
Lightstone_Residential Property Indices May 2019Lightstone_Residential Property Indices May 2019
Lightstone_Residential Property Indices May 2019
 
PayProp Rental Index Q 1 2019
PayProp Rental Index Q 1 2019PayProp Rental Index Q 1 2019
PayProp Rental Index Q 1 2019
 
FNB Residential Property Barometer_February 2019
FNB Residential Property Barometer_February 2019FNB Residential Property Barometer_February 2019
FNB Residential Property Barometer_February 2019
 
Lightstone Property Forecast for 2019
Lightstone Property Forecast for 2019Lightstone Property Forecast for 2019
Lightstone Property Forecast for 2019
 
Lightstone_Residential Property Indices_January 2019
Lightstone_Residential Property Indices_January 2019Lightstone_Residential Property Indices_January 2019
Lightstone_Residential Property Indices_January 2019
 
TPN_Vacancy Survey_Q3 2018
TPN_Vacancy Survey_Q3 2018TPN_Vacancy Survey_Q3 2018
TPN_Vacancy Survey_Q3 2018
 
FNB_Property Insights
FNB_Property InsightsFNB_Property Insights
FNB_Property Insights
 
FNB_SARB Leading Indicator
FNB_SARB Leading IndicatorFNB_SARB Leading Indicator
FNB_SARB Leading Indicator
 
Lightstone_Residential Property Indices
Lightstone_Residential Property IndicesLightstone_Residential Property Indices
Lightstone_Residential Property Indices
 

Recently uploaded

Sobha Aranya Sector 80 Gurgaon E- Brochure.pdf
Sobha Aranya Sector 80 Gurgaon E- Brochure.pdfSobha Aranya Sector 80 Gurgaon E- Brochure.pdf
Sobha Aranya Sector 80 Gurgaon E- Brochure.pdffaheemali990101
 
The Omaxe State Dwarka Delhi-broucher.pdf.pdf
The Omaxe State Dwarka Delhi-broucher.pdf.pdfThe Omaxe State Dwarka Delhi-broucher.pdf.pdf
The Omaxe State Dwarka Delhi-broucher.pdf.pdfkratirudram
 
Listing Turkey Sylvana Istanbul - Bahcesehir
Listing Turkey Sylvana Istanbul - BahcesehirListing Turkey Sylvana Istanbul - Bahcesehir
Listing Turkey Sylvana Istanbul - BahcesehirListing Turkey
 
9990771857 Call Girls in Noida Sector 34 Noida (Call Girls) Delhi
9990771857 Call Girls in Noida Sector 34 Noida (Call Girls) Delhi9990771857 Call Girls in Noida Sector 34 Noida (Call Girls) Delhi
9990771857 Call Girls in Noida Sector 34 Noida (Call Girls) Delhidelhimodel235
 
Nanke Area Estate commercial ( Dir. Kat Kuo)
Nanke Area Estate commercial ( Dir. Kat Kuo)Nanke Area Estate commercial ( Dir. Kat Kuo)
Nanke Area Estate commercial ( Dir. Kat Kuo)jessica288382
 
Call Girls in Inderpuri Delhi 💯Call Us 🔝8264348440🔝
Call Girls in Inderpuri Delhi 💯Call Us 🔝8264348440🔝Call Girls in Inderpuri Delhi 💯Call Us 🔝8264348440🔝
Call Girls in Inderpuri Delhi 💯Call Us 🔝8264348440🔝soniya singh
 
Call Girls in Kashmiri Gate Delhi 💯Call Us 🔝8264348440🔝
Call Girls in Kashmiri Gate Delhi 💯Call Us 🔝8264348440🔝Call Girls in Kashmiri Gate Delhi 💯Call Us 🔝8264348440🔝
Call Girls in Kashmiri Gate Delhi 💯Call Us 🔝8264348440🔝soniya singh
 
Cashpay_Call Girls In Gaur City Mall Noida ❤️8860477959 Escorts Service In 24...
Cashpay_Call Girls In Gaur City Mall Noida ❤️8860477959 Escorts Service In 24...Cashpay_Call Girls In Gaur City Mall Noida ❤️8860477959 Escorts Service In 24...
Cashpay_Call Girls In Gaur City Mall Noida ❤️8860477959 Escorts Service In 24...lizamodels9
 
Call Girls in Sarai Kale Khan Delhi 💯Call Us 🔝8264348440🔝
Call Girls in Sarai Kale Khan Delhi 💯Call Us 🔝8264348440🔝Call Girls in Sarai Kale Khan Delhi 💯Call Us 🔝8264348440🔝
Call Girls in Sarai Kale Khan Delhi 💯Call Us 🔝8264348440🔝soniya singh
 
9990771857 Call Girls in Noida Sector 03 Noida (Call Girls) Delhi
9990771857 Call Girls in Noida Sector 03 Noida (Call Girls) Delhi9990771857 Call Girls in Noida Sector 03 Noida (Call Girls) Delhi
9990771857 Call Girls in Noida Sector 03 Noida (Call Girls) Delhidelhimodel235
 
Call Girls In The Lalit New Delhi ❤️8860477959 Good Looking Escorts In 24/7 D...
Call Girls In The Lalit New Delhi ❤️8860477959 Good Looking Escorts In 24/7 D...Call Girls In The Lalit New Delhi ❤️8860477959 Good Looking Escorts In 24/7 D...
Call Girls In The Lalit New Delhi ❤️8860477959 Good Looking Escorts In 24/7 D...lizamodels9
 
SSPL The Strand Abodes Kharadi Pune Brochure.pdf
SSPL The Strand Abodes Kharadi Pune Brochure.pdfSSPL The Strand Abodes Kharadi Pune Brochure.pdf
SSPL The Strand Abodes Kharadi Pune Brochure.pdfabbu831446
 
Low Rate Call Girls in Triveni Complex Delhi Call 9990771857
Low Rate Call Girls in Triveni Complex Delhi Call 9990771857Low Rate Call Girls in Triveni Complex Delhi Call 9990771857
Low Rate Call Girls in Triveni Complex Delhi Call 9990771857delhimodel235
 
Eco-Efficient Living: Redefining Sustainability through Leech's Green Design ...
Eco-Efficient Living: Redefining Sustainability through Leech's Green Design ...Eco-Efficient Living: Redefining Sustainability through Leech's Green Design ...
Eco-Efficient Living: Redefining Sustainability through Leech's Green Design ...Newman George Leech
 
Puravankara Mundhwa Pune E-Brochure.pdf
Puravankara Mundhwa Pune  E-Brochure.pdfPuravankara Mundhwa Pune  E-Brochure.pdf
Puravankara Mundhwa Pune E-Brochure.pdfManishSaxena95
 
9711199012 Call {Girls Delhi} Very Low rate Vaishali DownLoad PDF
9711199012 Call {Girls Delhi} Very Low rate Vaishali DownLoad PDF9711199012 Call {Girls Delhi} Very Low rate Vaishali DownLoad PDF
9711199012 Call {Girls Delhi} Very Low rate Vaishali DownLoad PDFMs Riya
 
Call Girls In Vasundhara Ghaziabad ❤️8860477959 Low Rate Escorts Service In 2...
Call Girls In Vasundhara Ghaziabad ❤️8860477959 Low Rate Escorts Service In 2...Call Girls In Vasundhara Ghaziabad ❤️8860477959 Low Rate Escorts Service In 2...
Call Girls In Vasundhara Ghaziabad ❤️8860477959 Low Rate Escorts Service In 2...lizamodels9
 
How to Build Multifamily and Laneway Suites in Toronto!! (feat. Expert Archi...
How to Build Multifamily and Laneway Suites  in Toronto!! (feat. Expert Archi...How to Build Multifamily and Laneway Suites  in Toronto!! (feat. Expert Archi...
How to Build Multifamily and Laneway Suites in Toronto!! (feat. Expert Archi...Volition Properties
 
Low Rate Call Girls in Akshardham Delhi Call 9990771857
Low Rate Call Girls in Akshardham   Delhi Call 9990771857Low Rate Call Girls in Akshardham   Delhi Call 9990771857
Low Rate Call Girls in Akshardham Delhi Call 9990771857delhimodel235
 

Recently uploaded (20)

Sobha Aranya Sector 80 Gurgaon E- Brochure.pdf
Sobha Aranya Sector 80 Gurgaon E- Brochure.pdfSobha Aranya Sector 80 Gurgaon E- Brochure.pdf
Sobha Aranya Sector 80 Gurgaon E- Brochure.pdf
 
The Omaxe State Dwarka Delhi-broucher.pdf.pdf
The Omaxe State Dwarka Delhi-broucher.pdf.pdfThe Omaxe State Dwarka Delhi-broucher.pdf.pdf
The Omaxe State Dwarka Delhi-broucher.pdf.pdf
 
Listing Turkey Sylvana Istanbul - Bahcesehir
Listing Turkey Sylvana Istanbul - BahcesehirListing Turkey Sylvana Istanbul - Bahcesehir
Listing Turkey Sylvana Istanbul - Bahcesehir
 
9953056974 Low Rate Call Girls In Saket, Delhi NCR
9953056974 Low Rate Call Girls In Saket, Delhi NCR9953056974 Low Rate Call Girls In Saket, Delhi NCR
9953056974 Low Rate Call Girls In Saket, Delhi NCR
 
9990771857 Call Girls in Noida Sector 34 Noida (Call Girls) Delhi
9990771857 Call Girls in Noida Sector 34 Noida (Call Girls) Delhi9990771857 Call Girls in Noida Sector 34 Noida (Call Girls) Delhi
9990771857 Call Girls in Noida Sector 34 Noida (Call Girls) Delhi
 
Nanke Area Estate commercial ( Dir. Kat Kuo)
Nanke Area Estate commercial ( Dir. Kat Kuo)Nanke Area Estate commercial ( Dir. Kat Kuo)
Nanke Area Estate commercial ( Dir. Kat Kuo)
 
Call Girls in Inderpuri Delhi 💯Call Us 🔝8264348440🔝
Call Girls in Inderpuri Delhi 💯Call Us 🔝8264348440🔝Call Girls in Inderpuri Delhi 💯Call Us 🔝8264348440🔝
Call Girls in Inderpuri Delhi 💯Call Us 🔝8264348440🔝
 
Call Girls in Kashmiri Gate Delhi 💯Call Us 🔝8264348440🔝
Call Girls in Kashmiri Gate Delhi 💯Call Us 🔝8264348440🔝Call Girls in Kashmiri Gate Delhi 💯Call Us 🔝8264348440🔝
Call Girls in Kashmiri Gate Delhi 💯Call Us 🔝8264348440🔝
 
Cashpay_Call Girls In Gaur City Mall Noida ❤️8860477959 Escorts Service In 24...
Cashpay_Call Girls In Gaur City Mall Noida ❤️8860477959 Escorts Service In 24...Cashpay_Call Girls In Gaur City Mall Noida ❤️8860477959 Escorts Service In 24...
Cashpay_Call Girls In Gaur City Mall Noida ❤️8860477959 Escorts Service In 24...
 
Call Girls in Sarai Kale Khan Delhi 💯Call Us 🔝8264348440🔝
Call Girls in Sarai Kale Khan Delhi 💯Call Us 🔝8264348440🔝Call Girls in Sarai Kale Khan Delhi 💯Call Us 🔝8264348440🔝
Call Girls in Sarai Kale Khan Delhi 💯Call Us 🔝8264348440🔝
 
9990771857 Call Girls in Noida Sector 03 Noida (Call Girls) Delhi
9990771857 Call Girls in Noida Sector 03 Noida (Call Girls) Delhi9990771857 Call Girls in Noida Sector 03 Noida (Call Girls) Delhi
9990771857 Call Girls in Noida Sector 03 Noida (Call Girls) Delhi
 
Call Girls In The Lalit New Delhi ❤️8860477959 Good Looking Escorts In 24/7 D...
Call Girls In The Lalit New Delhi ❤️8860477959 Good Looking Escorts In 24/7 D...Call Girls In The Lalit New Delhi ❤️8860477959 Good Looking Escorts In 24/7 D...
Call Girls In The Lalit New Delhi ❤️8860477959 Good Looking Escorts In 24/7 D...
 
SSPL The Strand Abodes Kharadi Pune Brochure.pdf
SSPL The Strand Abodes Kharadi Pune Brochure.pdfSSPL The Strand Abodes Kharadi Pune Brochure.pdf
SSPL The Strand Abodes Kharadi Pune Brochure.pdf
 
Low Rate Call Girls in Triveni Complex Delhi Call 9990771857
Low Rate Call Girls in Triveni Complex Delhi Call 9990771857Low Rate Call Girls in Triveni Complex Delhi Call 9990771857
Low Rate Call Girls in Triveni Complex Delhi Call 9990771857
 
Eco-Efficient Living: Redefining Sustainability through Leech's Green Design ...
Eco-Efficient Living: Redefining Sustainability through Leech's Green Design ...Eco-Efficient Living: Redefining Sustainability through Leech's Green Design ...
Eco-Efficient Living: Redefining Sustainability through Leech's Green Design ...
 
Puravankara Mundhwa Pune E-Brochure.pdf
Puravankara Mundhwa Pune  E-Brochure.pdfPuravankara Mundhwa Pune  E-Brochure.pdf
Puravankara Mundhwa Pune E-Brochure.pdf
 
9711199012 Call {Girls Delhi} Very Low rate Vaishali DownLoad PDF
9711199012 Call {Girls Delhi} Very Low rate Vaishali DownLoad PDF9711199012 Call {Girls Delhi} Very Low rate Vaishali DownLoad PDF
9711199012 Call {Girls Delhi} Very Low rate Vaishali DownLoad PDF
 
Call Girls In Vasundhara Ghaziabad ❤️8860477959 Low Rate Escorts Service In 2...
Call Girls In Vasundhara Ghaziabad ❤️8860477959 Low Rate Escorts Service In 2...Call Girls In Vasundhara Ghaziabad ❤️8860477959 Low Rate Escorts Service In 2...
Call Girls In Vasundhara Ghaziabad ❤️8860477959 Low Rate Escorts Service In 2...
 
How to Build Multifamily and Laneway Suites in Toronto!! (feat. Expert Archi...
How to Build Multifamily and Laneway Suites  in Toronto!! (feat. Expert Archi...How to Build Multifamily and Laneway Suites  in Toronto!! (feat. Expert Archi...
How to Build Multifamily and Laneway Suites in Toronto!! (feat. Expert Archi...
 
Low Rate Call Girls in Akshardham Delhi Call 9990771857
Low Rate Call Girls in Akshardham   Delhi Call 9990771857Low Rate Call Girls in Akshardham   Delhi Call 9990771857
Low Rate Call Girls in Akshardham Delhi Call 9990771857
 

FNB_Gauteng HPI_Jul 2017

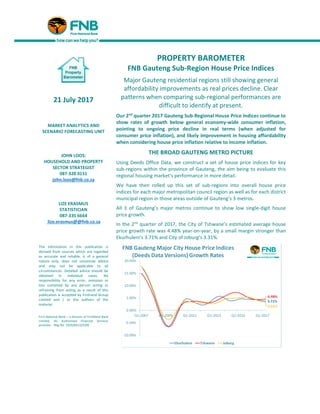
  • 1. 21 July 2017 MARKET ANALYTICS AND SCENARIO FORECASTING UNIT JOHN LOOS: HOUSEHOLD AND PROPERTY SECTOR STRATEGIST 087-328 0151 john.loos@fnb.co.za LIZE ERASMUS STATISTICIAN 087-335 6664 lize.erasmus@@fnb.co.za The information in this publication is derived from sources which are regarded as accurate and reliable, is of a general nature only, does not constitute advice and may not be applicable to all circumstances. Detailed advice should be obtained in individual cases. No responsibility for any error, omission or loss sustained by any person acting or refraining from acting as a result of this publication is accepted by Firstrand Group Limited and / or the authors of the material. First National Bank – a division of FirstRand Bank Limited. An Authorised Financial Services provider. Reg No. 1929/001225/06 PROPERTY BAROMETER FNB Gauteng Sub-Region House Price Indices Major Gauteng residential regions still showing general affordability improvements as real prices decline. Clear patterns when comparing sub-regional performances are difficult to identify at present. Our 2nd quarter 2017 Gauteng Sub-Regional House Price Indices continue to show rates of growth below general economy-wide consumer inflation, pointing to ongoing price decline in real terms (when adjusted for consumer price inflation), and likely improvement in housing affordability when considering house price inflation relative to income inflation. THE BROAD GAUTENG METRO PICTURE Using Deeds Office Data, we construct a set of house price indices for key sub-regions within the province of Gauteng, the aim being to evaluate this regional housing market’s performance in more detail. We have then rolled up this set of sub-regions into overall house price indices for each major metropolitan council region as well as for each district municipal region in those areas outside of Gauteng’s 3 metros. All 3 of Gauteng’s major metros continue to show low single-digit house price growth. In the 2nd quarter of 2017, the City of Tshwane’s estimated average house price growth rate was 4.48% year-on-year, by a small margin stronger than Ekurhuleni’s 3.71% and City of Joburg’s 3.31%.
  • 2. REAL HOUSE PRICE PERFORMANCES With Gauteng Consumer Price Index (CPI) Inflation at 5.2% year-on-year for the 2nd quarter of 2017, these low nominal house price growth rates translate into house price declines in real terms (when adjusted for CPI), Tshwane to the tune of -1.8% year-on-year, Ekurhuleni -1.4% and Joburg -1.8%. The 3 Gauteng Metros have been undergoing a gradual real house price correction for much of the time since the beginning of 2008. Since the 1st quarter of 2008, Tshwane’s cumulative real house price decline has been -22.7%, Joburg -23.6% and Ekurhuleni 25.9%. AFFORDABILITY IMPROVEMENTS CONTINUE TO BE WITNESSED IN A GOOD MARKET BALANCE AND STRONG RATES OF NEW ENTRY TO GAUTENG MARKETS BEING ACHIEVED Ongoing real house price “correction” in the Gauteng Metros is contributing positively to a heathy balance between demand and supply of housing, and relative ease of entry for 1st time buyers compared to certain other major regions. Both the Tshwane and Joburg regions (“Joburg” in the FNB Estate Agent Survey referring to City of Joburg as well as Ekurhuleni) continued to show estimated levels of 1st time home buying to be above the national average. For the 1st 2 quarters of 2017, 1st time buyers were estimated at 28,58% of total home buying in Greater Joburg, and 21.8% in Tshwane, the National Average being slightly lower at 21%. 1st time home buyers are on average more financially constrained than the more established repeat home buyers, and thus very sensitive to home affordability levels. For the 1st 2 quarters of 2017, Joburg and Tshwane also had the highest percentages of 1st time home buyers of the major metros. The recent years of real house price decline/improving affordability in the Gauteng Metros appears to have been a key positive for these 1st time buyers.
  • 3. In the 2nd quarter of 2017, Gauteng’s Estate Agent Survey sample estimated average time of homes on the market prior to sale to be around 12 weeks, having remained near to that level through most of 2016/17. This is a good level compared to the average time on the market for the 3 coastal metros, Ethekwini, Nelson Mandela Bay and Cape Town, whose average has risen noticeably to 20 weeks and 3 days. Greater Joburg at 12.86 weeks and Tshwane at 9.57 weeks had the 2 lowest average times on the market of the major South African metro regions, Cape Town with a significantly longer 16.21 weeks, Mandela Bay on 16.29 weeks and Ethekwini on 20.93 weeks.
  • 4. WE ZOOM IN ON THE CITY OF JOBURG’S MAIN REGIONS….IS THE ECONOMY BEGINNING TO BITE LOW INCOME REGIONS TOO? NEITHER HIGHEST NOR LOWEST PRICED ENDS APPEAR TO “OUTPERFORM” An interesting aspect observed in certain of the Gauteng data is that the lowest income regions may no longer be the best performing. Over the past 5 years, the region within Joburg with the highest cumulative house price growth has been the Diepkloof-Soweto-Meadowlands-Pimville Region, with 35.67% growth from the 2nd quarter of 2012 to the 2nd quarter of 2017. This is historically one of the country’s major Apartheid era “Black Township” regions, and is on average the cheapest of our City of Joburg sub-regions. But more recently, this region appears to have become an underperformer, showing slight average house price deflation to the tune of -1.16% year-on-year in the 2nd quarter of 2017. Also noteworthy is that the highest priced “Sandton and Surrounds”, the highest average value sub-region, is also in the doldrums, inflating by a mere 0.54%.
  • 5. TSHWANE – NEITHER THE HIGHEST NOR THE LOWEST PRICED REGIONS ARE THE STRONGEST HERE EITHER In Tshwane, we see something similar to City of Joburg in that over the past 5 years it has been the lowest income/priced Winterveldt-Mabopane-Soshanguve-Ga-Rankuwa-Hammanskraal region, a mix of former Apartheid Era “Black Townships” and Bophutatswana Homeland areas, that has shown the highest price inflation in Tshwane region to the tune of 41.07%. Admittedly, in such regions there may be some price inflation distortions with subsidized housing not always registered in deeds offices at market price. But, as in the case of the Soweto region in Johannesburg, this region had the weakest estimated house price growth in the 2nd quarter of 2017, to the tune of a negative -0.76%. Like Joburg, too, the highest priced Pretoria East and Centurion sub-regions were also not superior performers, recording 4.42% and 4.68% year-on-year price growth respectively in the 2nd quarter of 2017. Pretoria North East with 12.32% and Pretoria West regions had the fastest house price growth in the quarter.
  • 6. EKURHULENI SUB-REGION PERFORMANCE Patterns are a little more difficult to identify in Ekurhuleni, but once again it is neither the highest or the lowest priced sub-regions that were the top performers recently. Here too we do find that the lowest priced sub-regions are some of the weakest in terms of house price growth. The major Tokoza-Vosloorus-Katlehong “Former Township” region showed low (and below the metro average) year-on-year price growth of 1% in the 2nd quarter of 2017, while Nigel, the region with the 2nd lowest average price showed deflation of -0.78%. On the high priced end within Ekurhuleni, we had Alberton, the highest priced sub-region, showing 3.82% year- on-year house price growth, Kempton Park, the 2nd most expensive region, showing 4.05%, and Edenvale, the 3rd most expensive region, recording a small 0.37% positive growth rate. Best performers were certain of those priced somewhere in the middle, namely Brakpan with +12.98% year-on- year growth and Germiston with +7.25%, some of the more affordable regions but not the cheapest in Ekurhuleni.
  • 7. BUT THE MOST DEPRESSED MARKET APPEARS TO BE DOWN ON THE VAAL IN THE HEAVILY MANUFACTURING- DEPENDENT REGION OF EMFULENI DISTRICT MUNICIPALITY The Emfuleni District, which includes major towns of Van der Bijl Park and Vereeniging, is heavily Manufacturing dependent, and the Manufacturing Sector in South Africa has been “below par” for some years. Van der Bijl Park sees 32.3% of its GDP (Gross Domestic Product) coming from Manufacturing according to IHS Markit estimates, the highest percentage of any major town in Gauteng. Perhaps not surprisingly, therefore, Emfuleni Municipal Area has seen its 5-year cumulative house price growth underperform the 3 Gauteng Metros, recording only 18.75% growth in total since the 2nd quarter of 2012. And as at the 2nd quarter of 2017, the region’s year-on-year percentage change was a negative -2.76%, with the Manufacturing-heavy Van der Bijl Park seeing house price deflation of -4.08%, and the Low Income Evaton- Sebokeng “former townships” deflating by -3.67%. Vereeniging, less Manufacturing-heavy than Van der Bijl (Manufacturing in Vereeniging a lesser 18.8% of its GDP), still saw moderate price growth of +3.56%.
  • 8. MAIN CONCLUSION Although the trends and patterns emanating from Gauteng sub-regions are not strong ones at present, we believe that the message emanating from the 3 Gauteng Metros Sub-Region House Price Indices is that the most recent sweetspot is neither at the highest or the lowest-priced end, but somewhere in the “relatively affordable” middle where new middle class entrants probably like to buy. For the low income groups, South Africa’s almost zero growth economy may be starting to bite in terms of a lack of new job creation and income growth, which may mean that the lowest priced regions, many which would be former “Townships”, have weakened more noticeably in terms of average price growth. At the high priced end in each metro, on the other hand, confidence in the country’s economic future can be a reason for buyer caution amongst higher income groups, while it is also arguably about the high running and transaction costs related to higher value homes that comes with municipal rates and tariffs rising at rates well- above general inflation in recent years, and higher transfer duty brackets at the high end. Down in the Vaal Regions, the Manufacturing-dependent Emfuleni District appears to be the weakest housing region in Gauteng of late. HOUSE PRICE GROWTH SUMMARY TABLES Q3-2016 Q4-2016 Q1-2017 Q2-2017 Cumulative 15- year growth Cumulative 5- year growth CITY OF JOHANNESBURG TOTAL 4.25% 3.73% 3.43% 3.31% 266.96% 22.86% Johannesburg 4.62% 4.48% 4.23% 3.70% 304.38% 21.19% Johannesburg South 4.99% 4.41% 3.49% 2.59% 283.71% 20.02% Diepkloof_Soweto_Meadowlands_Pimville 5.28% 3.80% 1.53% -1.16% 799.48% 35.67% Midrand_Diepsloot 5.07% 4.69% 4.28% 3.77% 265.53% 27.19% Randburg 4.23% 3.83% 3.66% 3.83% 211.35% 20.72% Roodepoort 2.74% 2.11% 2.20% 2.92% 213.19% 19.29% Sandton and Surrounds 3.10% 2.31% 1.45% 0.54% 182.30% 18.98% Lenasia - Orange Farm - Ennerdale - Lawley 5.52% 5.08% 6.53% 8.43% 407.32% 23.55% Quarterly year-on-year percentage change
  • 9. Q3-2016 Q4-2016 Q1-2017 Q2-2017 Cumulative 15- year growth Cumulative 5- year growth CITY OF TSHWANE ROLL UP 4.35% 4.35% 4.40% 4.48% 244.23% 28.93% Akasia 1.74% 1.37% 1.17% 1.30% 260.13% 19.60% Bronkhorstspruit-Cullinan- Rayton-Ekangala-Refilwe 2.59% 3.94% 5.92% 8.82% 322.26% 24.04% Centurion 5.43% 5.05% 4.85% 4.68% 210.70% 30.47% Pretoria-Roodeplaat 3.69% 4.25% 5.02% 5.80% 226.39% 27.73% Winterveldt-Mabopane- Soshanguve-GaRankuwa- Hammanskraal-Kudube- Themba 12.92% 9.38% 4.03% -0.76% 504.03% 41.07% Pretoria Central 1.00% 2.86% 5.21% 7.24% 375.11% 23.35% Pretoria East 5.80% 5.34% 4.82% 4.42% 191.43% 28.83% Pretoria North 2.41% 3.23% 4.20% 5.00% 224.49% 23.51% Pretoria North East 4.27% 5.61% 8.50% 12.32% 326.88% 34.64% Pretoria South East -2.13% -0.87% 0.53% 0.84% 222.56% 26.23% Pretoria West 4.72% 5.56% 8.12% 10.86% 439.11% 40.42% PRETORIA ROLL UP 3.69% 4.32% 5.29% 6.30% 254.44% 29.77% Quarterly year-on-year percentage change CITY OF TSHWANE SUB-REGIONAL HOUSE PRICE INDICES – AVERAGE GROWTH RATES
  • 10. Q3-2016 Q4-2016 Q1-2017 Q2-2017 Cumulative 15- year growth Cumulative 5- year growth EKURHULENI ROLL UP 4.22% 4.03% 3.81% 3.71% 301.10% 24.07% Alberton 1.33% 2.15% 3.14% 3.82% 252.14% 18.13% Benoni 3.54% 2.79% 1.82% 1.50% 221.14% 14.99% Boksburg 3.59% 3.37% 2.72% 2.35% 238.12% 18.45% Brakpan 5.11% 7.23% 9.97% 12.98% 361.15% 38.56% Edenvale 1.77% 1.12% 0.77% 0.37% 229.82% 18.15% Germiston 3.30% 4.51% 5.94% 7.25% 285.27% 24.07% Kempton Park 4.03% 4.35% 4.45% 4.05% 278.68% 21.68% Nigel 8.56% 6.38% 2.59% -0.78% 368.21% 16.64% Olifantsfontein 11.91% 5.55% 2.21% -0.84% 1113.06% 49.36% Springs 3.52% 3.05% 3.13% 3.47% 337.32% 28.89% Tokoza_Voloorus_Katlehong 2.50% 2.23% 1.71% 1.00% 718.78% 32.81% Quarterly year-on-year percentage change CITY OF EKURHULENI SUB-REGIONAL HOUSE PRICE INDICES – AVERAGE GROWTH RATES
  • 11. Q3-2016 Q4-2016 Q1-2017 Q2-2017 Cumulative 15- year growth Cumulative 5- year growth EMFULENI 5.03% 3.84% 1.07% -2.76% 352.36% 18.75% Evaton - Sebokeng 13.23% 12.00% 6.20% -3.67% 551.45% 44.47% Vaal - Vanderbijlpark 2.67% 1.78% -0.67% -4.08% 337.22% 12.40% Vereeniging 2.67% 3.35% 3.80% 3.56% 325.69% 22.33% Quarterly year-on-year percentage change Q3-2016 Q4-2016 Q1-2017 Q2-2017 Cumulative 15- year growth Cumulative 5- year growth MOGALE CITY 2.39% 2.37% 3.24% 4.56% 271.34% 24.98% Krugersdorp_Magaliesburg_Mogale 3.36% 3.69% 4.40% 5.19% 248.08% 26.12% Randfontein -1.06% -0.15% 2.14% 4.64% 276.15% 18.32% Quarterly year-on-year percentage change Q3-2016 Q4-2016 Q1-2017 Q2-2017 Cumulative 15- year growth Cumulative 5- year growth LESEDI 4.29% 0.95% -1.86% -4.10% 266.30% 9.71% MERAFONG 8.99% 6.32% 4.91% 6.30% 334.45% 15.51% MIDVAAL 1.29% 2.42% 5.25% 8.44% 354.76% 33.21% WESTONARIA 6.85% 11.46% 14.36% 14.31% 517.72% 36.01% Quarterly year-on-year percentage change