SlideShare a Scribd company logo
1 of 10
Download to read offline
29 October 2017
MARKET ANALYTICS AND
SCENARIO FORECASTING UNIT
JOHN LOOS:
HOUSEHOLD AND PROPERTY
SECTOR STRATEGIST
087-328 0151
john.loos@fnb.co.za
LIZE ERASMUS
STATISTICIAN
087-335 6664
lize.erasmus@@fnb.co.za
The information in this publication is
derived from sources which are regarded
as accurate and reliable, is of a general
nature only, does not constitute advice
and may not be applicable to all
circumstances. Detailed advice should be
obtained in individual cases. No
responsibility for any error, omission or
loss sustained by any person acting or
refraining from acting as a result of this
publication is accepted by Firstrand Group
Limited and / or the authors of the
material.
First National Bank – a division of FirstRand Bank
Limited. An Authorised Financial Services
provider. Reg No. 1929/001225/06
PROPERTY BAROMETER
FNB Gauteng Sub-Region House Price Indices
Major Metro Gauteng residential regions still showing real
house price decline, but with the low-priced end appearing
to be mildly stronger than the high end.
Our 3rd
quarter 2017 Gauteng Metro and Major Council House Price Indices
continue to show rates of growth below general economy-wide consumer
inflation, pointing to ongoing price decline in real terms (when adjusted for
consumer price inflation), and likely improvement in housing affordability
when considering house price inflation relative to income inflation.
THE BROAD GAUTENG METRO PICTURE
Using Deeds Office Data, we construct a set of house price indices for key
sub-regions within the province of Gauteng, the aim being to evaluate this
regional housing market’s performance in more detail.
We have then rolled up this set of sub-regions into overall house price
indices for each major metropolitan council region as well as for each district
municipal region in those areas outside of Gauteng’s 3 metros.
All 3 of Gauteng’s major metros continue to show low single-digit house
price growth.
In the 3rd
quarter of 2017, the City of Tshwane’s estimated average house
price growth rate was 4.40% year-on-year, by a small margin stronger than
Ekurhuleni’s 4.21% and City of Joburg’s 2.31%.
REAL HOUSE PRICE PERFORMANCES
With Gauteng Consumer Price Index (CPI)
Inflation at 4.8% year-on-year for the 3rd
quarter
of 2017, these low nominal house price growth
rates translate into house price declines in real
terms (when adjusted for CPI), Tshwane to the
tune of -0.3% year-on-year, Ekurhuleni -0.5%
and Joburg -2.3%.
The 3 Gauteng Metros have been undergoing a
gradual real house price correction for much of
the time since the beginning of 2008.
Since the 1st
quarter of 2008, Tshwane’s
cumulative real house price decline has been
-22.3%, Joburg -24.25% and Ekurhuleni -25.5%.
WE ZOOM IN ON THE CITY OF JOBURG’S MAIN REGIONS….MEDIOCRE GROWTH EVERYWHERE, WITH THE
FORMER TOWNSHIP REGION AROUND SOWETO SHOWING THE HIGHEST GROWTH
There are no strong “outperforming” regions in Gauteng of late. Over the past 5 years, the lowest income region,
i.e. the former “township” region of Diepkloof-Soweto-Meadowlands-Pimville has shown the strongest
cumulative growth of 42.82%, with the Midrand-Diepsloot region a distant second with 26.33% cumulative
growth. At the weak end, the highest priced region of “Sandton and Surrounds” has grown the slowest growth off
the highest base, i.e. 17.92%.
More recently, the Diepkloof-Soweto-Meadowlands-Pimville region remains the highest estimated house price
growth region at 4.28% year-on-year in the 3rd
quarter of 2017. However, this price growth rate itself is weak,
negative in real terms, and only slightly above the other low end region of Lenasia-Orange Farm-Ennerdale-
Lawley, at 4.04%. Nevertheless, this would suggest that the City of Joburg lower price markets are a little
stronger, and the high end weaker, with the most expensive “Sandton and Surrounds” end measuring a very slight
-0.1% year-on-year price decline.
TSHWANE – ALSO HINTING AT SLIGHTLY STRONGER LOWER END MARKETS
In Tshwane, the relative market strength of late also appears to have been more at the low end.
Over the past 5 years, cumulative house price growth within Tshwane is estimated to have been the strongest in
the Winterveldt-Mabopane-Soshanguve-Ga-Rankuwa-Hammanskraal region, to the tune of 66.98%. In such
former “township” regions, care must be taken with interpretation, because where Government subsidized “RDP”
homes are transferred to their new owners, the registered amount in the deeds data can be below market value,
meaning that a repeat sale can come off an artificially low base.
However, another low end area, Pretoria West, shows the 2nd
highest cumulative growth to the tune of 42.11%,
followed by Pretoria North East with 32.44%, also thus pointing to low end markets having done a little better
than higher priced regions in recent years.
In the 3rd
quarter of 2017, those 3 same regions again came out as the 3 highest price growth regions too.
EKURHULENI SUB-REGION PERFORMANCE
Ekurhuleni also appears to have experienced greater market strength at the lower end. Some of the strongest
cumulative house price growth over the past 5 years was seen in the lowest average priced areas, namely Tokoza-
Vosloorus-Katlehong with 44.33%, Nigel with 37.91%, Brakpan with 30.81% and Springs by 28.49%. Those 4
regions are the 4 lowest average house price regions in Ekurhuleni. Olifantsfontein region, a relatively high priced
region by Ekurhuleni standards, in excess of R800,000 (R805,000) showed very strong growth of 40.85%, but we
believe that this is in part due to difficulty in eliminating much of the “land-to-building” effect on the repeat sales
index, as this is a relatively new area with much building activity in recent years.
Other higher end areas with average prices above R800,000 (higher by Ekurhuleni standards) such as Alberton
(16.97%) and Edenvale (16.7%) had relatively low cumulative house price growth.
In the 3rd
quarter of 2017, it remained the lower average price end that seemed to do better, with Nigel (18.6%),
Tokoza-Vosloorus-Katlehong (11.8%) and Brakpan (6.94%) being the strongest 3 regions price growth-wise.
THE MANUFACTURING-DEPENDENT EMFULENI REGION APPEARS TO REMAIN THE MOST DEPRESSED HOUSING
MARKET
The Emfuleni District, which includes major towns of Van der Bijl Park and Vereeniging, is heavily Manufacturing
dependent, and the Manufacturing Sector in South Africa has been in the doldrums in recent years. The Van der
Bijl Park area is especially Manufacturing-heavy.
This, we believe, has had an influence on cumulative Emfuleni house price growth of only 21.65% over the past 5
years, but more specifically on the Van der Bijl Park region’s weak 16.03% cumulative house price growth.
As at the 3rd
quarter of 2017, the region’s year-on-year percentage change was very weak at a slightly positive
+0.07% rate, with Van der Bijl’s negative -0.41% rate being the weakest sub-region of Emfuleni
CONCLUSION
Although the Gauteng residential markets don’t show any great strength at present, there appears to be a broad
pattern of low priced sub-regions performing a little better than the high-priced end.
This appears to tie in with what the FNB Estate
Agent Survey tells us regarding 1st
time buyer
levels in Gauteng’s Metros, i.e. that in the 2017
year-to-date, estimated 1st
time buying in
Greater Joburg was 26.62% of total home
buying, and 24.3% in Tshwane, both
percentages being relatively strong and above
the national average of 20.26%.
Solid 1st
time buying in the province may be a
key source of support for the low end of the
housing market.
At the high priced end in each metro, on the
other hand, confidence in the country’s
economic future can be a reason for buyer caution amongst higher income groups, while it is also arguably about
the high running and transaction costs related to higher value homes that comes with municipal rates and tariffs
rising at rates well-above general inflation in recent years, and higher transfer duty brackets at the high end.
However, while the low priced end appears to be stronger than higher up the price ladder, broadly speaking, it is
by no means very strong either.
Down in the Emfuleni Regions near the Vaal River, the Manufacturing-dependent Van der Bijl Park appears to
stand out as the weakest housing region in Gauteng.
HOUSE PRICE GROWTH SUMMARY TABLES
Q4-2016 Q1-2017 Q2-2017 Q3-2017
Cumulative 15-
year growth
Cumulative 5-
year growth
CITY OF JOHANNESBURG TOTAL 3.79% 3.26% 2.77% 2.31% 248.88% 22.10%
Johannesburg 4.29% 3.65% 2.57% 1.53% 279.65% 20.13%
Johannesburg South 4.65% 3.97% 3.32% 2.67% 271.02% 20.19%
Diepkloof-Soweto-Meadowlands-Pimville 3.71% 3.10% 3.28% 4.28% 831.22% 42.82%
Midrand_Diepsloot 4.78% 4.26% 3.46% 2.68% 243.43% 26.33%
Randburg 3.68% 3.44% 3.46% 3.56% 197.02% 20.63%
Roodepoort 2.21% 2.21% 2.82% 3.55% 201.10% 19.93%
Sandton and Surrounds 2.35% 1.48% 0.62% -0.10% 167.55% 17.92%
Lanasia-Orange Farm-Ennerdale-Lawley 5.51% 5.00% 4.27% 4.04% 378.42% 19.71%
Quarterly year-on-year percentage change
CITY OF JOHANNESBURG SUB-REGIONAL HOUSE PRICE INDICES – AVERAGE GROWTH RATES
Q4-2016 Q1-2017 Q2-2017 Q3-2017
Cumulative 15-
year growth
Cumulative 5-
year growth
CITY OF TSHWANE ROLL UP 4.52% 4.54% 4.52% 4.40% 231.54% 29.69%
Akasia 1.84% 2.39% 3.90% 5.51% 263.93% 23.94%
Bronkhorstspruit-Cullinan-
Rayton-Ekangala-Refilwe
4.60% 4.56% 3.17% -0.46% 274.04% 14.74%
Centurion 4.88% 4.44% 3.87% 3.26% 194.83% 29.19%
Pretoria-Roodeplaat 4.11% 4.50% 4.68% 4.46% 209.41% 26.76%
Winterveldt-Mabopane-
Soshanguve-GaRankuwa-
Hammanskraal-Kudube-
Themba
12.61% 10.77% 11.18% 13.14% 607.26% 66.98%
Pretoria Central 3.78% 5.80% 7.00% 7.19% 362.17% 23.33%
Pretoria East 5.27% 4.53% 3.79% 3.24% 177.35% 27.36%
Pretoria North 3.52% 4.20% 4.62% 4.73% 212.96% 23.77%
Pretoria North East 4.68% 6.60% 8.53% 8.91% 297.32% 32.44%
Pretoria South East -0.93% 0.20% 0.20% 0.01% 205.06% 21.42%
Pretoria West 5.44% 8.17% 10.67% 12.59% 420.43% 42.11%
PRETORIA ROLL UP 4.56% 5.33% 5.99% 6.28% 241.11% 30.00%
Quarterly year-on-year percentage change
CITY OF TSHWANE SUB-REGIONAL HOUSE PRICE INDICES – AVERAGE GROWTH RATES
Q4-2016 Q1-2017 Q2-2017 Q3-2017
Cumulative 15-
year growth
Cumulative 5-
year growth
EKURHULENI 4.17% 4.03% 4.06% 4.21% 289.06% 24.26%
Alberton 2.47% 2.91% 2.80% 2.31% 232.77% 16.97%
Benoni 2.65% 1.80% 1.62% 1.77% 207.77% 15.08%
Boksburg 3.35% 2.56% 1.91% 1.27% 219.20% 16.88%
Brakpan 6.46% 7.42% 7.78% 6.94% 329.32% 30.81%
Edenvale 1.01% 0.43% 0.11% -0.17% 213.03% 16.70%
Germiston 3.69% 4.30% 4.42% 3.95% 260.43% 21.39%
Kempton Park 4.84% 5.12% 5.03% 5.03% 268.61% 22.93%
Nigel 8.78% 10.09% 13.88% 18.61% 448.82% 37.91%
Olifantsfontein 5.94% 2.87% 0.23% -1.38% 1033.04% 40.85%
Springs 3.65% 3.13% 3.24% 4.00% 323.52% 28.49%
Tokoza-Voloorus-Katlehong 3.42% 4.93% 7.50% 11.80% 782.68% 44.33%
Quarterly year-on-year percentage change
CITY OF EKURHULENI SUB-REGIONAL HOUSE PRICE INDICES – AVERAGE GROWTH RATES
Q4-2016 Q1-2017 Q2-2017 Q3-2017
Cumulative 15-
year growth
Cumulative 5-
year growth
EMFULENI 3.83% 2.84% 1.01% 0.07% 353.85% 21.65%
Evaton-Sebokeng 12.79% 10.09% 5.02% 3.89% 615.25% 63.77%
Vaal-Vanderbijlpark 1.62% 0.70% -0.44% -0.41% 333.60% 16.03%
Vereeniging 3.93% 4.54% 4.06% 2.90% 313.72% 21.76%
Quarterly year-on-year percentage change
Q4-2016 Q1-2017 Q2-2017 Q3-2017
Cumulative 15-
year growth
Cumulative 5-
year growth
MOGALE CITY 2.37% 3.12% 4.23% 5.09% 262.26% 26.12%
Krugersdorp-Magaliesburg-Mogale 3.33% 3.32% 3.00% 2.21% 226.41% 22.98%
Randfontein 0.25% 3.61% 8.48% 13.88% 291.55% 28.05%
Quarterly year-on-year percentage change
Q4-2016 Q1-2017 Q2-2017 Q3-2017
Cumulative 15-
year growth
Cumulative 5-
year growth
LESEDI 0.94% -1.75% -3.74% -4.17% 244.15% 9.62%
MERAFONG 5.57% 2.84% 2.22% 1.79% 306.09% 9.56%
MIDVAAL 2.85% 5.60% 8.21% 9.70% 339.00% 36.14%
WESTONARIA 10.67% 13.66% 14.41% 15.26% 545.56% 38.78%
Quarterly year-on-year percentage change

More Related Content

Similar to FNB_Gauteng Sub-Region House Price Indices

Similar to FNB_Gauteng Sub-Region House Price Indices (20)

FNB_Gauteng House Price Index
FNB_Gauteng House Price IndexFNB_Gauteng House Price Index
FNB_Gauteng House Price Index
 
FNB_AREA VALUE BAND HOUSE PRICE INDEX
FNB_AREA VALUE BAND HOUSE PRICE INDEXFNB_AREA VALUE BAND HOUSE PRICE INDEX
FNB_AREA VALUE BAND HOUSE PRICE INDEX
 
FNB_Provincial and Major Metro House Price Indices
FNB_Provincial and Major Metro House Price IndicesFNB_Provincial and Major Metro House Price Indices
FNB_Provincial and Major Metro House Price Indices
 
FNB_Western Cape
FNB_Western CapeFNB_Western Cape
FNB_Western Cape
 
FNB 2017 House Price Index Performance
FNB 2017 House Price Index PerformanceFNB 2017 House Price Index Performance
FNB 2017 House Price Index Performance
 
FNB_Property Barometer - September
FNB_Property Barometer - SeptemberFNB_Property Barometer - September
FNB_Property Barometer - September
 
FNB HPI March 2017
FNB HPI March 2017FNB HPI March 2017
FNB HPI March 2017
 
FNB_House Price Indices by Segment
FNB_House Price Indices by SegmentFNB_House Price Indices by Segment
FNB_House Price Indices by Segment
 
FNB_House Price Index
FNB_House Price IndexFNB_House Price Index
FNB_House Price Index
 
FNB_House Price Index_Nov 2017
FNB_House Price Index_Nov 2017FNB_House Price Index_Nov 2017
FNB_House Price Index_Nov 2017
 
FNB_Residential Demand Conditions_1st Time Home Buying
FNB_Residential Demand Conditions_1st Time Home BuyingFNB_Residential Demand Conditions_1st Time Home Buying
FNB_Residential Demand Conditions_1st Time Home Buying
 
FNB House Price Index_Sept 2017
FNB House Price Index_Sept 2017FNB House Price Index_Sept 2017
FNB House Price Index_Sept 2017
 
Lightstone Residential Property Indices_December 2017
Lightstone Residential Property Indices_December 2017Lightstone Residential Property Indices_December 2017
Lightstone Residential Property Indices_December 2017
 
Lightstone_ Residential Property Indices_January 2018
Lightstone_ Residential Property Indices_January 2018Lightstone_ Residential Property Indices_January 2018
Lightstone_ Residential Property Indices_January 2018
 
PayProp Rental Index_ Q3 2017
PayProp Rental Index_ Q3 2017PayProp Rental Index_ Q3 2017
PayProp Rental Index_ Q3 2017
 
Lightstone residential property indices april 2018
Lightstone residential property indices april 2018Lightstone residential property indices april 2018
Lightstone residential property indices april 2018
 
TPN_Rental Monitor_Q2 2017
TPN_Rental Monitor_Q2 2017TPN_Rental Monitor_Q2 2017
TPN_Rental Monitor_Q2 2017
 
Lightstone_Residential Property Indices
Lightstone_Residential Property IndicesLightstone_Residential Property Indices
Lightstone_Residential Property Indices
 
FNB_Price Realism and Market Balance
FNB_Price Realism and Market BalanceFNB_Price Realism and Market Balance
FNB_Price Realism and Market Balance
 
FNB_House Price Index_January 2018
FNB_House Price Index_January 2018FNB_House Price Index_January 2018
FNB_House Price Index_January 2018
 

More from Berty Van Staaden

More from Berty Van Staaden (20)

Lightstone House Price Index_August 2019
Lightstone House Price Index_August 2019Lightstone House Price Index_August 2019
Lightstone House Price Index_August 2019
 
FNB Property Insights SARB Leading Indicator_August 2019
FNB Property Insights SARB Leading Indicator_August 2019FNB Property Insights SARB Leading Indicator_August 2019
FNB Property Insights SARB Leading Indicator_August 2019
 
PayProp Rental Index Q2 2019
PayProp Rental Index Q2 2019PayProp Rental Index Q2 2019
PayProp Rental Index Q2 2019
 
FNB Residential Building Stats_Q2 2019
FNB Residential Building Stats_Q2 2019FNB Residential Building Stats_Q2 2019
FNB Residential Building Stats_Q2 2019
 
FNB Property Insights August 2019
FNB Property Insights August 2019FNB Property Insights August 2019
FNB Property Insights August 2019
 
FNB_Property Insights_Retail Property's Consumer Challenges
FNB_Property Insights_Retail Property's Consumer ChallengesFNB_Property Insights_Retail Property's Consumer Challenges
FNB_Property Insights_Retail Property's Consumer Challenges
 
Lightstone_Residential Property Indices_July 2019
Lightstone_Residential Property Indices_July 2019Lightstone_Residential Property Indices_July 2019
Lightstone_Residential Property Indices_July 2019
 
FNB_Rental Market
FNB_Rental MarketFNB_Rental Market
FNB_Rental Market
 
FNB Market Activity Ratings_July 2019
FNB Market Activity Ratings_July 2019FNB Market Activity Ratings_July 2019
FNB Market Activity Ratings_July 2019
 
FNB May Building Statistics (Jul 2019)
FNB May Building Statistics (Jul 2019)FNB May Building Statistics (Jul 2019)
FNB May Building Statistics (Jul 2019)
 
FNB Estate Agents Survey_Buy-to-Let
FNB Estate Agents Survey_Buy-to-LetFNB Estate Agents Survey_Buy-to-Let
FNB Estate Agents Survey_Buy-to-Let
 
FNB Estate Agents Survey_Net Foreign Effect
FNB Estate Agents Survey_Net Foreign EffectFNB Estate Agents Survey_Net Foreign Effect
FNB Estate Agents Survey_Net Foreign Effect
 
Lightstone_Residential Property Indices May 2019
Lightstone_Residential Property Indices May 2019Lightstone_Residential Property Indices May 2019
Lightstone_Residential Property Indices May 2019
 
PayProp Rental Index Q 1 2019
PayProp Rental Index Q 1 2019PayProp Rental Index Q 1 2019
PayProp Rental Index Q 1 2019
 
FNB Residential Property Barometer_February 2019
FNB Residential Property Barometer_February 2019FNB Residential Property Barometer_February 2019
FNB Residential Property Barometer_February 2019
 
Lightstone Property Forecast for 2019
Lightstone Property Forecast for 2019Lightstone Property Forecast for 2019
Lightstone Property Forecast for 2019
 
Lightstone_Residential Property Indices_January 2019
Lightstone_Residential Property Indices_January 2019Lightstone_Residential Property Indices_January 2019
Lightstone_Residential Property Indices_January 2019
 
TPN_Vacancy Survey_Q3 2018
TPN_Vacancy Survey_Q3 2018TPN_Vacancy Survey_Q3 2018
TPN_Vacancy Survey_Q3 2018
 
FNB_Property Insights
FNB_Property InsightsFNB_Property Insights
FNB_Property Insights
 
FNB_SARB Leading Indicator
FNB_SARB Leading IndicatorFNB_SARB Leading Indicator
FNB_SARB Leading Indicator
 

Recently uploaded

9990771857 Call Girls Dwarka Sector 8 Delhi (Call Girls ) Delhi
9990771857 Call Girls  Dwarka Sector 8 Delhi (Call Girls ) Delhi9990771857 Call Girls  Dwarka Sector 8 Delhi (Call Girls ) Delhi
9990771857 Call Girls Dwarka Sector 8 Delhi (Call Girls ) Delhi
delhimodel235
 
BPTP THE AMAARIO Luxury Project Invest Like Royalty in Sector 37D Gurgaon Dwa...
BPTP THE AMAARIO Luxury Project Invest Like Royalty in Sector 37D Gurgaon Dwa...BPTP THE AMAARIO Luxury Project Invest Like Royalty in Sector 37D Gurgaon Dwa...
BPTP THE AMAARIO Luxury Project Invest Like Royalty in Sector 37D Gurgaon Dwa...
ApartmentWala1
 
Acibadem Konaklari Uskudar - Listin Turkey
Acibadem Konaklari Uskudar - Listin TurkeyAcibadem Konaklari Uskudar - Listin Turkey
Acibadem Konaklari Uskudar - Listin Turkey
Listing Turkey
 
9990771857 Call Girls in Dwarka Sector 137 Noida (Call Girls) Delhi
9990771857 Call Girls in Dwarka Sector 137 Noida (Call Girls) Delhi9990771857 Call Girls in Dwarka Sector 137 Noida (Call Girls) Delhi
9990771857 Call Girls in Dwarka Sector 137 Noida (Call Girls) Delhi
delhimodel235
 
9990771857 Call Girls in Dwarka Sector 1 Delhi (Call Girls) Delhi
9990771857 Call Girls in Dwarka Sector 1 Delhi (Call Girls) Delhi9990771857 Call Girls in Dwarka Sector 1 Delhi (Call Girls) Delhi
9990771857 Call Girls in Dwarka Sector 1 Delhi (Call Girls) Delhi
delhimodel235
 
9990771857 Call Girls in Dwarka Sector 7 Delhi (Call Girls) Delhi
9990771857 Call Girls in Dwarka Sector 7 Delhi (Call Girls) Delhi9990771857 Call Girls in Dwarka Sector 7 Delhi (Call Girls) Delhi
9990771857 Call Girls in Dwarka Sector 7 Delhi (Call Girls) Delhi
delhimodel235
 
9990771857 Call Girls in Dwarka Sector 08 Delhi (Call Girls) Delhi
9990771857 Call Girls in Dwarka Sector 08 Delhi (Call Girls) Delhi9990771857 Call Girls in Dwarka Sector 08 Delhi (Call Girls) Delhi
9990771857 Call Girls in Dwarka Sector 08 Delhi (Call Girls) Delhi
delhimodel235
 

Recently uploaded (20)

9990771857 Call Girls Dwarka Sector 8 Delhi (Call Girls ) Delhi
9990771857 Call Girls  Dwarka Sector 8 Delhi (Call Girls ) Delhi9990771857 Call Girls  Dwarka Sector 8 Delhi (Call Girls ) Delhi
9990771857 Call Girls Dwarka Sector 8 Delhi (Call Girls ) Delhi
 
BPTP THE AMAARIO Luxury Project Invest Like Royalty in Sector 37D Gurgaon Dwa...
BPTP THE AMAARIO Luxury Project Invest Like Royalty in Sector 37D Gurgaon Dwa...BPTP THE AMAARIO Luxury Project Invest Like Royalty in Sector 37D Gurgaon Dwa...
BPTP THE AMAARIO Luxury Project Invest Like Royalty in Sector 37D Gurgaon Dwa...
 
Kolte Patil Kharadi Pune E Brochure.pdf
Kolte Patil Kharadi Pune E  Brochure.pdfKolte Patil Kharadi Pune E  Brochure.pdf
Kolte Patil Kharadi Pune E Brochure.pdf
 
SVN Live 5.6.24 Weekly Property Broadcast
SVN Live 5.6.24 Weekly Property BroadcastSVN Live 5.6.24 Weekly Property Broadcast
SVN Live 5.6.24 Weekly Property Broadcast
 
Shapoorji Pallonji Joyville Vista Pune | Spend Your Family Time Together
Shapoorji Pallonji Joyville Vista Pune | Spend Your Family Time TogetherShapoorji Pallonji Joyville Vista Pune | Spend Your Family Time Together
Shapoorji Pallonji Joyville Vista Pune | Spend Your Family Time Together
 
Acibadem Konaklari Uskudar - Listin Turkey
Acibadem Konaklari Uskudar - Listin TurkeyAcibadem Konaklari Uskudar - Listin Turkey
Acibadem Konaklari Uskudar - Listin Turkey
 
Retail Center For Sale - 1019 River St., Belleville, WI
Retail Center For Sale - 1019 River St., Belleville, WIRetail Center For Sale - 1019 River St., Belleville, WI
Retail Center For Sale - 1019 River St., Belleville, WI
 
BDSM⚡Call Girls in Sector 57 Noida Escorts >༒8448380779 Escort Service
BDSM⚡Call Girls in Sector 57 Noida Escorts >༒8448380779 Escort ServiceBDSM⚡Call Girls in Sector 57 Noida Escorts >༒8448380779 Escort Service
BDSM⚡Call Girls in Sector 57 Noida Escorts >༒8448380779 Escort Service
 
Purva Soukhyam in Guduvancheri Chennai.pdf
Purva Soukhyam in Guduvancheri Chennai.pdfPurva Soukhyam in Guduvancheri Chennai.pdf
Purva Soukhyam in Guduvancheri Chennai.pdf
 
9990771857 Call Girls in Dwarka Sector 137 Noida (Call Girls) Delhi
9990771857 Call Girls in Dwarka Sector 137 Noida (Call Girls) Delhi9990771857 Call Girls in Dwarka Sector 137 Noida (Call Girls) Delhi
9990771857 Call Girls in Dwarka Sector 137 Noida (Call Girls) Delhi
 
9990771857 Call Girls in Dwarka Sector 1 Delhi (Call Girls) Delhi
9990771857 Call Girls in Dwarka Sector 1 Delhi (Call Girls) Delhi9990771857 Call Girls in Dwarka Sector 1 Delhi (Call Girls) Delhi
9990771857 Call Girls in Dwarka Sector 1 Delhi (Call Girls) Delhi
 
9990771857 Call Girls in Dwarka Sector 7 Delhi (Call Girls) Delhi
9990771857 Call Girls in Dwarka Sector 7 Delhi (Call Girls) Delhi9990771857 Call Girls in Dwarka Sector 7 Delhi (Call Girls) Delhi
9990771857 Call Girls in Dwarka Sector 7 Delhi (Call Girls) Delhi
 
Eldeco Dwarka Project In Delhi-brochure.pdf.pdf
Eldeco Dwarka Project In Delhi-brochure.pdf.pdfEldeco Dwarka Project In Delhi-brochure.pdf.pdf
Eldeco Dwarka Project In Delhi-brochure.pdf.pdf
 
Greater Vancouver Realtors Statistics Package April 2024
Greater Vancouver Realtors Statistics Package April 2024Greater Vancouver Realtors Statistics Package April 2024
Greater Vancouver Realtors Statistics Package April 2024
 
2k Shots ≽ 9205541914 ≼ Call Girls In Sainik Farm (Delhi)
2k Shots ≽ 9205541914 ≼ Call Girls In Sainik Farm (Delhi)2k Shots ≽ 9205541914 ≼ Call Girls In Sainik Farm (Delhi)
2k Shots ≽ 9205541914 ≼ Call Girls In Sainik Farm (Delhi)
 
Kohinoor Hinjewadi Phase 2 Pune E-Brochure.pdf
Kohinoor Hinjewadi Phase 2 Pune  E-Brochure.pdfKohinoor Hinjewadi Phase 2 Pune  E-Brochure.pdf
Kohinoor Hinjewadi Phase 2 Pune E-Brochure.pdf
 
2k Shot Call girls Aiims Delhi 9205541914
2k Shot Call girls Aiims Delhi 92055419142k Shot Call girls Aiims Delhi 9205541914
2k Shot Call girls Aiims Delhi 9205541914
 
Majestique Viman Nagar Pune Brochure.pdf
Majestique Viman Nagar Pune Brochure.pdfMajestique Viman Nagar Pune Brochure.pdf
Majestique Viman Nagar Pune Brochure.pdf
 
9990771857 Call Girls in Dwarka Sector 08 Delhi (Call Girls) Delhi
9990771857 Call Girls in Dwarka Sector 08 Delhi (Call Girls) Delhi9990771857 Call Girls in Dwarka Sector 08 Delhi (Call Girls) Delhi
9990771857 Call Girls in Dwarka Sector 08 Delhi (Call Girls) Delhi
 
Prestige Sancoale Goa Residneces Brochure.pdf
Prestige Sancoale Goa Residneces Brochure.pdfPrestige Sancoale Goa Residneces Brochure.pdf
Prestige Sancoale Goa Residneces Brochure.pdf
 

FNB_Gauteng Sub-Region House Price Indices

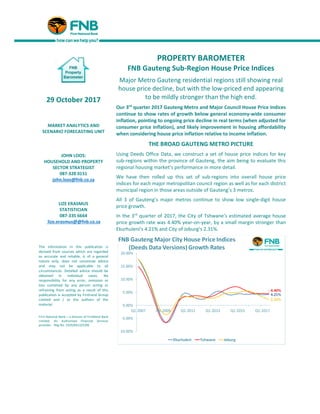
  • 1. 29 October 2017 MARKET ANALYTICS AND SCENARIO FORECASTING UNIT JOHN LOOS: HOUSEHOLD AND PROPERTY SECTOR STRATEGIST 087-328 0151 john.loos@fnb.co.za LIZE ERASMUS STATISTICIAN 087-335 6664 lize.erasmus@@fnb.co.za The information in this publication is derived from sources which are regarded as accurate and reliable, is of a general nature only, does not constitute advice and may not be applicable to all circumstances. Detailed advice should be obtained in individual cases. No responsibility for any error, omission or loss sustained by any person acting or refraining from acting as a result of this publication is accepted by Firstrand Group Limited and / or the authors of the material. First National Bank – a division of FirstRand Bank Limited. An Authorised Financial Services provider. Reg No. 1929/001225/06 PROPERTY BAROMETER FNB Gauteng Sub-Region House Price Indices Major Metro Gauteng residential regions still showing real house price decline, but with the low-priced end appearing to be mildly stronger than the high end. Our 3rd quarter 2017 Gauteng Metro and Major Council House Price Indices continue to show rates of growth below general economy-wide consumer inflation, pointing to ongoing price decline in real terms (when adjusted for consumer price inflation), and likely improvement in housing affordability when considering house price inflation relative to income inflation. THE BROAD GAUTENG METRO PICTURE Using Deeds Office Data, we construct a set of house price indices for key sub-regions within the province of Gauteng, the aim being to evaluate this regional housing market’s performance in more detail. We have then rolled up this set of sub-regions into overall house price indices for each major metropolitan council region as well as for each district municipal region in those areas outside of Gauteng’s 3 metros. All 3 of Gauteng’s major metros continue to show low single-digit house price growth. In the 3rd quarter of 2017, the City of Tshwane’s estimated average house price growth rate was 4.40% year-on-year, by a small margin stronger than Ekurhuleni’s 4.21% and City of Joburg’s 2.31%.
  • 2. REAL HOUSE PRICE PERFORMANCES With Gauteng Consumer Price Index (CPI) Inflation at 4.8% year-on-year for the 3rd quarter of 2017, these low nominal house price growth rates translate into house price declines in real terms (when adjusted for CPI), Tshwane to the tune of -0.3% year-on-year, Ekurhuleni -0.5% and Joburg -2.3%. The 3 Gauteng Metros have been undergoing a gradual real house price correction for much of the time since the beginning of 2008. Since the 1st quarter of 2008, Tshwane’s cumulative real house price decline has been -22.3%, Joburg -24.25% and Ekurhuleni -25.5%. WE ZOOM IN ON THE CITY OF JOBURG’S MAIN REGIONS….MEDIOCRE GROWTH EVERYWHERE, WITH THE FORMER TOWNSHIP REGION AROUND SOWETO SHOWING THE HIGHEST GROWTH There are no strong “outperforming” regions in Gauteng of late. Over the past 5 years, the lowest income region, i.e. the former “township” region of Diepkloof-Soweto-Meadowlands-Pimville has shown the strongest cumulative growth of 42.82%, with the Midrand-Diepsloot region a distant second with 26.33% cumulative growth. At the weak end, the highest priced region of “Sandton and Surrounds” has grown the slowest growth off the highest base, i.e. 17.92%.
  • 3. More recently, the Diepkloof-Soweto-Meadowlands-Pimville region remains the highest estimated house price growth region at 4.28% year-on-year in the 3rd quarter of 2017. However, this price growth rate itself is weak, negative in real terms, and only slightly above the other low end region of Lenasia-Orange Farm-Ennerdale- Lawley, at 4.04%. Nevertheless, this would suggest that the City of Joburg lower price markets are a little stronger, and the high end weaker, with the most expensive “Sandton and Surrounds” end measuring a very slight -0.1% year-on-year price decline. TSHWANE – ALSO HINTING AT SLIGHTLY STRONGER LOWER END MARKETS In Tshwane, the relative market strength of late also appears to have been more at the low end. Over the past 5 years, cumulative house price growth within Tshwane is estimated to have been the strongest in the Winterveldt-Mabopane-Soshanguve-Ga-Rankuwa-Hammanskraal region, to the tune of 66.98%. In such former “township” regions, care must be taken with interpretation, because where Government subsidized “RDP” homes are transferred to their new owners, the registered amount in the deeds data can be below market value, meaning that a repeat sale can come off an artificially low base.
  • 4. However, another low end area, Pretoria West, shows the 2nd highest cumulative growth to the tune of 42.11%, followed by Pretoria North East with 32.44%, also thus pointing to low end markets having done a little better than higher priced regions in recent years. In the 3rd quarter of 2017, those 3 same regions again came out as the 3 highest price growth regions too. EKURHULENI SUB-REGION PERFORMANCE Ekurhuleni also appears to have experienced greater market strength at the lower end. Some of the strongest cumulative house price growth over the past 5 years was seen in the lowest average priced areas, namely Tokoza- Vosloorus-Katlehong with 44.33%, Nigel with 37.91%, Brakpan with 30.81% and Springs by 28.49%. Those 4 regions are the 4 lowest average house price regions in Ekurhuleni. Olifantsfontein region, a relatively high priced region by Ekurhuleni standards, in excess of R800,000 (R805,000) showed very strong growth of 40.85%, but we believe that this is in part due to difficulty in eliminating much of the “land-to-building” effect on the repeat sales index, as this is a relatively new area with much building activity in recent years. Other higher end areas with average prices above R800,000 (higher by Ekurhuleni standards) such as Alberton (16.97%) and Edenvale (16.7%) had relatively low cumulative house price growth.
  • 5. In the 3rd quarter of 2017, it remained the lower average price end that seemed to do better, with Nigel (18.6%), Tokoza-Vosloorus-Katlehong (11.8%) and Brakpan (6.94%) being the strongest 3 regions price growth-wise. THE MANUFACTURING-DEPENDENT EMFULENI REGION APPEARS TO REMAIN THE MOST DEPRESSED HOUSING MARKET The Emfuleni District, which includes major towns of Van der Bijl Park and Vereeniging, is heavily Manufacturing dependent, and the Manufacturing Sector in South Africa has been in the doldrums in recent years. The Van der Bijl Park area is especially Manufacturing-heavy. This, we believe, has had an influence on cumulative Emfuleni house price growth of only 21.65% over the past 5 years, but more specifically on the Van der Bijl Park region’s weak 16.03% cumulative house price growth.
  • 6. As at the 3rd quarter of 2017, the region’s year-on-year percentage change was very weak at a slightly positive +0.07% rate, with Van der Bijl’s negative -0.41% rate being the weakest sub-region of Emfuleni CONCLUSION Although the Gauteng residential markets don’t show any great strength at present, there appears to be a broad pattern of low priced sub-regions performing a little better than the high-priced end. This appears to tie in with what the FNB Estate Agent Survey tells us regarding 1st time buyer levels in Gauteng’s Metros, i.e. that in the 2017 year-to-date, estimated 1st time buying in Greater Joburg was 26.62% of total home buying, and 24.3% in Tshwane, both percentages being relatively strong and above the national average of 20.26%. Solid 1st time buying in the province may be a key source of support for the low end of the housing market. At the high priced end in each metro, on the other hand, confidence in the country’s economic future can be a reason for buyer caution amongst higher income groups, while it is also arguably about the high running and transaction costs related to higher value homes that comes with municipal rates and tariffs rising at rates well-above general inflation in recent years, and higher transfer duty brackets at the high end. However, while the low priced end appears to be stronger than higher up the price ladder, broadly speaking, it is by no means very strong either. Down in the Emfuleni Regions near the Vaal River, the Manufacturing-dependent Van der Bijl Park appears to stand out as the weakest housing region in Gauteng.
  • 7. HOUSE PRICE GROWTH SUMMARY TABLES Q4-2016 Q1-2017 Q2-2017 Q3-2017 Cumulative 15- year growth Cumulative 5- year growth CITY OF JOHANNESBURG TOTAL 3.79% 3.26% 2.77% 2.31% 248.88% 22.10% Johannesburg 4.29% 3.65% 2.57% 1.53% 279.65% 20.13% Johannesburg South 4.65% 3.97% 3.32% 2.67% 271.02% 20.19% Diepkloof-Soweto-Meadowlands-Pimville 3.71% 3.10% 3.28% 4.28% 831.22% 42.82% Midrand_Diepsloot 4.78% 4.26% 3.46% 2.68% 243.43% 26.33% Randburg 3.68% 3.44% 3.46% 3.56% 197.02% 20.63% Roodepoort 2.21% 2.21% 2.82% 3.55% 201.10% 19.93% Sandton and Surrounds 2.35% 1.48% 0.62% -0.10% 167.55% 17.92% Lanasia-Orange Farm-Ennerdale-Lawley 5.51% 5.00% 4.27% 4.04% 378.42% 19.71% Quarterly year-on-year percentage change CITY OF JOHANNESBURG SUB-REGIONAL HOUSE PRICE INDICES – AVERAGE GROWTH RATES
  • 8. Q4-2016 Q1-2017 Q2-2017 Q3-2017 Cumulative 15- year growth Cumulative 5- year growth CITY OF TSHWANE ROLL UP 4.52% 4.54% 4.52% 4.40% 231.54% 29.69% Akasia 1.84% 2.39% 3.90% 5.51% 263.93% 23.94% Bronkhorstspruit-Cullinan- Rayton-Ekangala-Refilwe 4.60% 4.56% 3.17% -0.46% 274.04% 14.74% Centurion 4.88% 4.44% 3.87% 3.26% 194.83% 29.19% Pretoria-Roodeplaat 4.11% 4.50% 4.68% 4.46% 209.41% 26.76% Winterveldt-Mabopane- Soshanguve-GaRankuwa- Hammanskraal-Kudube- Themba 12.61% 10.77% 11.18% 13.14% 607.26% 66.98% Pretoria Central 3.78% 5.80% 7.00% 7.19% 362.17% 23.33% Pretoria East 5.27% 4.53% 3.79% 3.24% 177.35% 27.36% Pretoria North 3.52% 4.20% 4.62% 4.73% 212.96% 23.77% Pretoria North East 4.68% 6.60% 8.53% 8.91% 297.32% 32.44% Pretoria South East -0.93% 0.20% 0.20% 0.01% 205.06% 21.42% Pretoria West 5.44% 8.17% 10.67% 12.59% 420.43% 42.11% PRETORIA ROLL UP 4.56% 5.33% 5.99% 6.28% 241.11% 30.00% Quarterly year-on-year percentage change CITY OF TSHWANE SUB-REGIONAL HOUSE PRICE INDICES – AVERAGE GROWTH RATES
  • 9. Q4-2016 Q1-2017 Q2-2017 Q3-2017 Cumulative 15- year growth Cumulative 5- year growth EKURHULENI 4.17% 4.03% 4.06% 4.21% 289.06% 24.26% Alberton 2.47% 2.91% 2.80% 2.31% 232.77% 16.97% Benoni 2.65% 1.80% 1.62% 1.77% 207.77% 15.08% Boksburg 3.35% 2.56% 1.91% 1.27% 219.20% 16.88% Brakpan 6.46% 7.42% 7.78% 6.94% 329.32% 30.81% Edenvale 1.01% 0.43% 0.11% -0.17% 213.03% 16.70% Germiston 3.69% 4.30% 4.42% 3.95% 260.43% 21.39% Kempton Park 4.84% 5.12% 5.03% 5.03% 268.61% 22.93% Nigel 8.78% 10.09% 13.88% 18.61% 448.82% 37.91% Olifantsfontein 5.94% 2.87% 0.23% -1.38% 1033.04% 40.85% Springs 3.65% 3.13% 3.24% 4.00% 323.52% 28.49% Tokoza-Voloorus-Katlehong 3.42% 4.93% 7.50% 11.80% 782.68% 44.33% Quarterly year-on-year percentage change CITY OF EKURHULENI SUB-REGIONAL HOUSE PRICE INDICES – AVERAGE GROWTH RATES
  • 10. Q4-2016 Q1-2017 Q2-2017 Q3-2017 Cumulative 15- year growth Cumulative 5- year growth EMFULENI 3.83% 2.84% 1.01% 0.07% 353.85% 21.65% Evaton-Sebokeng 12.79% 10.09% 5.02% 3.89% 615.25% 63.77% Vaal-Vanderbijlpark 1.62% 0.70% -0.44% -0.41% 333.60% 16.03% Vereeniging 3.93% 4.54% 4.06% 2.90% 313.72% 21.76% Quarterly year-on-year percentage change Q4-2016 Q1-2017 Q2-2017 Q3-2017 Cumulative 15- year growth Cumulative 5- year growth MOGALE CITY 2.37% 3.12% 4.23% 5.09% 262.26% 26.12% Krugersdorp-Magaliesburg-Mogale 3.33% 3.32% 3.00% 2.21% 226.41% 22.98% Randfontein 0.25% 3.61% 8.48% 13.88% 291.55% 28.05% Quarterly year-on-year percentage change Q4-2016 Q1-2017 Q2-2017 Q3-2017 Cumulative 15- year growth Cumulative 5- year growth LESEDI 0.94% -1.75% -3.74% -4.17% 244.15% 9.62% MERAFONG 5.57% 2.84% 2.22% 1.79% 306.09% 9.56% MIDVAAL 2.85% 5.60% 8.21% 9.70% 339.00% 36.14% WESTONARIA 10.67% 13.66% 14.41% 15.26% 545.56% 38.78% Quarterly year-on-year percentage change