SlideShare a Scribd company logo
1 of 5
Download to read offline
PROPERTY BAROMETER – FNB Area Value Band House Price
Indices
The Luxury Area Value Band has seen the most significant price growth slowdown
since 2014, while the Lower End has done better in recent quarters. But there may be
signs of the higher end starting to “stabilise”
13 February 2018
FNB AREA VALUE BAND HOUSE PRICE INDEX PERFORMANCES
We compile 5 FNB Area Value Band House Price Indices (see note at the end of this report regarding the
methodology). These indices group areas according to their average home transaction values, using deeds
data, and include all cities and towns in South Africa.
The 5 indices are the Luxury Area House Price Index (Average Price = R2.335 million), the Upper Income Area
House Price Index (Average Price = R1.242 million), the Middle Income Area House Price Index (Average Price
= R887,930), the Lower Middle Income Area House Price Index (Average Price = R583,858), and the Low
Income Area House Price Index (Average Price = R362,110)
The 4th
quarter 2017 results show some further slowing in the year-on-year house price growth rates of the
3 highest priced area value bands, but some further acceleration in the growth of the 2 lowest priced ones.
The Low Income Area House Price Index was again the strongest performer in terms of year-on-year house
price growth, recording 14.2% year-on-year for the 4th
quarter. This is an acceleration on the prior quarter’s
revised 13.5%.
We must caution, however, about major potential distortions in this index. This index includes the subsidized
housing component, and new homes in
this category, which are not sold to their
new owners, are registered at a value with
the deeds office which does not reflect any
market value. Over the years, there have
also been periodic sell-offs of rental stock
by councils which have not necessarily
taken place at market value. Such
distortions mean that in a repeat sales
index for Low Income Areas, many homes
prices come of a very low base not
reflective of market values, and show
major price inflation when resold at
market value at a later stage. We are thus
very careful as to how we interpret the
results in this Low Income Area Value Band.
Moving 1 value band up, however, we perhaps see more reliable support for the view that the lower end has
recently been showing relative strength, with some acceleration in the Lower-Middle Income Area Value
Band’s year-on-year house price growth, from a 3rd
quarter 7.1% to 7.6% in the 4th
quarter. This value band
now boasts the 2nd
highest average house price growth.
In the 3 area value bands above this, however, year-on-year house price growth slowed in the 4th
quarter of
2017, the Middle Income Area Value Band from 4.9% in the 3rd
quarter to 4.7%, the Upper Income Area Value
Band also from 4.9% to 4.7%, and the Luxury Area Value Band from 5.6% to 5.1%.
Therefore, while not yet having the slowest year-on-year house price growth, the Luxury Area Valua Band’s
rate has again slowed the most noticeably in the 4th
quarter of 2017.
On a quarter-on-quarter basis, a better indicator of recent price growth momentum than the year-on-year
calculation, there has been a strong convergence of the 3 highest priced area value bands. The Luxury Income
Area Value Band showed quarter-on-quarter growth of 1.2% in the 4th
quarter, while the Upper and Middle
Income Areas Value Bands showed slightly slower 1.1% growth.
Noticeably higher growth was seen in the
Lower Middle Income Area Value Band, to
the tune of 1.9%, and Low Income Areas
(with all the above-mentioned warnings)
at 3.8%.
This, in short, all points to superior
performance at the lower-priced end of
the market where average process are
well-below R1m.
However, the quarter-on-quarter house
price growth rates for the top 3 value
bands were all unchanged from their rates
in the previous quarter, possibly
suggesting that these market are heading towards “stabilization”, and the end of slowing house price growth.
The most significant year-on-year house price growth slowing in recent years has been in the Luxury Area
Value Band, from an 11% high back in the final quarter of 2014 to the most recent 5.1%, followed by the
Upper Income Value Band whose growth has slowed from 7.4% at the end of 2014 to 4.7%. But stabilizing
quarter-on-quarter growth rates of late may suggest that this year-on-year slowing is near its end.
FNB’S VALUERS HAVE ALSO PERCEIVED A MORE NOTICEABLE HIGH END WEAKENING OFF A HIGHER BASE
The more significant softening off a higher growth base by the higher end appears to tie in with what FNB’s
Valuers perceive about the market.
In the FNB Valuers’ Market Strength
Indices (MSI) by Income Areas (self-
defined by the valuers), the Upper Income
Area MSI has weakened the most, from a
multi-year high of 54.98 at the end of
2015 to 51.43 in the 4th
quarter of 2017.
By comparison , the Middle Income Area
MSI has declined slightly from 51.13 in the
3rd
quarter of 2015 to 50.35 in the 4th
quarter of 2017, while the Lower Income
Area MSI is marginally up from an end-of-
2015 48.86, to 49.77 in the final quarter of
2017.
In the past 2 quarters, the valuers as a group have even perceived a slight strengthening at the Lower Income
Area End.
The High End of the market thus appears to have led the slowdown of recent years
FNB ESTATE AGENT SURVEY ALSO POINTS TO MORE NOTICEABLE SLOWING AT UPPER END SINCE 2014
The more significant upper end slowing
has also been apparent in the FNB Estate
Agent Survey in recent years.
Upper End homes tend to “naturally” stay
on the market for a longer time on
average prior to sales than is the case at
the lower priced end.
However, from 2015 onward we began to
notice a widening in the gap in average
time of homes on the market between the
Luxury (High Net Worth) and Upper
Income Area segments on the one hand,
and the Middle and Lower Income Area
segments on the other hand.
We must just mention that our agent survey’s income areas are self-defined by agents, so average home
values per segment differ markedly from our own area value band segmentations.
In 2014, the “Lower Income” Area segment (average value = R1.086 million) showed an average time of
homes on the market of 11.54 weeks. This average time has shortened to a 9.43 weeks average for the entire
2017. Middle Income Areas (average price = R2.067 million) saw average time on market go higher from a
10.18 weeks average in 2014 to 14.36 weeks in 2017. The increase in average time on the market in the
Upper Income Area segment (average price = R2.955 million) was also significant, from 13.36 weeks in 2014
to 17.71 weeks in 2017. But the most significant increase in average time on the market was to be found in
the “High Net Worth” Areas (average value = R6.193 million), rising from 15.86 weeks in 2014 to 23.25 weeks
2017.
In short, since 2014, the higher up the income area ladder we go the more significant the rise in average time
of homes on the market appears to have been from 2014 to 2017. This picture broadly ties in with the FNB
Area Value Band House Price Index picture, where the Luxury Area Value Band has shown the most
significant slowing off a higher price growth base.
IN CONCLUSION
The house price growth differential between the 3 highest priced FNB Area Value Band House Price Indices
has narrowed of late, with all 3 of these segments having shown recent growth slowing. But unchanged
quarter-on-quarter growth rates in the 3 most expensive area value bands suggests that slowing year-on-
year growth in these 3 value bands may be near its end.
However, the Lower Middle Income and Low Income Area Value Bands saw further accelerations in house
price growth in the 4th
quarter, and outperformed the rest.
Sentiment in South Africa early in 2018 seems improved, leading economic indicators have been pointing
towards a strengthening economy in the near term, and it seems plausible that 2018 could be a mildly
stronger year for all housing market segments. However, we believe that despite any economic improvement
the Household Sector will remain financially constrained, searching for home affordability as a result, and
that this will lead to the lower priced value bands continuing to outperform the higher end this year.
JOHN LOOS:
HOUSEHOLD AND PROPERTY SECTOR STRATEGIST
MARKET ANALYTICS AND SCENARIO FORECASTING UNIT: FNB HOME LOANS
Tel: 087-328 0151
John.loos@fnb.co.za
The information in this publication is derived from sources which are regarded as accurate and reliable, is of a general nature only, does not constitute
advice and may not be applicable to all circumstances. Detailed advice should be obtained in individual cases. No responsibility for any error, omission
or loss sustained by any person acting or refraining from acting as a result of this publication is accepted by Firstrand Group Limited and / or the authors
of the material.
First National Bank – a division of FirstRand Bank Limited. An Authorised Financial Services provider. Reg No. 1929/001225/06
Note:
The FNB Area Value Band House Price Indices are derived from Deeds Office Data, utilizing only property
transactions by individuals (“natural persons”). There are 5 Area Value Band Indices. The areas are grouped
into quintiles according to their average transaction price over the 5 years from 2012 to 2016. A quintile does
not represent 20% of all areas, but rather a group of areas whose transaction volume (also over the 5 year
period 2012 to 2016) accounts for 20% of total transaction volume. For example, Quintile 1, named the
“Luxury Area Value Band”, is the group of areas with the highest transaction price averages in South Africa,
making up 20% of the total volume of property transactions by individuals.
The indices are named as follows:
Quintile 1 – Luxury Area Value Band House Price Index
Quintile 2 – Upper Income Area Value Band House Price Index
Quintile 3 – Middle Income Area Value Band House Price Index
Quintile 4 – Lower Middle Income Area Value Band House Price Index
Quintile 5 – Low Income Area Value Band House Price Index
The index methodology used is a “repeat sales” methodology
Given that deeds data is a different dataset to our monthly FNB National House Price Index, and more dated
than our own FNB data, the Area Value Band Indices are not exactly comparable with it.
Note on the FNB Valuers’ Market Strength Index: *When an FNB valuer values a property, he/she is required
to provide a rating of demand as well as supply for property in the specific area. The demand and supply
rating categories are a simple “good (100)”, “average (50)”, and “weak (0)”. From all of these ratings we
compile an aggregate demand and an aggregate supply rating, which are expressed on a scale of 0 to 100.
After aggregating the individual demand and supply ratings, we subtract the aggregate supply rating from
the demand rating, add 100 to the difference, and divide by 2, so that the FNB Valuers’ Residential Market
Strength Index is also depicted on a scale of 0 to 100 with 50 being the point where supply and demand are
equal.
2015 2016 2017 Q1-2017 Q2-2017 Q3-2017 Q4-2017
HOUSE PRICE INDICES BY AREA VALUE BAND
Luxury Areas (Index Q1 2001 = 100) 587.7 640.8 679.9 667.6 676.0 684.0 692.0
- year-on-year % change 10.7% 9.0% 6.1% 7.3% 6.4% 5.6% 5.1%
- quarter-on-quarter % change 1.4% 1.3% 1.2% 1.2%
Upper Income Areas (Index Q1 2001 = 100) 479.0 510.0 536.2 527.0 533.2 539.2 545.4
- year-on-year % change 7.1% 6.5% 5.1% 5.7% 5.3% 4.9% 4.7%
- quarter-on-quarter % change 1.2% 1.2% 1.1% 1.1%
Middle Income Areas (Index Q1 2001 = 100) 482.5 508.5 534.0 524.9 531.1 537.0 543.0
- year-on-year % change 6.0% 5.4% 5.0% 5.2% 5.1% 4.9% 4.7%
- quarter-on-quarter % change 1.3% 1.2% 1.1% 1.1%
Lower-Middle Income Areas (Index Q1 2001 = 100) 555.1 591.0 631.2 613.5 624.9 637.3 649.3
- year-on-year % change 6.8% 6.5% 6.8% 6.0% 6.5% 7.1% 7.6%
- quarter-on-quarter % change 1.6% 1.9% 2.0% 1.9%
Low Income Areas (Index Q1 2001 = 100) 722.3 822.0 931.1 884.5 911.7 946.3 982.1
- year-on-year % change 13.3% 13.8% 13.3% 12.7% 12.7% 13.5% 14.2%
- quarter-on-quarter % change 2.9% 3.1% 3.8% 3.8%
AVERAGE HOUSE PRICE INDEX BY AREA VALUE BAND

More Related Content

What's hot

Putnam Fixed Income Outlook q313
Putnam Fixed Income Outlook q313Putnam Fixed Income Outlook q313
Putnam Fixed Income Outlook q313
Putnam Investments
 
Risks to China Outlook Intensify
Risks to China Outlook IntensifyRisks to China Outlook Intensify
Risks to China Outlook Intensify
Hayden Briscoe
 

What's hot (20)

Putnam Perspectives: Capital Markets Outlook Q3 2014
Putnam Perspectives: Capital Markets Outlook Q3 2014Putnam Perspectives: Capital Markets Outlook Q3 2014
Putnam Perspectives: Capital Markets Outlook Q3 2014
 
Putnam Fixed Income Outlook q313
Putnam Fixed Income Outlook q313Putnam Fixed Income Outlook q313
Putnam Fixed Income Outlook q313
 
Investment Insights for August, 2017
Investment Insights for August, 2017Investment Insights for August, 2017
Investment Insights for August, 2017
 
Putnam Outlook Q3 2013
Putnam Outlook Q3 2013Putnam Outlook Q3 2013
Putnam Outlook Q3 2013
 
Project- Eaman Kaur
Project- Eaman KaurProject- Eaman Kaur
Project- Eaman Kaur
 
Japan_Equity_Strategy
Japan_Equity_StrategyJapan_Equity_Strategy
Japan_Equity_Strategy
 
Saxo Bank Q3.pdf
Saxo Bank Q3.pdfSaxo Bank Q3.pdf
Saxo Bank Q3.pdf
 
Mercer Capital's Bank Watch | December 2019 | 2020 Outlook: Good Fundamentals...
Mercer Capital's Bank Watch | December 2019 | 2020 Outlook: Good Fundamentals...Mercer Capital's Bank Watch | December 2019 | 2020 Outlook: Good Fundamentals...
Mercer Capital's Bank Watch | December 2019 | 2020 Outlook: Good Fundamentals...
 
Putnam Perspectives: Fixed Income Outlook Q1 2014
Putnam Perspectives: Fixed Income Outlook Q1 2014Putnam Perspectives: Fixed Income Outlook Q1 2014
Putnam Perspectives: Fixed Income Outlook Q1 2014
 
Risks to China Outlook Intensify
Risks to China Outlook IntensifyRisks to China Outlook Intensify
Risks to China Outlook Intensify
 
The New Forex Fundamentals: Effectively Scanning Global Markets - Vantage FX
The New Forex Fundamentals: Effectively Scanning Global Markets - Vantage FXThe New Forex Fundamentals: Effectively Scanning Global Markets - Vantage FX
The New Forex Fundamentals: Effectively Scanning Global Markets - Vantage FX
 
Putnam Perspectives: Fixed-Income Outlook Q3 2014
Putnam Perspectives: Fixed-Income Outlook Q3 2014Putnam Perspectives: Fixed-Income Outlook Q3 2014
Putnam Perspectives: Fixed-Income Outlook Q3 2014
 
Capital Markets Insights - Q4 2016
Capital Markets Insights - Q4 2016Capital Markets Insights - Q4 2016
Capital Markets Insights - Q4 2016
 
Intralinks Deal Flow Predictor
Intralinks Deal Flow PredictorIntralinks Deal Flow Predictor
Intralinks Deal Flow Predictor
 
TAP QuarterlyLetter 201603
TAP QuarterlyLetter 201603TAP QuarterlyLetter 201603
TAP QuarterlyLetter 201603
 
Axis credit risk fund
Axis credit risk fundAxis credit risk fund
Axis credit risk fund
 
Axis corporate debt fund
Axis corporate debt fund Axis corporate debt fund
Axis corporate debt fund
 
Investment Mid year outlook by Linked Investments, Ltd
Investment Mid year outlook by Linked Investments, LtdInvestment Mid year outlook by Linked Investments, Ltd
Investment Mid year outlook by Linked Investments, Ltd
 
BOJ_Policy
BOJ_PolicyBOJ_Policy
BOJ_Policy
 
Monetary policy
Monetary policyMonetary policy
Monetary policy
 

Similar to FNB_AREA VALUE BAND HOUSE PRICE INDEX

Luxury Market Report NorthAmerica DEC'23
Luxury Market Report NorthAmerica DEC'23Luxury Market Report NorthAmerica DEC'23
Luxury Market Report NorthAmerica DEC'23
Lynne Watanabe-MacFarlane
 

Similar to FNB_AREA VALUE BAND HOUSE PRICE INDEX (20)

FNB HPI March 2017
FNB HPI March 2017FNB HPI March 2017
FNB HPI March 2017
 
FNB_House Price Index
FNB_House Price IndexFNB_House Price Index
FNB_House Price Index
 
FNB_House Price Indices by Segment
FNB_House Price Indices by SegmentFNB_House Price Indices by Segment
FNB_House Price Indices by Segment
 
FNB 2017 House Price Index Performance
FNB 2017 House Price Index PerformanceFNB 2017 House Price Index Performance
FNB 2017 House Price Index Performance
 
FNB_Estate Agent Survey
FNB_Estate Agent SurveyFNB_Estate Agent Survey
FNB_Estate Agent Survey
 
FNB_House Price Index_Nov 2017
FNB_House Price Index_Nov 2017FNB_House Price Index_Nov 2017
FNB_House Price Index_Nov 2017
 
FNB House Price Index_Sept 2017
FNB House Price Index_Sept 2017FNB House Price Index_Sept 2017
FNB House Price Index_Sept 2017
 
FNB_Price Realism and Market Balance
FNB_Price Realism and Market BalanceFNB_Price Realism and Market Balance
FNB_Price Realism and Market Balance
 
FNB Residential Property Monthly March
FNB Residential Property Monthly MarchFNB Residential Property Monthly March
FNB Residential Property Monthly March
 
FNB Residential Property Monthly_March
FNB Residential Property Monthly_MarchFNB Residential Property Monthly_March
FNB Residential Property Monthly_March
 
FNB_Home Buying Estate Agent Survey
FNB_Home Buying Estate Agent SurveyFNB_Home Buying Estate Agent Survey
FNB_Home Buying Estate Agent Survey
 
FNB_Gauteng Sub-Region House Price Indices
FNB_Gauteng Sub-Region House Price IndicesFNB_Gauteng Sub-Region House Price Indices
FNB_Gauteng Sub-Region House Price Indices
 
FNB_Gauteng HPI_Jul 2017
FNB_Gauteng HPI_Jul 2017FNB_Gauteng HPI_Jul 2017
FNB_Gauteng HPI_Jul 2017
 
FNB_Residential Maintenance and Upgrades
FNB_Residential Maintenance and UpgradesFNB_Residential Maintenance and Upgrades
FNB_Residential Maintenance and Upgrades
 
Luxury Market Report NorthAmerica DEC'23
Luxury Market Report NorthAmerica DEC'23Luxury Market Report NorthAmerica DEC'23
Luxury Market Report NorthAmerica DEC'23
 
Housing market assessment greater toronto area - 1 st quarter 2017
Housing market assessment   greater toronto area - 1 st quarter 2017Housing market assessment   greater toronto area - 1 st quarter 2017
Housing market assessment greater toronto area - 1 st quarter 2017
 
FNB_Secondary Home Buying
FNB_Secondary Home BuyingFNB_Secondary Home Buying
FNB_Secondary Home Buying
 
FNB_Provincial and Major Metro House Price Indices
FNB_Provincial and Major Metro House Price IndicesFNB_Provincial and Major Metro House Price Indices
FNB_Provincial and Major Metro House Price Indices
 
Mercer Capital's Value Focus: Real Estate Industry | Q1 2017 | Segment Focus:...
Mercer Capital's Value Focus: Real Estate Industry | Q1 2017 | Segment Focus:...Mercer Capital's Value Focus: Real Estate Industry | Q1 2017 | Segment Focus:...
Mercer Capital's Value Focus: Real Estate Industry | Q1 2017 | Segment Focus:...
 
Ingh0101 ing home autumn buyers guide full guide with appendix
Ingh0101 ing home autumn buyers guide full guide with appendixIngh0101 ing home autumn buyers guide full guide with appendix
Ingh0101 ing home autumn buyers guide full guide with appendix
 

More from Berty Van Staaden

More from Berty Van Staaden (20)

FNB_Property Barometer - September
FNB_Property Barometer - SeptemberFNB_Property Barometer - September
FNB_Property Barometer - September
 
Lightstone House Price Index_August 2019
Lightstone House Price Index_August 2019Lightstone House Price Index_August 2019
Lightstone House Price Index_August 2019
 
FNB_Gauteng House Price Index
FNB_Gauteng House Price IndexFNB_Gauteng House Price Index
FNB_Gauteng House Price Index
 
FNB Property Insights SARB Leading Indicator_August 2019
FNB Property Insights SARB Leading Indicator_August 2019FNB Property Insights SARB Leading Indicator_August 2019
FNB Property Insights SARB Leading Indicator_August 2019
 
PayProp Rental Index Q2 2019
PayProp Rental Index Q2 2019PayProp Rental Index Q2 2019
PayProp Rental Index Q2 2019
 
FNB Residential Building Stats_Q2 2019
FNB Residential Building Stats_Q2 2019FNB Residential Building Stats_Q2 2019
FNB Residential Building Stats_Q2 2019
 
FNB Property Insights August 2019
FNB Property Insights August 2019FNB Property Insights August 2019
FNB Property Insights August 2019
 
FNB Property Barometer (CPTt)_Aug 2019
FNB Property Barometer (CPTt)_Aug 2019FNB Property Barometer (CPTt)_Aug 2019
FNB Property Barometer (CPTt)_Aug 2019
 
FNB_Property Insights_Retail Property's Consumer Challenges
FNB_Property Insights_Retail Property's Consumer ChallengesFNB_Property Insights_Retail Property's Consumer Challenges
FNB_Property Insights_Retail Property's Consumer Challenges
 
Lightstone_Residential Property Indices_July 2019
Lightstone_Residential Property Indices_July 2019Lightstone_Residential Property Indices_July 2019
Lightstone_Residential Property Indices_July 2019
 
FNB_Rental Market
FNB_Rental MarketFNB_Rental Market
FNB_Rental Market
 
FNB Market Activity Ratings_July 2019
FNB Market Activity Ratings_July 2019FNB Market Activity Ratings_July 2019
FNB Market Activity Ratings_July 2019
 
FNB May Building Statistics (Jul 2019)
FNB May Building Statistics (Jul 2019)FNB May Building Statistics (Jul 2019)
FNB May Building Statistics (Jul 2019)
 
FNB Estate Agents Survey_Net Foreign Effect
FNB Estate Agents Survey_Net Foreign EffectFNB Estate Agents Survey_Net Foreign Effect
FNB Estate Agents Survey_Net Foreign Effect
 
Lightstone_Residential Property Indices May 2019
Lightstone_Residential Property Indices May 2019Lightstone_Residential Property Indices May 2019
Lightstone_Residential Property Indices May 2019
 
PayProp Rental Index Q 1 2019
PayProp Rental Index Q 1 2019PayProp Rental Index Q 1 2019
PayProp Rental Index Q 1 2019
 
FNB Residential Property Barometer_February 2019
FNB Residential Property Barometer_February 2019FNB Residential Property Barometer_February 2019
FNB Residential Property Barometer_February 2019
 
Lightstone Property Forecast for 2019
Lightstone Property Forecast for 2019Lightstone Property Forecast for 2019
Lightstone Property Forecast for 2019
 
Lightstone_Residential Property Indices_January 2019
Lightstone_Residential Property Indices_January 2019Lightstone_Residential Property Indices_January 2019
Lightstone_Residential Property Indices_January 2019
 
TPN_Vacancy Survey_Q3 2018
TPN_Vacancy Survey_Q3 2018TPN_Vacancy Survey_Q3 2018
TPN_Vacancy Survey_Q3 2018
 

Recently uploaded

9990771857 Call Girls in Dwarka Sector 1 Delhi (Call Girls) Delhi
9990771857 Call Girls in Dwarka Sector 1 Delhi (Call Girls) Delhi9990771857 Call Girls in Dwarka Sector 1 Delhi (Call Girls) Delhi
9990771857 Call Girls in Dwarka Sector 1 Delhi (Call Girls) Delhi
delhimodel235
 
Call Girls In Vasant Vihar Delhi 💯Call Us 🔝8264348440🔝
Call Girls In Vasant Vihar Delhi 💯Call Us 🔝8264348440🔝Call Girls In Vasant Vihar Delhi 💯Call Us 🔝8264348440🔝
Call Girls In Vasant Vihar Delhi 💯Call Us 🔝8264348440🔝
soniya singh
 
9990771857 Call Girls in Dwarka Sector 08 Delhi (Call Girls) Delhi
9990771857 Call Girls in Dwarka Sector 08 Delhi (Call Girls) Delhi9990771857 Call Girls in Dwarka Sector 08 Delhi (Call Girls) Delhi
9990771857 Call Girls in Dwarka Sector 08 Delhi (Call Girls) Delhi
delhimodel235
 
9990771857 Call Girls in Dwarka Sector 3 Delhi (Call Girls) Delhi
9990771857 Call Girls in Dwarka Sector 3 Delhi (Call Girls) Delhi9990771857 Call Girls in Dwarka Sector 3 Delhi (Call Girls) Delhi
9990771857 Call Girls in Dwarka Sector 3 Delhi (Call Girls) Delhi
delhimodel235
 
BPTP THE AMAARIO Luxury Project Invest Like Royalty in Sector 37D Gurgaon Dwa...
BPTP THE AMAARIO Luxury Project Invest Like Royalty in Sector 37D Gurgaon Dwa...BPTP THE AMAARIO Luxury Project Invest Like Royalty in Sector 37D Gurgaon Dwa...
BPTP THE AMAARIO Luxury Project Invest Like Royalty in Sector 37D Gurgaon Dwa...
ApartmentWala1
 
Best Deal Virtual Space in Satya The Hive Tata Zudio 750 Sqft 1.89 Cr All inc...
Best Deal Virtual Space in Satya The Hive Tata Zudio 750 Sqft 1.89 Cr All inc...Best Deal Virtual Space in Satya The Hive Tata Zudio 750 Sqft 1.89 Cr All inc...
Best Deal Virtual Space in Satya The Hive Tata Zudio 750 Sqft 1.89 Cr All inc...
ApartmentWala1
 
Call Girls In Laxmi Nagar Delhi +91-8447779280! !Best Woman Seeking Man Escor...
Call Girls In Laxmi Nagar Delhi +91-8447779280! !Best Woman Seeking Man Escor...Call Girls In Laxmi Nagar Delhi +91-8447779280! !Best Woman Seeking Man Escor...
Call Girls In Laxmi Nagar Delhi +91-8447779280! !Best Woman Seeking Man Escor...
asmaqueen5
 
Bptp The Amaario Launch Luxury Project Sector 37D Gurgaon Dwarka Expressway...
Bptp The Amaario Launch  Luxury Project  Sector 37D Gurgaon Dwarka Expressway...Bptp The Amaario Launch  Luxury Project  Sector 37D Gurgaon Dwarka Expressway...
Bptp The Amaario Launch Luxury Project Sector 37D Gurgaon Dwarka Expressway...
ApartmentWala1
 
9990771857 Call Girls in Dwarka Sector 2 Delhi (Call Girls) Delhi
9990771857 Call Girls in Dwarka Sector 2 Delhi (Call Girls) Delhi9990771857 Call Girls in Dwarka Sector 2 Delhi (Call Girls) Delhi
9990771857 Call Girls in Dwarka Sector 2 Delhi (Call Girls) Delhi
delhimodel235
 
9990771857 Call Girls in Dwarka Sector 6 Delhi (Call Girls) Delhi
9990771857 Call Girls in Dwarka Sector 6 Delhi (Call Girls) Delhi9990771857 Call Girls in Dwarka Sector 6 Delhi (Call Girls) Delhi
9990771857 Call Girls in Dwarka Sector 6 Delhi (Call Girls) Delhi
delhimodel235
 

Recently uploaded (20)

9990771857 Call Girls in Dwarka Sector 1 Delhi (Call Girls) Delhi
9990771857 Call Girls in Dwarka Sector 1 Delhi (Call Girls) Delhi9990771857 Call Girls in Dwarka Sector 1 Delhi (Call Girls) Delhi
9990771857 Call Girls in Dwarka Sector 1 Delhi (Call Girls) Delhi
 
Magarpatta Nova Elegance Mundhwa Pune E-Brochure.pdf
Magarpatta Nova Elegance Mundhwa Pune  E-Brochure.pdfMagarpatta Nova Elegance Mundhwa Pune  E-Brochure.pdf
Magarpatta Nova Elegance Mundhwa Pune E-Brochure.pdf
 
Premium Villa Projects in Sarjapur Road Bengaluru
Premium Villa Projects in Sarjapur Road BengaluruPremium Villa Projects in Sarjapur Road Bengaluru
Premium Villa Projects in Sarjapur Road Bengaluru
 
BDSM⚡Call Girls in Sector 57 Noida Escorts >༒8448380779 Escort Service
BDSM⚡Call Girls in Sector 57 Noida Escorts >༒8448380779 Escort ServiceBDSM⚡Call Girls in Sector 57 Noida Escorts >༒8448380779 Escort Service
BDSM⚡Call Girls in Sector 57 Noida Escorts >༒8448380779 Escort Service
 
Call Girls In Vasant Vihar Delhi 💯Call Us 🔝8264348440🔝
Call Girls In Vasant Vihar Delhi 💯Call Us 🔝8264348440🔝Call Girls In Vasant Vihar Delhi 💯Call Us 🔝8264348440🔝
Call Girls In Vasant Vihar Delhi 💯Call Us 🔝8264348440🔝
 
9990771857 Call Girls in Dwarka Sector 08 Delhi (Call Girls) Delhi
9990771857 Call Girls in Dwarka Sector 08 Delhi (Call Girls) Delhi9990771857 Call Girls in Dwarka Sector 08 Delhi (Call Girls) Delhi
9990771857 Call Girls in Dwarka Sector 08 Delhi (Call Girls) Delhi
 
Shapoorji Pallonji Joyville Vista Pune | Spend Your Family Time Together
Shapoorji Pallonji Joyville Vista Pune | Spend Your Family Time TogetherShapoorji Pallonji Joyville Vista Pune | Spend Your Family Time Together
Shapoorji Pallonji Joyville Vista Pune | Spend Your Family Time Together
 
Purva Soukhyam in Guduvancheri Chennai.pdf
Purva Soukhyam in Guduvancheri Chennai.pdfPurva Soukhyam in Guduvancheri Chennai.pdf
Purva Soukhyam in Guduvancheri Chennai.pdf
 
Enjoy Night ≽ 8448380779 ≼ Call Girls In Huda City Centre (Gurgaon)
Enjoy Night ≽ 8448380779 ≼ Call Girls In Huda City Centre (Gurgaon)Enjoy Night ≽ 8448380779 ≼ Call Girls In Huda City Centre (Gurgaon)
Enjoy Night ≽ 8448380779 ≼ Call Girls In Huda City Centre (Gurgaon)
 
2k Shot Call girls Aiims Delhi 9205541914
2k Shot Call girls Aiims Delhi 92055419142k Shot Call girls Aiims Delhi 9205541914
2k Shot Call girls Aiims Delhi 9205541914
 
9990771857 Call Girls in Dwarka Sector 3 Delhi (Call Girls) Delhi
9990771857 Call Girls in Dwarka Sector 3 Delhi (Call Girls) Delhi9990771857 Call Girls in Dwarka Sector 3 Delhi (Call Girls) Delhi
9990771857 Call Girls in Dwarka Sector 3 Delhi (Call Girls) Delhi
 
BPTP THE AMAARIO Luxury Project Invest Like Royalty in Sector 37D Gurgaon Dwa...
BPTP THE AMAARIO Luxury Project Invest Like Royalty in Sector 37D Gurgaon Dwa...BPTP THE AMAARIO Luxury Project Invest Like Royalty in Sector 37D Gurgaon Dwa...
BPTP THE AMAARIO Luxury Project Invest Like Royalty in Sector 37D Gurgaon Dwa...
 
Best Deal Virtual Space in Satya The Hive Tata Zudio 750 Sqft 1.89 Cr All inc...
Best Deal Virtual Space in Satya The Hive Tata Zudio 750 Sqft 1.89 Cr All inc...Best Deal Virtual Space in Satya The Hive Tata Zudio 750 Sqft 1.89 Cr All inc...
Best Deal Virtual Space in Satya The Hive Tata Zudio 750 Sqft 1.89 Cr All inc...
 
Call Girls In Laxmi Nagar Delhi +91-8447779280! !Best Woman Seeking Man Escor...
Call Girls In Laxmi Nagar Delhi +91-8447779280! !Best Woman Seeking Man Escor...Call Girls In Laxmi Nagar Delhi +91-8447779280! !Best Woman Seeking Man Escor...
Call Girls In Laxmi Nagar Delhi +91-8447779280! !Best Woman Seeking Man Escor...
 
Bptp The Amaario Launch Luxury Project Sector 37D Gurgaon Dwarka Expressway...
Bptp The Amaario Launch  Luxury Project  Sector 37D Gurgaon Dwarka Expressway...Bptp The Amaario Launch  Luxury Project  Sector 37D Gurgaon Dwarka Expressway...
Bptp The Amaario Launch Luxury Project Sector 37D Gurgaon Dwarka Expressway...
 
9990771857 Call Girls in Dwarka Sector 2 Delhi (Call Girls) Delhi
9990771857 Call Girls in Dwarka Sector 2 Delhi (Call Girls) Delhi9990771857 Call Girls in Dwarka Sector 2 Delhi (Call Girls) Delhi
9990771857 Call Girls in Dwarka Sector 2 Delhi (Call Girls) Delhi
 
9990771857 Call Girls in Dwarka Sector 6 Delhi (Call Girls) Delhi
9990771857 Call Girls in Dwarka Sector 6 Delhi (Call Girls) Delhi9990771857 Call Girls in Dwarka Sector 6 Delhi (Call Girls) Delhi
9990771857 Call Girls in Dwarka Sector 6 Delhi (Call Girls) Delhi
 
Enjoy Night ≽ 8448380779 ≼ Call Girls In Iffco Chowk (Gurgaon)
Enjoy Night ≽ 8448380779 ≼ Call Girls In Iffco Chowk (Gurgaon)Enjoy Night ≽ 8448380779 ≼ Call Girls In Iffco Chowk (Gurgaon)
Enjoy Night ≽ 8448380779 ≼ Call Girls In Iffco Chowk (Gurgaon)
 
The Gale at Godrej Park World Hinjewadi Pune Brochure.pdf
The Gale at Godrej Park World Hinjewadi Pune Brochure.pdfThe Gale at Godrej Park World Hinjewadi Pune Brochure.pdf
The Gale at Godrej Park World Hinjewadi Pune Brochure.pdf
 
Majestique Viman Nagar Pune Brochure.pdf
Majestique Viman Nagar Pune Brochure.pdfMajestique Viman Nagar Pune Brochure.pdf
Majestique Viman Nagar Pune Brochure.pdf
 

FNB_AREA VALUE BAND HOUSE PRICE INDEX

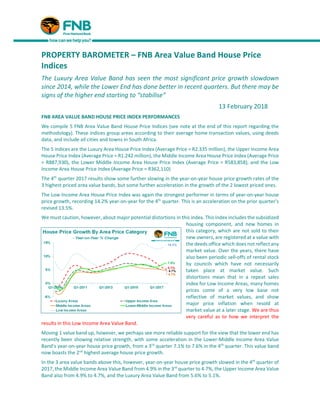
  • 1. PROPERTY BAROMETER – FNB Area Value Band House Price Indices The Luxury Area Value Band has seen the most significant price growth slowdown since 2014, while the Lower End has done better in recent quarters. But there may be signs of the higher end starting to “stabilise” 13 February 2018 FNB AREA VALUE BAND HOUSE PRICE INDEX PERFORMANCES We compile 5 FNB Area Value Band House Price Indices (see note at the end of this report regarding the methodology). These indices group areas according to their average home transaction values, using deeds data, and include all cities and towns in South Africa. The 5 indices are the Luxury Area House Price Index (Average Price = R2.335 million), the Upper Income Area House Price Index (Average Price = R1.242 million), the Middle Income Area House Price Index (Average Price = R887,930), the Lower Middle Income Area House Price Index (Average Price = R583,858), and the Low Income Area House Price Index (Average Price = R362,110) The 4th quarter 2017 results show some further slowing in the year-on-year house price growth rates of the 3 highest priced area value bands, but some further acceleration in the growth of the 2 lowest priced ones. The Low Income Area House Price Index was again the strongest performer in terms of year-on-year house price growth, recording 14.2% year-on-year for the 4th quarter. This is an acceleration on the prior quarter’s revised 13.5%. We must caution, however, about major potential distortions in this index. This index includes the subsidized housing component, and new homes in this category, which are not sold to their new owners, are registered at a value with the deeds office which does not reflect any market value. Over the years, there have also been periodic sell-offs of rental stock by councils which have not necessarily taken place at market value. Such distortions mean that in a repeat sales index for Low Income Areas, many homes prices come of a very low base not reflective of market values, and show major price inflation when resold at market value at a later stage. We are thus very careful as to how we interpret the results in this Low Income Area Value Band. Moving 1 value band up, however, we perhaps see more reliable support for the view that the lower end has recently been showing relative strength, with some acceleration in the Lower-Middle Income Area Value Band’s year-on-year house price growth, from a 3rd quarter 7.1% to 7.6% in the 4th quarter. This value band now boasts the 2nd highest average house price growth. In the 3 area value bands above this, however, year-on-year house price growth slowed in the 4th quarter of 2017, the Middle Income Area Value Band from 4.9% in the 3rd quarter to 4.7%, the Upper Income Area Value Band also from 4.9% to 4.7%, and the Luxury Area Value Band from 5.6% to 5.1%.
  • 2. Therefore, while not yet having the slowest year-on-year house price growth, the Luxury Area Valua Band’s rate has again slowed the most noticeably in the 4th quarter of 2017. On a quarter-on-quarter basis, a better indicator of recent price growth momentum than the year-on-year calculation, there has been a strong convergence of the 3 highest priced area value bands. The Luxury Income Area Value Band showed quarter-on-quarter growth of 1.2% in the 4th quarter, while the Upper and Middle Income Areas Value Bands showed slightly slower 1.1% growth. Noticeably higher growth was seen in the Lower Middle Income Area Value Band, to the tune of 1.9%, and Low Income Areas (with all the above-mentioned warnings) at 3.8%. This, in short, all points to superior performance at the lower-priced end of the market where average process are well-below R1m. However, the quarter-on-quarter house price growth rates for the top 3 value bands were all unchanged from their rates in the previous quarter, possibly suggesting that these market are heading towards “stabilization”, and the end of slowing house price growth. The most significant year-on-year house price growth slowing in recent years has been in the Luxury Area Value Band, from an 11% high back in the final quarter of 2014 to the most recent 5.1%, followed by the Upper Income Value Band whose growth has slowed from 7.4% at the end of 2014 to 4.7%. But stabilizing quarter-on-quarter growth rates of late may suggest that this year-on-year slowing is near its end. FNB’S VALUERS HAVE ALSO PERCEIVED A MORE NOTICEABLE HIGH END WEAKENING OFF A HIGHER BASE The more significant softening off a higher growth base by the higher end appears to tie in with what FNB’s Valuers perceive about the market. In the FNB Valuers’ Market Strength Indices (MSI) by Income Areas (self- defined by the valuers), the Upper Income Area MSI has weakened the most, from a multi-year high of 54.98 at the end of 2015 to 51.43 in the 4th quarter of 2017. By comparison , the Middle Income Area MSI has declined slightly from 51.13 in the 3rd quarter of 2015 to 50.35 in the 4th quarter of 2017, while the Lower Income Area MSI is marginally up from an end-of- 2015 48.86, to 49.77 in the final quarter of 2017. In the past 2 quarters, the valuers as a group have even perceived a slight strengthening at the Lower Income Area End. The High End of the market thus appears to have led the slowdown of recent years
  • 3. FNB ESTATE AGENT SURVEY ALSO POINTS TO MORE NOTICEABLE SLOWING AT UPPER END SINCE 2014 The more significant upper end slowing has also been apparent in the FNB Estate Agent Survey in recent years. Upper End homes tend to “naturally” stay on the market for a longer time on average prior to sales than is the case at the lower priced end. However, from 2015 onward we began to notice a widening in the gap in average time of homes on the market between the Luxury (High Net Worth) and Upper Income Area segments on the one hand, and the Middle and Lower Income Area segments on the other hand. We must just mention that our agent survey’s income areas are self-defined by agents, so average home values per segment differ markedly from our own area value band segmentations. In 2014, the “Lower Income” Area segment (average value = R1.086 million) showed an average time of homes on the market of 11.54 weeks. This average time has shortened to a 9.43 weeks average for the entire 2017. Middle Income Areas (average price = R2.067 million) saw average time on market go higher from a 10.18 weeks average in 2014 to 14.36 weeks in 2017. The increase in average time on the market in the Upper Income Area segment (average price = R2.955 million) was also significant, from 13.36 weeks in 2014 to 17.71 weeks in 2017. But the most significant increase in average time on the market was to be found in the “High Net Worth” Areas (average value = R6.193 million), rising from 15.86 weeks in 2014 to 23.25 weeks 2017. In short, since 2014, the higher up the income area ladder we go the more significant the rise in average time of homes on the market appears to have been from 2014 to 2017. This picture broadly ties in with the FNB Area Value Band House Price Index picture, where the Luxury Area Value Band has shown the most significant slowing off a higher price growth base. IN CONCLUSION The house price growth differential between the 3 highest priced FNB Area Value Band House Price Indices has narrowed of late, with all 3 of these segments having shown recent growth slowing. But unchanged quarter-on-quarter growth rates in the 3 most expensive area value bands suggests that slowing year-on- year growth in these 3 value bands may be near its end. However, the Lower Middle Income and Low Income Area Value Bands saw further accelerations in house price growth in the 4th quarter, and outperformed the rest. Sentiment in South Africa early in 2018 seems improved, leading economic indicators have been pointing towards a strengthening economy in the near term, and it seems plausible that 2018 could be a mildly stronger year for all housing market segments. However, we believe that despite any economic improvement the Household Sector will remain financially constrained, searching for home affordability as a result, and that this will lead to the lower priced value bands continuing to outperform the higher end this year. JOHN LOOS: HOUSEHOLD AND PROPERTY SECTOR STRATEGIST MARKET ANALYTICS AND SCENARIO FORECASTING UNIT: FNB HOME LOANS Tel: 087-328 0151 John.loos@fnb.co.za The information in this publication is derived from sources which are regarded as accurate and reliable, is of a general nature only, does not constitute advice and may not be applicable to all circumstances. Detailed advice should be obtained in individual cases. No responsibility for any error, omission or loss sustained by any person acting or refraining from acting as a result of this publication is accepted by Firstrand Group Limited and / or the authors of the material. First National Bank – a division of FirstRand Bank Limited. An Authorised Financial Services provider. Reg No. 1929/001225/06
  • 4. Note: The FNB Area Value Band House Price Indices are derived from Deeds Office Data, utilizing only property transactions by individuals (“natural persons”). There are 5 Area Value Band Indices. The areas are grouped into quintiles according to their average transaction price over the 5 years from 2012 to 2016. A quintile does not represent 20% of all areas, but rather a group of areas whose transaction volume (also over the 5 year period 2012 to 2016) accounts for 20% of total transaction volume. For example, Quintile 1, named the “Luxury Area Value Band”, is the group of areas with the highest transaction price averages in South Africa, making up 20% of the total volume of property transactions by individuals. The indices are named as follows: Quintile 1 – Luxury Area Value Band House Price Index Quintile 2 – Upper Income Area Value Band House Price Index Quintile 3 – Middle Income Area Value Band House Price Index Quintile 4 – Lower Middle Income Area Value Band House Price Index Quintile 5 – Low Income Area Value Band House Price Index The index methodology used is a “repeat sales” methodology Given that deeds data is a different dataset to our monthly FNB National House Price Index, and more dated than our own FNB data, the Area Value Band Indices are not exactly comparable with it. Note on the FNB Valuers’ Market Strength Index: *When an FNB valuer values a property, he/she is required to provide a rating of demand as well as supply for property in the specific area. The demand and supply rating categories are a simple “good (100)”, “average (50)”, and “weak (0)”. From all of these ratings we compile an aggregate demand and an aggregate supply rating, which are expressed on a scale of 0 to 100. After aggregating the individual demand and supply ratings, we subtract the aggregate supply rating from the demand rating, add 100 to the difference, and divide by 2, so that the FNB Valuers’ Residential Market Strength Index is also depicted on a scale of 0 to 100 with 50 being the point where supply and demand are equal.
  • 5. 2015 2016 2017 Q1-2017 Q2-2017 Q3-2017 Q4-2017 HOUSE PRICE INDICES BY AREA VALUE BAND Luxury Areas (Index Q1 2001 = 100) 587.7 640.8 679.9 667.6 676.0 684.0 692.0 - year-on-year % change 10.7% 9.0% 6.1% 7.3% 6.4% 5.6% 5.1% - quarter-on-quarter % change 1.4% 1.3% 1.2% 1.2% Upper Income Areas (Index Q1 2001 = 100) 479.0 510.0 536.2 527.0 533.2 539.2 545.4 - year-on-year % change 7.1% 6.5% 5.1% 5.7% 5.3% 4.9% 4.7% - quarter-on-quarter % change 1.2% 1.2% 1.1% 1.1% Middle Income Areas (Index Q1 2001 = 100) 482.5 508.5 534.0 524.9 531.1 537.0 543.0 - year-on-year % change 6.0% 5.4% 5.0% 5.2% 5.1% 4.9% 4.7% - quarter-on-quarter % change 1.3% 1.2% 1.1% 1.1% Lower-Middle Income Areas (Index Q1 2001 = 100) 555.1 591.0 631.2 613.5 624.9 637.3 649.3 - year-on-year % change 6.8% 6.5% 6.8% 6.0% 6.5% 7.1% 7.6% - quarter-on-quarter % change 1.6% 1.9% 2.0% 1.9% Low Income Areas (Index Q1 2001 = 100) 722.3 822.0 931.1 884.5 911.7 946.3 982.1 - year-on-year % change 13.3% 13.8% 13.3% 12.7% 12.7% 13.5% 14.2% - quarter-on-quarter % change 2.9% 3.1% 3.8% 3.8% AVERAGE HOUSE PRICE INDEX BY AREA VALUE BAND