SlideShare a Scribd company logo
1 of 10
Download to read offline
PROPERTY BAROMETER – House Price Indices by Segment
The Sectional Title Housing Market Segment continues to outperform the Full Title
Segment, although the latter segment has seen its average house price growth
accelerate somewhat
26 February 2018
The Sectional Title Home Market still shows mildly superior average house price growth compared to the
Full Title Market, but the price growth gap between the 2 segments has diminished, with both segments’
year-on-year price growth picking up mildly through 2017.
RECENT HOUSE PRICE PERFORMANCES OF SECTIONAL VS FULL TITLE
The FNB Sectional Title House Price Index
has remained at a faster growth rate than
Full Title of late. The Sectional Title House
Price Index rose by 5.18% year-on-year in
the 4th
quarter of 2017, having
accelerated from 4.96% in the 1st
quarter
of the year.
The Full Title House Price Index, by
comparison, showed a slower 3.95% year-
on-year growth rate in the 4th
quarter of
2017. However, its growth had
accelerated a little more over the year
than the Sectional Title Index, from a
lowly 3.18% year-on-year in the 1st
quarter of 2017.
Our panel of FNB valuers also perceived the Sectional Title market to be stronger than the Full Title market
in the 4th
quarter of 2017.
This perception is reflected in our FNB
Valuers Market Strength Indices (MSI) for
Full Title and Sectional Title, with the
Sectional Title MSI at a level of 50.90, and
the Full Title MSI on a slightly lower 50.41.
Both segment’s MSI’s had started to
strengthen slightly in recent quarters,
though.
Note: FNB Valuers’ Market Strength
Index (MSI) explanatory notes on page 4.
SECTIONAL TITLE SUB-SEGMENT PERFORMANCES
Within the Sectional Title segment,
“smaller was still better” in the 4th
quarter
of 2017 when one compares the relative
strength of the various sub-segments’
price growth.
The smallest sized Sectional Title sub-
segment, namely the “Less than 2
Bedroom” segment, showed the strongest
price inflation to the tune of 7.3% in the 4th
quarter of 2017. Then came the 2
Bedroom sub-segment with 6.4% price
growth, while the largest “3 Bedroom and
More” category was the slowest sub-
segment with 3.6% average price growth.
However, it was the 2 Bedroom Sub-Segment that was the onlyone of the 3 to be showing house price growth
acceleration through 2017, from 4.9% in the final quarter of 2016 to 6.4% by the end of 2017, the other 2
sub-segments showing slowing price growth through the year.
FULL TITLE SUB-SEGMENT PERFORMANCES
In the Full Title segment, the popular 3
Bedroom segment has shown the highest
average price growth of the 3 sub-
segments, to the tune of 4.2% year-on-
year in the 4th
quarter of 2017.
The relatively expensive 4 Bedroom and
More Full Title Segment saw a slower
growth rate of 3.7%, while the smallest
sized 2 Bedroom-and-Less segment was
the weakest with 3.3%.
AVERAGE PRICE GAP BETWEEN FULL TITLE AND SECTIONAL TITLE MARKETS CONTINUES TO NARROW
Taking a simple percentage differential
between the average Full Title house price
and that of Sectional Title, the
outperformance of Sectional Title in
recent years has reduced the gap by which
the average Full Title house price exceeds
that of the smaller-sized Sectional Title
category, from a revised 26.6% as at the
end of 2013 to 22.2% by the 4th
quarter of
2017.
LONG TERM PERFORMANCES OF MAJOR HOUSING MARKET SEGMENTS
In a view of the long term performance of
our major FNB Segment House Price
Indices, the smaller sized Sectional Title
homes with their more efficient use of
land have clearly been the cumulative
outperformers since the beginning of
2001 around the time when the data
series’ started. This is hardly surprising,
given the mounting scarcity of available
urban land and infrastructure (including
scarcity of new transport infrastructure,
which limits urban sprawl potential) for
new residential development.
Top performer has been the Sectional Title Less than 2 Bedroom Segment, with cumulative average price
inflation of 496.89% from the 1st
quarter of 2001 to the 4th
quarter of 2017.
This far outstrips the 2nd
placed Sectional Title 2 Bedroom Segment’s 376.36% and the Sectional Title 3
Bedroom and More Segment’s 352.98%. The 3 Full Title Segments have “underperformed”, the more popular
3 Bedroom Segment’s 331.41% neck and neck with the 4 Bedroom and More Segment’s 336.71%, but
outstripping the far more affordable 2 Bedrooms and Less Segment’s 284.46%.
CONCLUSION
The FNB Valuers perceive the Sectional Title market to be stronger than that of Full Title, and superior average
house price growth in the Sectional Title market appears to reflect this. However, the year-on-year price
growth rates in both Sectional and Full Title segments accelerated as 2017 progressed, the latter’s growth
accelerating more than the former off a lower base.
The pattern of smaller-sized unit segments outperforming the larger ones is becoming less clear as of late,
however. In the Full Title Segment, the smallest average sized segment, the “2-Bedroon and Less” segment
has recently shown the slowest growth in the main Full Title sub-segments, while in the Sectional Title
segment it is the mid-sized 2-Bedroom sub-segment which has been the only one recently showing average
house price growth acceleration.
It may be that, after some years of smaller sized sub-segments outperforming the larger ones in terms of
price growth, larger sized home now begin to offer relatively better value for money, which could mean that
in 2018 we don’t smaller segments clearly outperforming on price growth.
ADDENDUM - NOTES:
Key notes with regard to the FNB Segment House Price Indices by Title and Room Number:
• The Indices are constructed using transaction price data from homes financed by FNB.
• The minimum size cut-off for full title stands is 200 square metres, and the maximum size is 4000
square metres
• The maximum price cut-off is R10m, and the lower price cut-off is R20,000 (largely to eliminate major
outliers and glaring inputting errors).
• The indices are very lightly smoothed using a Hodrick-Prescott smoothing function with a Lambda of
5.
Note on the FNB Valuers’ Market Strength Index: *When an FNB valuer values a property, he/she is required
to provide a rating of demand as well as supply for property in the specific area. The demand and supply
rating categories are a simple “good (100)”, “average (50)”, and “weak (0)”. From all of these ratings we
compile an aggregate demand and an aggregate supply rating, which are expressed on a scale of 0 to 100.
After aggregating the individual demand and supply ratings, we subtract the aggregate supply rating from
the demand rating, add 100 to the difference, and divide by 2, so that the FNB Valuers’ Residential Market
Strength Index is also depicted on a scale of 0 to 100 with 50 being the point where supply and demand are
equal.
JOHN LOOS:
HOUSEHOLD AND PROPERTY SECTOR STRATEGIST
087-328 0151
John.loos@fnb.co.za
The information in this publication is derived from sources which are regarded as accurate and reliable, is of a general nature only, does not constitute
advice and may not be applicable to all circumstances. Detailed advice should be obtained in individual cases. No responsibility for any error, omission
or loss sustained by any person acting or refraining from acting as a result of this publication is accepted by Firstrand Group Limited and / or the
authors of the material.
First National Bank – a division of FirstRand Bank Limited. An Authorised Financial Services provider. Reg No. 1929/001225/06
SEGMENT PERFORMANCES
• Sectional Title vs Full Title
• Full Title
• Sectional Title
• Sectional Title Per Square Metre
• Home Size Segments
50.38
52.11
50.88
35
40
45
50
55
60
65
2001 2003 2005 2007 2009 2011 2013 2015 2017
IndexScale0to100
FNB Valuers Residential Market Strength
Indices - Sectional Title
3 Bedrooms Less than 2 Bedrooms 2 Bedrooms
• Existing Homes vs Vacant Land
2015 2016 2017 Q1-2017 Q2-2017 Q3-2017 Q4-2017
FULL TITLE SEGMENT
Full Title Average Price (Rand) 1 093 590 1 149 616 1 189 453 1 171 655 1 183 276 1 195 148 1 207 733
- year-on-year % change 6.4% 5.1% 3.5% 3.2% 3.2% 3.5% 3.9%
- quarter-on-quarter % change 0.8% 1.0% 1.0% 1.1%
2 Bedrooms and Less (Rand) 601 037 640 736 658 645 649 920 655 199 661 652 667 811
- year-on-year % change 7.7% 6.6% 2.8% 2.8% 2.4% 2.7% 3.3%
- quarter-on-quarter % change 0.5% 0.8% 1.0% 0.9%
3 Bedroom (Rand) 1 107 127 1 164 908 1 208 484 1 189 766 1 202 779 1 214 609 1 226 782
- year-on-year % change 5.9% 5.2% 3.7% 3.4% 3.5% 3.9% 4.2%
- quarter-on-quarter % change 1.0% 1.1% 1.0% 1.0%
4 Bedrooms and More (Rand) 1 724 817 1 776 845 1 831 652 1 805 077 1 820 920 1 839 816 1 860 795
- year-on-year % change 4.4% 3.0% 3.1% 2.6% 2.8% 3.2% 3.7%
- quarter-on-quarter % change 0.6% 0.9% 1.0% 1.1%
AVERAGE HOUSE PRICE BY MAJOR FULL TITLE SEGMENT
2015 2016 2017 Q1-2017 Q2-2017 Q3-2017 Q4-2017
SECTIONAL TITLE SEGMENT AVERAGE HOUSE PRICE
Sectional Title Average House Price (Rand) 815 463 875 988 924 796 951 996 964 613 976 706 988 626
- year-on-year % change 7.1% 7.4% 5.6% 5.0% 5.1% 5.2% 5.2%
- quarter-on-quarter % change 1.3% 1.3% 1.3% 1.2%
Less than 2 Bedroom (Rand) 637 723 712 314 772 213 752 704 767 368 779 258 789 523
- year-on-year % change 12.6% 11.7% 8.4% 9.3% 8.9% 8.3% 7.3%
- quarter-on-quarter % change 2.3% 1.9% 1.5% 1.3%
2 Bedroom (Rand) 766 827 809 616 855 724 835 625 848 761 862 124 876 386
- year-on-year % change 7.3% 5.6% 5.7% 5.0% 5.5% 5.9% 6.4%
- quarter-on-quarter % change 1.4% 1.6% 1.6% 1.7%
3 Bedrooms and More (Rand) 1 158 774 1 213 531 1 262 171 1 245 295 1 257 285 1 268 281 1 277 825
- year-on-year % change 6.1% 4.7% 4.0% 4.3% 4.2% 3.9% 3.6%
- quarter-on-quarter % change 1.0% 1.0% 0.9% 0.8%
SECTIONAL TITLE PER SQUARE METRE
Sectional Title Average Price (Rand/square metre) 9 780 10 499 11 209 10 939 11 117 11 295 11 484
- year-on-year % change 8.3% 7.3% 6.8% 6.8% 6.8% 6.8% 6.8%
- quarter-on-quarter % change 1.7% 1.6% 1.6% 1.7%
Less than 2 Bedroom (Rand/square metre) 12 277 13 819 15 255 14 754 15 099 15 419 15 749
- year-on-year % change 12.4% 12.6% 10.4% 11.0% 10.7% 10.3% 9.7%
- quarter-on-quarter % change 2.7% 2.3% 2.1% 2.1%
2 Bedroom (Rand/square metre) 9 781 10 413 11 096 10 810 10 996 11 186 11 391
- year-on-year % change 7.5% 6.5% 6.6% 6.0% 6.4% 6.7% 7.1%
- quarter-on-quarter % change 1.6% 1.7% 1.7% 1.8%
3 Bedrooms and More (Rand/square metre) 8 660 9 108 9 474 9 354 9 430 9 513 9 600
- year-on-year % change 7.3% 5.2% 4.0% 4.5% 4.2% 3.8% 3.6%
- quarter-on-quarter % change 0.9% 0.8% 0.9% 0.9%
AVERAGE HOUSE PRICE BY MAJOR SECTIONAL TITLE SEGMENT
2015 2016 2017 Q1-2017 Q2-2017 Q3-2017 Q4-2017
HOUSE PRICES BY HOME SIZE
Large Homes (Rand) 1 898 346 1 953 320 2 085 953 2 027 753 2 069 185 2 105 596 2 141 277
- year-on-year % change 3.8% 2.9% 6.8% 5.5% 6.7% 7.4% 7.6%
- quarter-on-quarter % change 1.9% 2.0% 1.8% 1.7%
Medium Sized Homes (Rand) 1 050 226 1 106 532 1 145 067 1 130 479 1 141 033 1 150 195 1 158 559
- year-on-year % change 6.4% 5.4% 3.5% 3.7% 3.5% 3.4% 3.4%
- quarter-on-quarter % change 0.9% 0.9% 0.8% 0.7%
Small Sized Homes (Rand) 566 176 613 802 651 383 637 507 647 115 656 043 664 866
- year-on-year % change 8.4% 8.4% 6.1% 6.3% 6.1% 6.1% 6.0%
- quarter-on-quarter % change 1.6% 1.5% 1.4% 1.3%
AVERAGE HOUSE PRICE BY SIZE CATEGORY

More Related Content

What's hot

August 2017 - Bouncing back from the bottom: Toronto real estate market charts
August 2017 - Bouncing back from the bottom: Toronto real estate market chartsAugust 2017 - Bouncing back from the bottom: Toronto real estate market charts
August 2017 - Bouncing back from the bottom: Toronto real estate market chartsScott Ingram, CPA, CA, MBA
 
FNB 2017 House Price Index Performance
FNB 2017 House Price Index PerformanceFNB 2017 House Price Index Performance
FNB 2017 House Price Index PerformanceBerty Van Staaden
 
September 2017 - All braced for nothing: Toronto real estate market charts
September 2017 - All braced for nothing: Toronto real estate market chartsSeptember 2017 - All braced for nothing: Toronto real estate market charts
September 2017 - All braced for nothing: Toronto real estate market chartsScott Ingram, CPA, CA, MBA
 
February 2018 - No February Bump!: Toronto real estate market charts
February 2018 - No February Bump!: Toronto real estate market chartsFebruary 2018 - No February Bump!: Toronto real estate market charts
February 2018 - No February Bump!: Toronto real estate market chartsScott Ingram, CPA, CA, MBA
 
How overvalued is the Stock Market?
How overvalued is the Stock Market? How overvalued is the Stock Market?
How overvalued is the Stock Market? Gaetan Lion
 
June 2017 - Major drop in sales: Toronto real estate market charts
June 2017 - Major drop in sales: Toronto real estate market chartsJune 2017 - Major drop in sales: Toronto real estate market charts
June 2017 - Major drop in sales: Toronto real estate market chartsScott Ingram, CPA, CA, MBA
 
July 2017 - Are we in a buyer's market?: Toronto real estate market charts
July 2017 - Are we in a buyer's market?: Toronto real estate market chartsJuly 2017 - Are we in a buyer's market?: Toronto real estate market charts
July 2017 - Are we in a buyer's market?: Toronto real estate market chartsScott Ingram, CPA, CA, MBA
 
San Francisco Market Focus March 2017
San Francisco Market Focus March 2017San Francisco Market Focus March 2017
San Francisco Market Focus March 2017Ronny Budiutama
 
E Newsletter7 2010
E Newsletter7 2010E Newsletter7 2010
E Newsletter7 2010chipwags
 
San Francisco Market Focus February 2017
San Francisco Market Focus February 2017San Francisco Market Focus February 2017
San Francisco Market Focus February 2017Ronny Budiutama
 
March 2018 - Comparing to the thick of the peak: Toronto real estate market c...
March 2018 - Comparing to the thick of the peak: Toronto real estate market c...March 2018 - Comparing to the thick of the peak: Toronto real estate market c...
March 2018 - Comparing to the thick of the peak: Toronto real estate market c...Scott Ingram, CPA, CA, MBA
 
TREB Market Watch - January 2014
TREB Market Watch - January 2014TREB Market Watch - January 2014
TREB Market Watch - January 2014Jumptools Inc.
 
November 2014 Greater Boston Real Estate Market Trends Report
November 2014 Greater Boston Real Estate Market Trends ReportNovember 2014 Greater Boston Real Estate Market Trends Report
November 2014 Greater Boston Real Estate Market Trends ReportUnit Realty Group
 
Monthly Real Estate Indicators: Twin Cities Housing Market Info & Statistics
Monthly Real Estate Indicators: Twin Cities Housing Market Info & StatisticsMonthly Real Estate Indicators: Twin Cities Housing Market Info & Statistics
Monthly Real Estate Indicators: Twin Cities Housing Market Info & Statisticspattiann
 
England's North-South Divide on Home Ownership
England's North-South Divide on Home OwnershipEngland's North-South Divide on Home Ownership
England's North-South Divide on Home OwnershipCobain Schofield
 
September 2018 - Mirroring 2017 Toronto real estate market charts
September 2018 - Mirroring 2017 Toronto real estate market chartsSeptember 2018 - Mirroring 2017 Toronto real estate market charts
September 2018 - Mirroring 2017 Toronto real estate market chartsScott Ingram, CPA, CA, MBA
 
December 2016 Greater Boston Real Estate Market Trends
December 2016 Greater Boston Real Estate Market TrendsDecember 2016 Greater Boston Real Estate Market Trends
December 2016 Greater Boston Real Estate Market TrendsJoe Schutt
 
GBAR Monthly Housing Market Data November 2016
GBAR Monthly Housing Market Data November 2016GBAR Monthly Housing Market Data November 2016
GBAR Monthly Housing Market Data November 2016Joe Schutt
 
San Francisco Real Estate Housing Market January 2017
San Francisco Real Estate Housing Market January 2017San Francisco Real Estate Housing Market January 2017
San Francisco Real Estate Housing Market January 2017Ronny Budiutama
 
October 2015 Greater Boston Real Estate Market Trends Report
October 2015 Greater Boston Real Estate Market Trends ReportOctober 2015 Greater Boston Real Estate Market Trends Report
October 2015 Greater Boston Real Estate Market Trends ReportUnit Realty Group
 

What's hot (20)

August 2017 - Bouncing back from the bottom: Toronto real estate market charts
August 2017 - Bouncing back from the bottom: Toronto real estate market chartsAugust 2017 - Bouncing back from the bottom: Toronto real estate market charts
August 2017 - Bouncing back from the bottom: Toronto real estate market charts
 
FNB 2017 House Price Index Performance
FNB 2017 House Price Index PerformanceFNB 2017 House Price Index Performance
FNB 2017 House Price Index Performance
 
September 2017 - All braced for nothing: Toronto real estate market charts
September 2017 - All braced for nothing: Toronto real estate market chartsSeptember 2017 - All braced for nothing: Toronto real estate market charts
September 2017 - All braced for nothing: Toronto real estate market charts
 
February 2018 - No February Bump!: Toronto real estate market charts
February 2018 - No February Bump!: Toronto real estate market chartsFebruary 2018 - No February Bump!: Toronto real estate market charts
February 2018 - No February Bump!: Toronto real estate market charts
 
How overvalued is the Stock Market?
How overvalued is the Stock Market? How overvalued is the Stock Market?
How overvalued is the Stock Market?
 
June 2017 - Major drop in sales: Toronto real estate market charts
June 2017 - Major drop in sales: Toronto real estate market chartsJune 2017 - Major drop in sales: Toronto real estate market charts
June 2017 - Major drop in sales: Toronto real estate market charts
 
July 2017 - Are we in a buyer's market?: Toronto real estate market charts
July 2017 - Are we in a buyer's market?: Toronto real estate market chartsJuly 2017 - Are we in a buyer's market?: Toronto real estate market charts
July 2017 - Are we in a buyer's market?: Toronto real estate market charts
 
San Francisco Market Focus March 2017
San Francisco Market Focus March 2017San Francisco Market Focus March 2017
San Francisco Market Focus March 2017
 
E Newsletter7 2010
E Newsletter7 2010E Newsletter7 2010
E Newsletter7 2010
 
San Francisco Market Focus February 2017
San Francisco Market Focus February 2017San Francisco Market Focus February 2017
San Francisco Market Focus February 2017
 
March 2018 - Comparing to the thick of the peak: Toronto real estate market c...
March 2018 - Comparing to the thick of the peak: Toronto real estate market c...March 2018 - Comparing to the thick of the peak: Toronto real estate market c...
March 2018 - Comparing to the thick of the peak: Toronto real estate market c...
 
TREB Market Watch - January 2014
TREB Market Watch - January 2014TREB Market Watch - January 2014
TREB Market Watch - January 2014
 
November 2014 Greater Boston Real Estate Market Trends Report
November 2014 Greater Boston Real Estate Market Trends ReportNovember 2014 Greater Boston Real Estate Market Trends Report
November 2014 Greater Boston Real Estate Market Trends Report
 
Monthly Real Estate Indicators: Twin Cities Housing Market Info & Statistics
Monthly Real Estate Indicators: Twin Cities Housing Market Info & StatisticsMonthly Real Estate Indicators: Twin Cities Housing Market Info & Statistics
Monthly Real Estate Indicators: Twin Cities Housing Market Info & Statistics
 
England's North-South Divide on Home Ownership
England's North-South Divide on Home OwnershipEngland's North-South Divide on Home Ownership
England's North-South Divide on Home Ownership
 
September 2018 - Mirroring 2017 Toronto real estate market charts
September 2018 - Mirroring 2017 Toronto real estate market chartsSeptember 2018 - Mirroring 2017 Toronto real estate market charts
September 2018 - Mirroring 2017 Toronto real estate market charts
 
December 2016 Greater Boston Real Estate Market Trends
December 2016 Greater Boston Real Estate Market TrendsDecember 2016 Greater Boston Real Estate Market Trends
December 2016 Greater Boston Real Estate Market Trends
 
GBAR Monthly Housing Market Data November 2016
GBAR Monthly Housing Market Data November 2016GBAR Monthly Housing Market Data November 2016
GBAR Monthly Housing Market Data November 2016
 
San Francisco Real Estate Housing Market January 2017
San Francisco Real Estate Housing Market January 2017San Francisco Real Estate Housing Market January 2017
San Francisco Real Estate Housing Market January 2017
 
October 2015 Greater Boston Real Estate Market Trends Report
October 2015 Greater Boston Real Estate Market Trends ReportOctober 2015 Greater Boston Real Estate Market Trends Report
October 2015 Greater Boston Real Estate Market Trends Report
 

Similar to FNB_House Price Indices by Segment

TORONTO REAL ESTATE SALES - APRIL 2018 (TREB)
TORONTO REAL ESTATE SALES - APRIL 2018 (TREB)TORONTO REAL ESTATE SALES - APRIL 2018 (TREB)
TORONTO REAL ESTATE SALES - APRIL 2018 (TREB)Shawn Venasse
 
April 2017 Real Estate Board of Greater Vancouver Statistics Package with Charts
April 2017 Real Estate Board of Greater Vancouver Statistics Package with ChartsApril 2017 Real Estate Board of Greater Vancouver Statistics Package with Charts
April 2017 Real Estate Board of Greater Vancouver Statistics Package with ChartsMike Stewart
 
October Market Watch 2015
October Market Watch 2015October Market Watch 2015
October Market Watch 2015Michelle Makos
 
Monthly Market Report - March 2018 from Physicians Agent™ Network
Monthly Market Report - March 2018 from Physicians Agent™ NetworkMonthly Market Report - March 2018 from Physicians Agent™ Network
Monthly Market Report - March 2018 from Physicians Agent™ NetworkChaDeiparine
 
TORONTO REGIONAL REAL ESTATE BOARD'S - MARKET WATCH - FOR AUGUEST 2021
TORONTO REGIONAL REAL ESTATE BOARD'S - MARKET WATCH - FOR AUGUEST 2021TORONTO REGIONAL REAL ESTATE BOARD'S - MARKET WATCH - FOR AUGUEST 2021
TORONTO REGIONAL REAL ESTATE BOARD'S - MARKET WATCH - FOR AUGUEST 2021Shawn Venasse
 
FNB House Price Index_Sept 2017
FNB House Price Index_Sept 2017FNB House Price Index_Sept 2017
FNB House Price Index_Sept 2017Berty Van Staaden
 
TORONTO REAL ESTATE BOARD'S JUNE 2017 MARKET STATS
TORONTO REAL ESTATE BOARD'S JUNE 2017 MARKET STATSTORONTO REAL ESTATE BOARD'S JUNE 2017 MARKET STATS
TORONTO REAL ESTATE BOARD'S JUNE 2017 MARKET STATSShawn Venasse
 
Monthly Market Report - April 2018 from Physicians Agent™ Network
Monthly Market Report - April 2018 from Physicians Agent™ NetworkMonthly Market Report - April 2018 from Physicians Agent™ Network
Monthly Market Report - April 2018 from Physicians Agent™ NetworkChaDeiparine
 
Physician Loans USA
Physician Loans USAPhysician Loans USA
Physician Loans USAChaDeiparine
 
February 2022 Market Watch
February 2022 Market WatchFebruary 2022 Market Watch
February 2022 Market WatchMichelle Makos
 
February 2022 Market Watch
February 2022 Market WatchFebruary 2022 Market Watch
February 2022 Market WatchMichelle Makos
 
De q1 13
De q1 13De q1 13
De q1 13fazenha
 
March 2016 Real Estate Market Figures
March 2016 Real Estate Market FiguresMarch 2016 Real Estate Market Figures
March 2016 Real Estate Market FiguresMichelle Makos
 
March 2023 Market Watch
March 2023 Market WatchMarch 2023 Market Watch
March 2023 Market WatchMichelle Makos
 
TRREB MARKET REPORT - APRIL 2020
TRREB MARKET REPORT - APRIL 2020TRREB MARKET REPORT - APRIL 2020
TRREB MARKET REPORT - APRIL 2020Shawn Venasse
 
TREB's MARKET WATCH FEBRUARY 2019 REPORT
TREB's MARKET WATCH FEBRUARY 2019 REPORTTREB's MARKET WATCH FEBRUARY 2019 REPORT
TREB's MARKET WATCH FEBRUARY 2019 REPORTShawn Venasse
 

Similar to FNB_House Price Indices by Segment (20)

Marblehead Report
Marblehead ReportMarblehead Report
Marblehead Report
 
TORONTO REAL ESTATE SALES - APRIL 2018 (TREB)
TORONTO REAL ESTATE SALES - APRIL 2018 (TREB)TORONTO REAL ESTATE SALES - APRIL 2018 (TREB)
TORONTO REAL ESTATE SALES - APRIL 2018 (TREB)
 
Marblehead v5
Marblehead v5Marblehead v5
Marblehead v5
 
April 2017 Real Estate Board of Greater Vancouver Statistics Package with Charts
April 2017 Real Estate Board of Greater Vancouver Statistics Package with ChartsApril 2017 Real Estate Board of Greater Vancouver Statistics Package with Charts
April 2017 Real Estate Board of Greater Vancouver Statistics Package with Charts
 
October Market Watch 2015
October Market Watch 2015October Market Watch 2015
October Market Watch 2015
 
Monthly Market Report - March 2018 from Physicians Agent™ Network
Monthly Market Report - March 2018 from Physicians Agent™ NetworkMonthly Market Report - March 2018 from Physicians Agent™ Network
Monthly Market Report - March 2018 from Physicians Agent™ Network
 
TORONTO REGIONAL REAL ESTATE BOARD'S - MARKET WATCH - FOR AUGUEST 2021
TORONTO REGIONAL REAL ESTATE BOARD'S - MARKET WATCH - FOR AUGUEST 2021TORONTO REGIONAL REAL ESTATE BOARD'S - MARKET WATCH - FOR AUGUEST 2021
TORONTO REGIONAL REAL ESTATE BOARD'S - MARKET WATCH - FOR AUGUEST 2021
 
FNB House Price Index_Sept 2017
FNB House Price Index_Sept 2017FNB House Price Index_Sept 2017
FNB House Price Index_Sept 2017
 
October Stats.pdf
October Stats.pdfOctober Stats.pdf
October Stats.pdf
 
CoreLogic-HVI-JUN-2023-FINAL.pdf
CoreLogic-HVI-JUN-2023-FINAL.pdfCoreLogic-HVI-JUN-2023-FINAL.pdf
CoreLogic-HVI-JUN-2023-FINAL.pdf
 
TORONTO REAL ESTATE BOARD'S JUNE 2017 MARKET STATS
TORONTO REAL ESTATE BOARD'S JUNE 2017 MARKET STATSTORONTO REAL ESTATE BOARD'S JUNE 2017 MARKET STATS
TORONTO REAL ESTATE BOARD'S JUNE 2017 MARKET STATS
 
Monthly Market Report - April 2018 from Physicians Agent™ Network
Monthly Market Report - April 2018 from Physicians Agent™ NetworkMonthly Market Report - April 2018 from Physicians Agent™ Network
Monthly Market Report - April 2018 from Physicians Agent™ Network
 
Physician Loans USA
Physician Loans USAPhysician Loans USA
Physician Loans USA
 
February 2022 Market Watch
February 2022 Market WatchFebruary 2022 Market Watch
February 2022 Market Watch
 
February 2022 Market Watch
February 2022 Market WatchFebruary 2022 Market Watch
February 2022 Market Watch
 
De q1 13
De q1 13De q1 13
De q1 13
 
March 2016 Real Estate Market Figures
March 2016 Real Estate Market FiguresMarch 2016 Real Estate Market Figures
March 2016 Real Estate Market Figures
 
March 2023 Market Watch
March 2023 Market WatchMarch 2023 Market Watch
March 2023 Market Watch
 
TRREB MARKET REPORT - APRIL 2020
TRREB MARKET REPORT - APRIL 2020TRREB MARKET REPORT - APRIL 2020
TRREB MARKET REPORT - APRIL 2020
 
TREB's MARKET WATCH FEBRUARY 2019 REPORT
TREB's MARKET WATCH FEBRUARY 2019 REPORTTREB's MARKET WATCH FEBRUARY 2019 REPORT
TREB's MARKET WATCH FEBRUARY 2019 REPORT
 

More from Berty Van Staaden

FNB_Property Barometer - September
FNB_Property Barometer - SeptemberFNB_Property Barometer - September
FNB_Property Barometer - SeptemberBerty Van Staaden
 
Lightstone House Price Index_August 2019
Lightstone House Price Index_August 2019Lightstone House Price Index_August 2019
Lightstone House Price Index_August 2019Berty Van Staaden
 
FNB_Gauteng House Price Index
FNB_Gauteng House Price IndexFNB_Gauteng House Price Index
FNB_Gauteng House Price IndexBerty Van Staaden
 
FNB Property Insights SARB Leading Indicator_August 2019
FNB Property Insights SARB Leading Indicator_August 2019FNB Property Insights SARB Leading Indicator_August 2019
FNB Property Insights SARB Leading Indicator_August 2019Berty Van Staaden
 
PayProp Rental Index Q2 2019
PayProp Rental Index Q2 2019PayProp Rental Index Q2 2019
PayProp Rental Index Q2 2019Berty Van Staaden
 
FNB Residential Building Stats_Q2 2019
FNB Residential Building Stats_Q2 2019FNB Residential Building Stats_Q2 2019
FNB Residential Building Stats_Q2 2019Berty Van Staaden
 
FNB Property Insights August 2019
FNB Property Insights August 2019FNB Property Insights August 2019
FNB Property Insights August 2019Berty Van Staaden
 
FNB Property Barometer (CPTt)_Aug 2019
FNB Property Barometer (CPTt)_Aug 2019FNB Property Barometer (CPTt)_Aug 2019
FNB Property Barometer (CPTt)_Aug 2019Berty Van Staaden
 
FNB_Property Insights_Retail Property's Consumer Challenges
FNB_Property Insights_Retail Property's Consumer ChallengesFNB_Property Insights_Retail Property's Consumer Challenges
FNB_Property Insights_Retail Property's Consumer ChallengesBerty Van Staaden
 
Lightstone_Residential Property Indices_July 2019
Lightstone_Residential Property Indices_July 2019Lightstone_Residential Property Indices_July 2019
Lightstone_Residential Property Indices_July 2019Berty Van Staaden
 
FNB Market Activity Ratings_July 2019
FNB Market Activity Ratings_July 2019FNB Market Activity Ratings_July 2019
FNB Market Activity Ratings_July 2019Berty Van Staaden
 
FNB May Building Statistics (Jul 2019)
FNB May Building Statistics (Jul 2019)FNB May Building Statistics (Jul 2019)
FNB May Building Statistics (Jul 2019)Berty Van Staaden
 
FNB Estate Agents Survey_Buy-to-Let
FNB Estate Agents Survey_Buy-to-LetFNB Estate Agents Survey_Buy-to-Let
FNB Estate Agents Survey_Buy-to-LetBerty Van Staaden
 
FNB Estate Agents Survey_Net Foreign Effect
FNB Estate Agents Survey_Net Foreign EffectFNB Estate Agents Survey_Net Foreign Effect
FNB Estate Agents Survey_Net Foreign EffectBerty Van Staaden
 
Lightstone_Residential Property Indices May 2019
Lightstone_Residential Property Indices May 2019Lightstone_Residential Property Indices May 2019
Lightstone_Residential Property Indices May 2019Berty Van Staaden
 
PayProp Rental Index Q 1 2019
PayProp Rental Index Q 1 2019PayProp Rental Index Q 1 2019
PayProp Rental Index Q 1 2019Berty Van Staaden
 
FNB Residential Property Barometer_February 2019
FNB Residential Property Barometer_February 2019FNB Residential Property Barometer_February 2019
FNB Residential Property Barometer_February 2019Berty Van Staaden
 
Lightstone Property Forecast for 2019
Lightstone Property Forecast for 2019Lightstone Property Forecast for 2019
Lightstone Property Forecast for 2019Berty Van Staaden
 
Lightstone_Residential Property Indices_January 2019
Lightstone_Residential Property Indices_January 2019Lightstone_Residential Property Indices_January 2019
Lightstone_Residential Property Indices_January 2019Berty Van Staaden
 

More from Berty Van Staaden (20)

FNB_Property Barometer - September
FNB_Property Barometer - SeptemberFNB_Property Barometer - September
FNB_Property Barometer - September
 
Lightstone House Price Index_August 2019
Lightstone House Price Index_August 2019Lightstone House Price Index_August 2019
Lightstone House Price Index_August 2019
 
FNB_Gauteng House Price Index
FNB_Gauteng House Price IndexFNB_Gauteng House Price Index
FNB_Gauteng House Price Index
 
FNB Property Insights SARB Leading Indicator_August 2019
FNB Property Insights SARB Leading Indicator_August 2019FNB Property Insights SARB Leading Indicator_August 2019
FNB Property Insights SARB Leading Indicator_August 2019
 
PayProp Rental Index Q2 2019
PayProp Rental Index Q2 2019PayProp Rental Index Q2 2019
PayProp Rental Index Q2 2019
 
FNB Residential Building Stats_Q2 2019
FNB Residential Building Stats_Q2 2019FNB Residential Building Stats_Q2 2019
FNB Residential Building Stats_Q2 2019
 
FNB Property Insights August 2019
FNB Property Insights August 2019FNB Property Insights August 2019
FNB Property Insights August 2019
 
FNB Property Barometer (CPTt)_Aug 2019
FNB Property Barometer (CPTt)_Aug 2019FNB Property Barometer (CPTt)_Aug 2019
FNB Property Barometer (CPTt)_Aug 2019
 
FNB_Property Insights_Retail Property's Consumer Challenges
FNB_Property Insights_Retail Property's Consumer ChallengesFNB_Property Insights_Retail Property's Consumer Challenges
FNB_Property Insights_Retail Property's Consumer Challenges
 
Lightstone_Residential Property Indices_July 2019
Lightstone_Residential Property Indices_July 2019Lightstone_Residential Property Indices_July 2019
Lightstone_Residential Property Indices_July 2019
 
FNB_Rental Market
FNB_Rental MarketFNB_Rental Market
FNB_Rental Market
 
FNB Market Activity Ratings_July 2019
FNB Market Activity Ratings_July 2019FNB Market Activity Ratings_July 2019
FNB Market Activity Ratings_July 2019
 
FNB May Building Statistics (Jul 2019)
FNB May Building Statistics (Jul 2019)FNB May Building Statistics (Jul 2019)
FNB May Building Statistics (Jul 2019)
 
FNB Estate Agents Survey_Buy-to-Let
FNB Estate Agents Survey_Buy-to-LetFNB Estate Agents Survey_Buy-to-Let
FNB Estate Agents Survey_Buy-to-Let
 
FNB Estate Agents Survey_Net Foreign Effect
FNB Estate Agents Survey_Net Foreign EffectFNB Estate Agents Survey_Net Foreign Effect
FNB Estate Agents Survey_Net Foreign Effect
 
Lightstone_Residential Property Indices May 2019
Lightstone_Residential Property Indices May 2019Lightstone_Residential Property Indices May 2019
Lightstone_Residential Property Indices May 2019
 
PayProp Rental Index Q 1 2019
PayProp Rental Index Q 1 2019PayProp Rental Index Q 1 2019
PayProp Rental Index Q 1 2019
 
FNB Residential Property Barometer_February 2019
FNB Residential Property Barometer_February 2019FNB Residential Property Barometer_February 2019
FNB Residential Property Barometer_February 2019
 
Lightstone Property Forecast for 2019
Lightstone Property Forecast for 2019Lightstone Property Forecast for 2019
Lightstone Property Forecast for 2019
 
Lightstone_Residential Property Indices_January 2019
Lightstone_Residential Property Indices_January 2019Lightstone_Residential Property Indices_January 2019
Lightstone_Residential Property Indices_January 2019
 

Recently uploaded

Call Girls in Nehru Place Delhi 💯Call Us 🔝8264348440🔝
Call Girls in Nehru Place Delhi 💯Call Us 🔝8264348440🔝Call Girls in Nehru Place Delhi 💯Call Us 🔝8264348440🔝
Call Girls in Nehru Place Delhi 💯Call Us 🔝8264348440🔝soniya singh
 
Call Girls In Mundka Industrial Metro@꧂8447779280 ↬Enjoy ꧂Escort Service in ...
Call Girls In Mundka Industrial Metro@꧂8447779280 ↬Enjoy ꧂Escort Service in  ...Call Girls In Mundka Industrial Metro@꧂8447779280 ↬Enjoy ꧂Escort Service in  ...
Call Girls In Mundka Industrial Metro@꧂8447779280 ↬Enjoy ꧂Escort Service in ...asmaqueen5
 
Call Girls in Kashmiri Gate Delhi 💯Call Us 🔝8264348440🔝
Call Girls in Kashmiri Gate Delhi 💯Call Us 🔝8264348440🔝Call Girls in Kashmiri Gate Delhi 💯Call Us 🔝8264348440🔝
Call Girls in Kashmiri Gate Delhi 💯Call Us 🔝8264348440🔝soniya singh
 
Call Girls in Model Town Delhi 💯Call Us 🔝8264348440🔝
Call Girls in Model Town Delhi 💯Call Us 🔝8264348440🔝Call Girls in Model Town Delhi 💯Call Us 🔝8264348440🔝
Call Girls in Model Town Delhi 💯Call Us 🔝8264348440🔝soniya singh
 
Low Rate Call Girls in Tughlakabad Delhi Call 9990771857
Low Rate Call Girls in Tughlakabad Delhi Call 9990771857Low Rate Call Girls in Tughlakabad Delhi Call 9990771857
Low Rate Call Girls in Tughlakabad Delhi Call 9990771857delhimodel235
 
8 Key Elements for Comfortable Farmland Living
8 Key Elements for Comfortable Farmland Living 8 Key Elements for Comfortable Farmland Living
8 Key Elements for Comfortable Farmland Living Farmland Bazaar
 
Call Girls In The Lalit New Delhi ❤️8860477959 Good Looking Escorts In 24/7 D...
Call Girls In The Lalit New Delhi ❤️8860477959 Good Looking Escorts In 24/7 D...Call Girls In The Lalit New Delhi ❤️8860477959 Good Looking Escorts In 24/7 D...
Call Girls In The Lalit New Delhi ❤️8860477959 Good Looking Escorts In 24/7 D...lizamodels9
 
Call Girls In Peeragarhi, Delhi↫8447779280↬Call Girls in Peeragarhi Delhi NCR
Call Girls In Peeragarhi, Delhi↫8447779280↬Call Girls in Peeragarhi Delhi NCRCall Girls In Peeragarhi, Delhi↫8447779280↬Call Girls in Peeragarhi Delhi NCR
Call Girls In Peeragarhi, Delhi↫8447779280↬Call Girls in Peeragarhi Delhi NCRasmaqueen5
 
Low Rate Call Girls in Lajpat Nagar Delhi Call 9990771857
Low Rate Call Girls in Lajpat Nagar Delhi Call 9990771857Low Rate Call Girls in Lajpat Nagar Delhi Call 9990771857
Low Rate Call Girls in Lajpat Nagar Delhi Call 9990771857delhimodel235
 
Rustomjee The Panorama At Pali Hill, Bandra West, Mumbai - Brochure.pdf
Rustomjee The Panorama At Pali Hill, Bandra West, Mumbai - Brochure.pdfRustomjee The Panorama At Pali Hill, Bandra West, Mumbai - Brochure.pdf
Rustomjee The Panorama At Pali Hill, Bandra West, Mumbai - Brochure.pdfmonikasharma630
 
Ajmera Prive at Juhu, Mumbai E-Brochure.pdf
Ajmera Prive at Juhu, Mumbai  E-Brochure.pdfAjmera Prive at Juhu, Mumbai  E-Brochure.pdf
Ajmera Prive at Juhu, Mumbai E-Brochure.pdfManishSaxena95
 
What Is Biophilic Design .pdf
What Is Biophilic Design            .pdfWhat Is Biophilic Design            .pdf
What Is Biophilic Design .pdfyamunaNMH
 
SVN Live 4.22.24 Weekly Property Broadcast
SVN Live 4.22.24 Weekly Property BroadcastSVN Live 4.22.24 Weekly Property Broadcast
SVN Live 4.22.24 Weekly Property BroadcastSVN International Corp.
 
Namrata 7 Plumeria Drive Pimpri Chinchwad Pune Brochure.pdf
Namrata 7 Plumeria Drive Pimpri Chinchwad Pune Brochure.pdfNamrata 7 Plumeria Drive Pimpri Chinchwad Pune Brochure.pdf
Namrata 7 Plumeria Drive Pimpri Chinchwad Pune Brochure.pdfPrachiRudram
 
Low Rate Call Girls in Akshardham Delhi Call 9990771857
Low Rate Call Girls in Akshardham   Delhi Call 9990771857Low Rate Call Girls in Akshardham   Delhi Call 9990771857
Low Rate Call Girls in Akshardham Delhi Call 9990771857delhimodel235
 
Call Girls In Sahibabad Ghaziabad ❤️8860477959 Low Rate Escorts Service In 24...
Call Girls In Sahibabad Ghaziabad ❤️8860477959 Low Rate Escorts Service In 24...Call Girls In Sahibabad Ghaziabad ❤️8860477959 Low Rate Escorts Service In 24...
Call Girls In Sahibabad Ghaziabad ❤️8860477959 Low Rate Escorts Service In 24...lizamodels9
 
83770-87607 ۞Call Girls In Near The Park Hotel (Cp) Delhi
83770-87607 ۞Call Girls In Near The Park Hotel (Cp) Delhi83770-87607 ۞Call Girls In Near The Park Hotel (Cp) Delhi
83770-87607 ۞Call Girls In Near The Park Hotel (Cp) Delhidollysharma2066
 
The Omaxe State Dwarka Delhi-broucher.pdf.pdf
The Omaxe State Dwarka Delhi-broucher.pdf.pdfThe Omaxe State Dwarka Delhi-broucher.pdf.pdf
The Omaxe State Dwarka Delhi-broucher.pdf.pdfkratirudram
 
Call Girls In Vasundhara Ghaziabad ❤️8860477959 Low Rate Escorts Service In 2...
Call Girls In Vasundhara Ghaziabad ❤️8860477959 Low Rate Escorts Service In 2...Call Girls In Vasundhara Ghaziabad ❤️8860477959 Low Rate Escorts Service In 2...
Call Girls In Vasundhara Ghaziabad ❤️8860477959 Low Rate Escorts Service In 2...lizamodels9
 

Recently uploaded (20)

Call Girls in Nehru Place Delhi 💯Call Us 🔝8264348440🔝
Call Girls in Nehru Place Delhi 💯Call Us 🔝8264348440🔝Call Girls in Nehru Place Delhi 💯Call Us 🔝8264348440🔝
Call Girls in Nehru Place Delhi 💯Call Us 🔝8264348440🔝
 
Call Girls in Mahavir Nagar whatsaap call US +919953056974
Call Girls in Mahavir Nagar  whatsaap call US  +919953056974Call Girls in Mahavir Nagar  whatsaap call US  +919953056974
Call Girls in Mahavir Nagar whatsaap call US +919953056974
 
Call Girls In Mundka Industrial Metro@꧂8447779280 ↬Enjoy ꧂Escort Service in ...
Call Girls In Mundka Industrial Metro@꧂8447779280 ↬Enjoy ꧂Escort Service in  ...Call Girls In Mundka Industrial Metro@꧂8447779280 ↬Enjoy ꧂Escort Service in  ...
Call Girls In Mundka Industrial Metro@꧂8447779280 ↬Enjoy ꧂Escort Service in ...
 
Call Girls in Kashmiri Gate Delhi 💯Call Us 🔝8264348440🔝
Call Girls in Kashmiri Gate Delhi 💯Call Us 🔝8264348440🔝Call Girls in Kashmiri Gate Delhi 💯Call Us 🔝8264348440🔝
Call Girls in Kashmiri Gate Delhi 💯Call Us 🔝8264348440🔝
 
Call Girls in Model Town Delhi 💯Call Us 🔝8264348440🔝
Call Girls in Model Town Delhi 💯Call Us 🔝8264348440🔝Call Girls in Model Town Delhi 💯Call Us 🔝8264348440🔝
Call Girls in Model Town Delhi 💯Call Us 🔝8264348440🔝
 
Low Rate Call Girls in Tughlakabad Delhi Call 9990771857
Low Rate Call Girls in Tughlakabad Delhi Call 9990771857Low Rate Call Girls in Tughlakabad Delhi Call 9990771857
Low Rate Call Girls in Tughlakabad Delhi Call 9990771857
 
8 Key Elements for Comfortable Farmland Living
8 Key Elements for Comfortable Farmland Living 8 Key Elements for Comfortable Farmland Living
8 Key Elements for Comfortable Farmland Living
 
Call Girls In The Lalit New Delhi ❤️8860477959 Good Looking Escorts In 24/7 D...
Call Girls In The Lalit New Delhi ❤️8860477959 Good Looking Escorts In 24/7 D...Call Girls In The Lalit New Delhi ❤️8860477959 Good Looking Escorts In 24/7 D...
Call Girls In The Lalit New Delhi ❤️8860477959 Good Looking Escorts In 24/7 D...
 
Call Girls In Peeragarhi, Delhi↫8447779280↬Call Girls in Peeragarhi Delhi NCR
Call Girls In Peeragarhi, Delhi↫8447779280↬Call Girls in Peeragarhi Delhi NCRCall Girls In Peeragarhi, Delhi↫8447779280↬Call Girls in Peeragarhi Delhi NCR
Call Girls In Peeragarhi, Delhi↫8447779280↬Call Girls in Peeragarhi Delhi NCR
 
Low Rate Call Girls in Lajpat Nagar Delhi Call 9990771857
Low Rate Call Girls in Lajpat Nagar Delhi Call 9990771857Low Rate Call Girls in Lajpat Nagar Delhi Call 9990771857
Low Rate Call Girls in Lajpat Nagar Delhi Call 9990771857
 
Rustomjee The Panorama At Pali Hill, Bandra West, Mumbai - Brochure.pdf
Rustomjee The Panorama At Pali Hill, Bandra West, Mumbai - Brochure.pdfRustomjee The Panorama At Pali Hill, Bandra West, Mumbai - Brochure.pdf
Rustomjee The Panorama At Pali Hill, Bandra West, Mumbai - Brochure.pdf
 
Ajmera Prive at Juhu, Mumbai E-Brochure.pdf
Ajmera Prive at Juhu, Mumbai  E-Brochure.pdfAjmera Prive at Juhu, Mumbai  E-Brochure.pdf
Ajmera Prive at Juhu, Mumbai E-Brochure.pdf
 
What Is Biophilic Design .pdf
What Is Biophilic Design            .pdfWhat Is Biophilic Design            .pdf
What Is Biophilic Design .pdf
 
SVN Live 4.22.24 Weekly Property Broadcast
SVN Live 4.22.24 Weekly Property BroadcastSVN Live 4.22.24 Weekly Property Broadcast
SVN Live 4.22.24 Weekly Property Broadcast
 
Namrata 7 Plumeria Drive Pimpri Chinchwad Pune Brochure.pdf
Namrata 7 Plumeria Drive Pimpri Chinchwad Pune Brochure.pdfNamrata 7 Plumeria Drive Pimpri Chinchwad Pune Brochure.pdf
Namrata 7 Plumeria Drive Pimpri Chinchwad Pune Brochure.pdf
 
Low Rate Call Girls in Akshardham Delhi Call 9990771857
Low Rate Call Girls in Akshardham   Delhi Call 9990771857Low Rate Call Girls in Akshardham   Delhi Call 9990771857
Low Rate Call Girls in Akshardham Delhi Call 9990771857
 
Call Girls In Sahibabad Ghaziabad ❤️8860477959 Low Rate Escorts Service In 24...
Call Girls In Sahibabad Ghaziabad ❤️8860477959 Low Rate Escorts Service In 24...Call Girls In Sahibabad Ghaziabad ❤️8860477959 Low Rate Escorts Service In 24...
Call Girls In Sahibabad Ghaziabad ❤️8860477959 Low Rate Escorts Service In 24...
 
83770-87607 ۞Call Girls In Near The Park Hotel (Cp) Delhi
83770-87607 ۞Call Girls In Near The Park Hotel (Cp) Delhi83770-87607 ۞Call Girls In Near The Park Hotel (Cp) Delhi
83770-87607 ۞Call Girls In Near The Park Hotel (Cp) Delhi
 
The Omaxe State Dwarka Delhi-broucher.pdf.pdf
The Omaxe State Dwarka Delhi-broucher.pdf.pdfThe Omaxe State Dwarka Delhi-broucher.pdf.pdf
The Omaxe State Dwarka Delhi-broucher.pdf.pdf
 
Call Girls In Vasundhara Ghaziabad ❤️8860477959 Low Rate Escorts Service In 2...
Call Girls In Vasundhara Ghaziabad ❤️8860477959 Low Rate Escorts Service In 2...Call Girls In Vasundhara Ghaziabad ❤️8860477959 Low Rate Escorts Service In 2...
Call Girls In Vasundhara Ghaziabad ❤️8860477959 Low Rate Escorts Service In 2...
 

FNB_House Price Indices by Segment

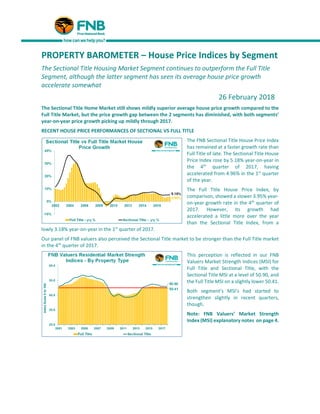
  • 1. PROPERTY BAROMETER – House Price Indices by Segment The Sectional Title Housing Market Segment continues to outperform the Full Title Segment, although the latter segment has seen its average house price growth accelerate somewhat 26 February 2018 The Sectional Title Home Market still shows mildly superior average house price growth compared to the Full Title Market, but the price growth gap between the 2 segments has diminished, with both segments’ year-on-year price growth picking up mildly through 2017. RECENT HOUSE PRICE PERFORMANCES OF SECTIONAL VS FULL TITLE The FNB Sectional Title House Price Index has remained at a faster growth rate than Full Title of late. The Sectional Title House Price Index rose by 5.18% year-on-year in the 4th quarter of 2017, having accelerated from 4.96% in the 1st quarter of the year. The Full Title House Price Index, by comparison, showed a slower 3.95% year- on-year growth rate in the 4th quarter of 2017. However, its growth had accelerated a little more over the year than the Sectional Title Index, from a lowly 3.18% year-on-year in the 1st quarter of 2017. Our panel of FNB valuers also perceived the Sectional Title market to be stronger than the Full Title market in the 4th quarter of 2017. This perception is reflected in our FNB Valuers Market Strength Indices (MSI) for Full Title and Sectional Title, with the Sectional Title MSI at a level of 50.90, and the Full Title MSI on a slightly lower 50.41. Both segment’s MSI’s had started to strengthen slightly in recent quarters, though. Note: FNB Valuers’ Market Strength Index (MSI) explanatory notes on page 4.
  • 2. SECTIONAL TITLE SUB-SEGMENT PERFORMANCES Within the Sectional Title segment, “smaller was still better” in the 4th quarter of 2017 when one compares the relative strength of the various sub-segments’ price growth. The smallest sized Sectional Title sub- segment, namely the “Less than 2 Bedroom” segment, showed the strongest price inflation to the tune of 7.3% in the 4th quarter of 2017. Then came the 2 Bedroom sub-segment with 6.4% price growth, while the largest “3 Bedroom and More” category was the slowest sub- segment with 3.6% average price growth. However, it was the 2 Bedroom Sub-Segment that was the onlyone of the 3 to be showing house price growth acceleration through 2017, from 4.9% in the final quarter of 2016 to 6.4% by the end of 2017, the other 2 sub-segments showing slowing price growth through the year. FULL TITLE SUB-SEGMENT PERFORMANCES In the Full Title segment, the popular 3 Bedroom segment has shown the highest average price growth of the 3 sub- segments, to the tune of 4.2% year-on- year in the 4th quarter of 2017. The relatively expensive 4 Bedroom and More Full Title Segment saw a slower growth rate of 3.7%, while the smallest sized 2 Bedroom-and-Less segment was the weakest with 3.3%. AVERAGE PRICE GAP BETWEEN FULL TITLE AND SECTIONAL TITLE MARKETS CONTINUES TO NARROW Taking a simple percentage differential between the average Full Title house price and that of Sectional Title, the outperformance of Sectional Title in recent years has reduced the gap by which the average Full Title house price exceeds that of the smaller-sized Sectional Title category, from a revised 26.6% as at the end of 2013 to 22.2% by the 4th quarter of 2017.
  • 3. LONG TERM PERFORMANCES OF MAJOR HOUSING MARKET SEGMENTS In a view of the long term performance of our major FNB Segment House Price Indices, the smaller sized Sectional Title homes with their more efficient use of land have clearly been the cumulative outperformers since the beginning of 2001 around the time when the data series’ started. This is hardly surprising, given the mounting scarcity of available urban land and infrastructure (including scarcity of new transport infrastructure, which limits urban sprawl potential) for new residential development. Top performer has been the Sectional Title Less than 2 Bedroom Segment, with cumulative average price inflation of 496.89% from the 1st quarter of 2001 to the 4th quarter of 2017. This far outstrips the 2nd placed Sectional Title 2 Bedroom Segment’s 376.36% and the Sectional Title 3 Bedroom and More Segment’s 352.98%. The 3 Full Title Segments have “underperformed”, the more popular 3 Bedroom Segment’s 331.41% neck and neck with the 4 Bedroom and More Segment’s 336.71%, but outstripping the far more affordable 2 Bedrooms and Less Segment’s 284.46%. CONCLUSION The FNB Valuers perceive the Sectional Title market to be stronger than that of Full Title, and superior average house price growth in the Sectional Title market appears to reflect this. However, the year-on-year price growth rates in both Sectional and Full Title segments accelerated as 2017 progressed, the latter’s growth accelerating more than the former off a lower base. The pattern of smaller-sized unit segments outperforming the larger ones is becoming less clear as of late, however. In the Full Title Segment, the smallest average sized segment, the “2-Bedroon and Less” segment has recently shown the slowest growth in the main Full Title sub-segments, while in the Sectional Title segment it is the mid-sized 2-Bedroom sub-segment which has been the only one recently showing average house price growth acceleration. It may be that, after some years of smaller sized sub-segments outperforming the larger ones in terms of price growth, larger sized home now begin to offer relatively better value for money, which could mean that in 2018 we don’t smaller segments clearly outperforming on price growth.
  • 4. ADDENDUM - NOTES: Key notes with regard to the FNB Segment House Price Indices by Title and Room Number: • The Indices are constructed using transaction price data from homes financed by FNB. • The minimum size cut-off for full title stands is 200 square metres, and the maximum size is 4000 square metres • The maximum price cut-off is R10m, and the lower price cut-off is R20,000 (largely to eliminate major outliers and glaring inputting errors). • The indices are very lightly smoothed using a Hodrick-Prescott smoothing function with a Lambda of 5. Note on the FNB Valuers’ Market Strength Index: *When an FNB valuer values a property, he/she is required to provide a rating of demand as well as supply for property in the specific area. The demand and supply rating categories are a simple “good (100)”, “average (50)”, and “weak (0)”. From all of these ratings we compile an aggregate demand and an aggregate supply rating, which are expressed on a scale of 0 to 100. After aggregating the individual demand and supply ratings, we subtract the aggregate supply rating from the demand rating, add 100 to the difference, and divide by 2, so that the FNB Valuers’ Residential Market Strength Index is also depicted on a scale of 0 to 100 with 50 being the point where supply and demand are equal. JOHN LOOS: HOUSEHOLD AND PROPERTY SECTOR STRATEGIST 087-328 0151 John.loos@fnb.co.za The information in this publication is derived from sources which are regarded as accurate and reliable, is of a general nature only, does not constitute advice and may not be applicable to all circumstances. Detailed advice should be obtained in individual cases. No responsibility for any error, omission or loss sustained by any person acting or refraining from acting as a result of this publication is accepted by Firstrand Group Limited and / or the authors of the material. First National Bank – a division of FirstRand Bank Limited. An Authorised Financial Services provider. Reg No. 1929/001225/06
  • 5. SEGMENT PERFORMANCES • Sectional Title vs Full Title • Full Title
  • 6. • Sectional Title • Sectional Title Per Square Metre • Home Size Segments 50.38 52.11 50.88 35 40 45 50 55 60 65 2001 2003 2005 2007 2009 2011 2013 2015 2017 IndexScale0to100 FNB Valuers Residential Market Strength Indices - Sectional Title 3 Bedrooms Less than 2 Bedrooms 2 Bedrooms
  • 7. • Existing Homes vs Vacant Land
  • 8. 2015 2016 2017 Q1-2017 Q2-2017 Q3-2017 Q4-2017 FULL TITLE SEGMENT Full Title Average Price (Rand) 1 093 590 1 149 616 1 189 453 1 171 655 1 183 276 1 195 148 1 207 733 - year-on-year % change 6.4% 5.1% 3.5% 3.2% 3.2% 3.5% 3.9% - quarter-on-quarter % change 0.8% 1.0% 1.0% 1.1% 2 Bedrooms and Less (Rand) 601 037 640 736 658 645 649 920 655 199 661 652 667 811 - year-on-year % change 7.7% 6.6% 2.8% 2.8% 2.4% 2.7% 3.3% - quarter-on-quarter % change 0.5% 0.8% 1.0% 0.9% 3 Bedroom (Rand) 1 107 127 1 164 908 1 208 484 1 189 766 1 202 779 1 214 609 1 226 782 - year-on-year % change 5.9% 5.2% 3.7% 3.4% 3.5% 3.9% 4.2% - quarter-on-quarter % change 1.0% 1.1% 1.0% 1.0% 4 Bedrooms and More (Rand) 1 724 817 1 776 845 1 831 652 1 805 077 1 820 920 1 839 816 1 860 795 - year-on-year % change 4.4% 3.0% 3.1% 2.6% 2.8% 3.2% 3.7% - quarter-on-quarter % change 0.6% 0.9% 1.0% 1.1% AVERAGE HOUSE PRICE BY MAJOR FULL TITLE SEGMENT
  • 9. 2015 2016 2017 Q1-2017 Q2-2017 Q3-2017 Q4-2017 SECTIONAL TITLE SEGMENT AVERAGE HOUSE PRICE Sectional Title Average House Price (Rand) 815 463 875 988 924 796 951 996 964 613 976 706 988 626 - year-on-year % change 7.1% 7.4% 5.6% 5.0% 5.1% 5.2% 5.2% - quarter-on-quarter % change 1.3% 1.3% 1.3% 1.2% Less than 2 Bedroom (Rand) 637 723 712 314 772 213 752 704 767 368 779 258 789 523 - year-on-year % change 12.6% 11.7% 8.4% 9.3% 8.9% 8.3% 7.3% - quarter-on-quarter % change 2.3% 1.9% 1.5% 1.3% 2 Bedroom (Rand) 766 827 809 616 855 724 835 625 848 761 862 124 876 386 - year-on-year % change 7.3% 5.6% 5.7% 5.0% 5.5% 5.9% 6.4% - quarter-on-quarter % change 1.4% 1.6% 1.6% 1.7% 3 Bedrooms and More (Rand) 1 158 774 1 213 531 1 262 171 1 245 295 1 257 285 1 268 281 1 277 825 - year-on-year % change 6.1% 4.7% 4.0% 4.3% 4.2% 3.9% 3.6% - quarter-on-quarter % change 1.0% 1.0% 0.9% 0.8% SECTIONAL TITLE PER SQUARE METRE Sectional Title Average Price (Rand/square metre) 9 780 10 499 11 209 10 939 11 117 11 295 11 484 - year-on-year % change 8.3% 7.3% 6.8% 6.8% 6.8% 6.8% 6.8% - quarter-on-quarter % change 1.7% 1.6% 1.6% 1.7% Less than 2 Bedroom (Rand/square metre) 12 277 13 819 15 255 14 754 15 099 15 419 15 749 - year-on-year % change 12.4% 12.6% 10.4% 11.0% 10.7% 10.3% 9.7% - quarter-on-quarter % change 2.7% 2.3% 2.1% 2.1% 2 Bedroom (Rand/square metre) 9 781 10 413 11 096 10 810 10 996 11 186 11 391 - year-on-year % change 7.5% 6.5% 6.6% 6.0% 6.4% 6.7% 7.1% - quarter-on-quarter % change 1.6% 1.7% 1.7% 1.8% 3 Bedrooms and More (Rand/square metre) 8 660 9 108 9 474 9 354 9 430 9 513 9 600 - year-on-year % change 7.3% 5.2% 4.0% 4.5% 4.2% 3.8% 3.6% - quarter-on-quarter % change 0.9% 0.8% 0.9% 0.9% AVERAGE HOUSE PRICE BY MAJOR SECTIONAL TITLE SEGMENT
  • 10. 2015 2016 2017 Q1-2017 Q2-2017 Q3-2017 Q4-2017 HOUSE PRICES BY HOME SIZE Large Homes (Rand) 1 898 346 1 953 320 2 085 953 2 027 753 2 069 185 2 105 596 2 141 277 - year-on-year % change 3.8% 2.9% 6.8% 5.5% 6.7% 7.4% 7.6% - quarter-on-quarter % change 1.9% 2.0% 1.8% 1.7% Medium Sized Homes (Rand) 1 050 226 1 106 532 1 145 067 1 130 479 1 141 033 1 150 195 1 158 559 - year-on-year % change 6.4% 5.4% 3.5% 3.7% 3.5% 3.4% 3.4% - quarter-on-quarter % change 0.9% 0.9% 0.8% 0.7% Small Sized Homes (Rand) 566 176 613 802 651 383 637 507 647 115 656 043 664 866 - year-on-year % change 8.4% 8.4% 6.1% 6.3% 6.1% 6.1% 6.0% - quarter-on-quarter % change 1.6% 1.5% 1.4% 1.3% AVERAGE HOUSE PRICE BY SIZE CATEGORY